
Benchmark Electronics' Stagnant Revenues and Operating Profit Erosion in 2025
A detailed analysis of Benchmark Electronics’ flat revenue growth contrasted by a significant decline in operating income during fiscal year 2025, alongside leadership changes and capital deployment strategies.
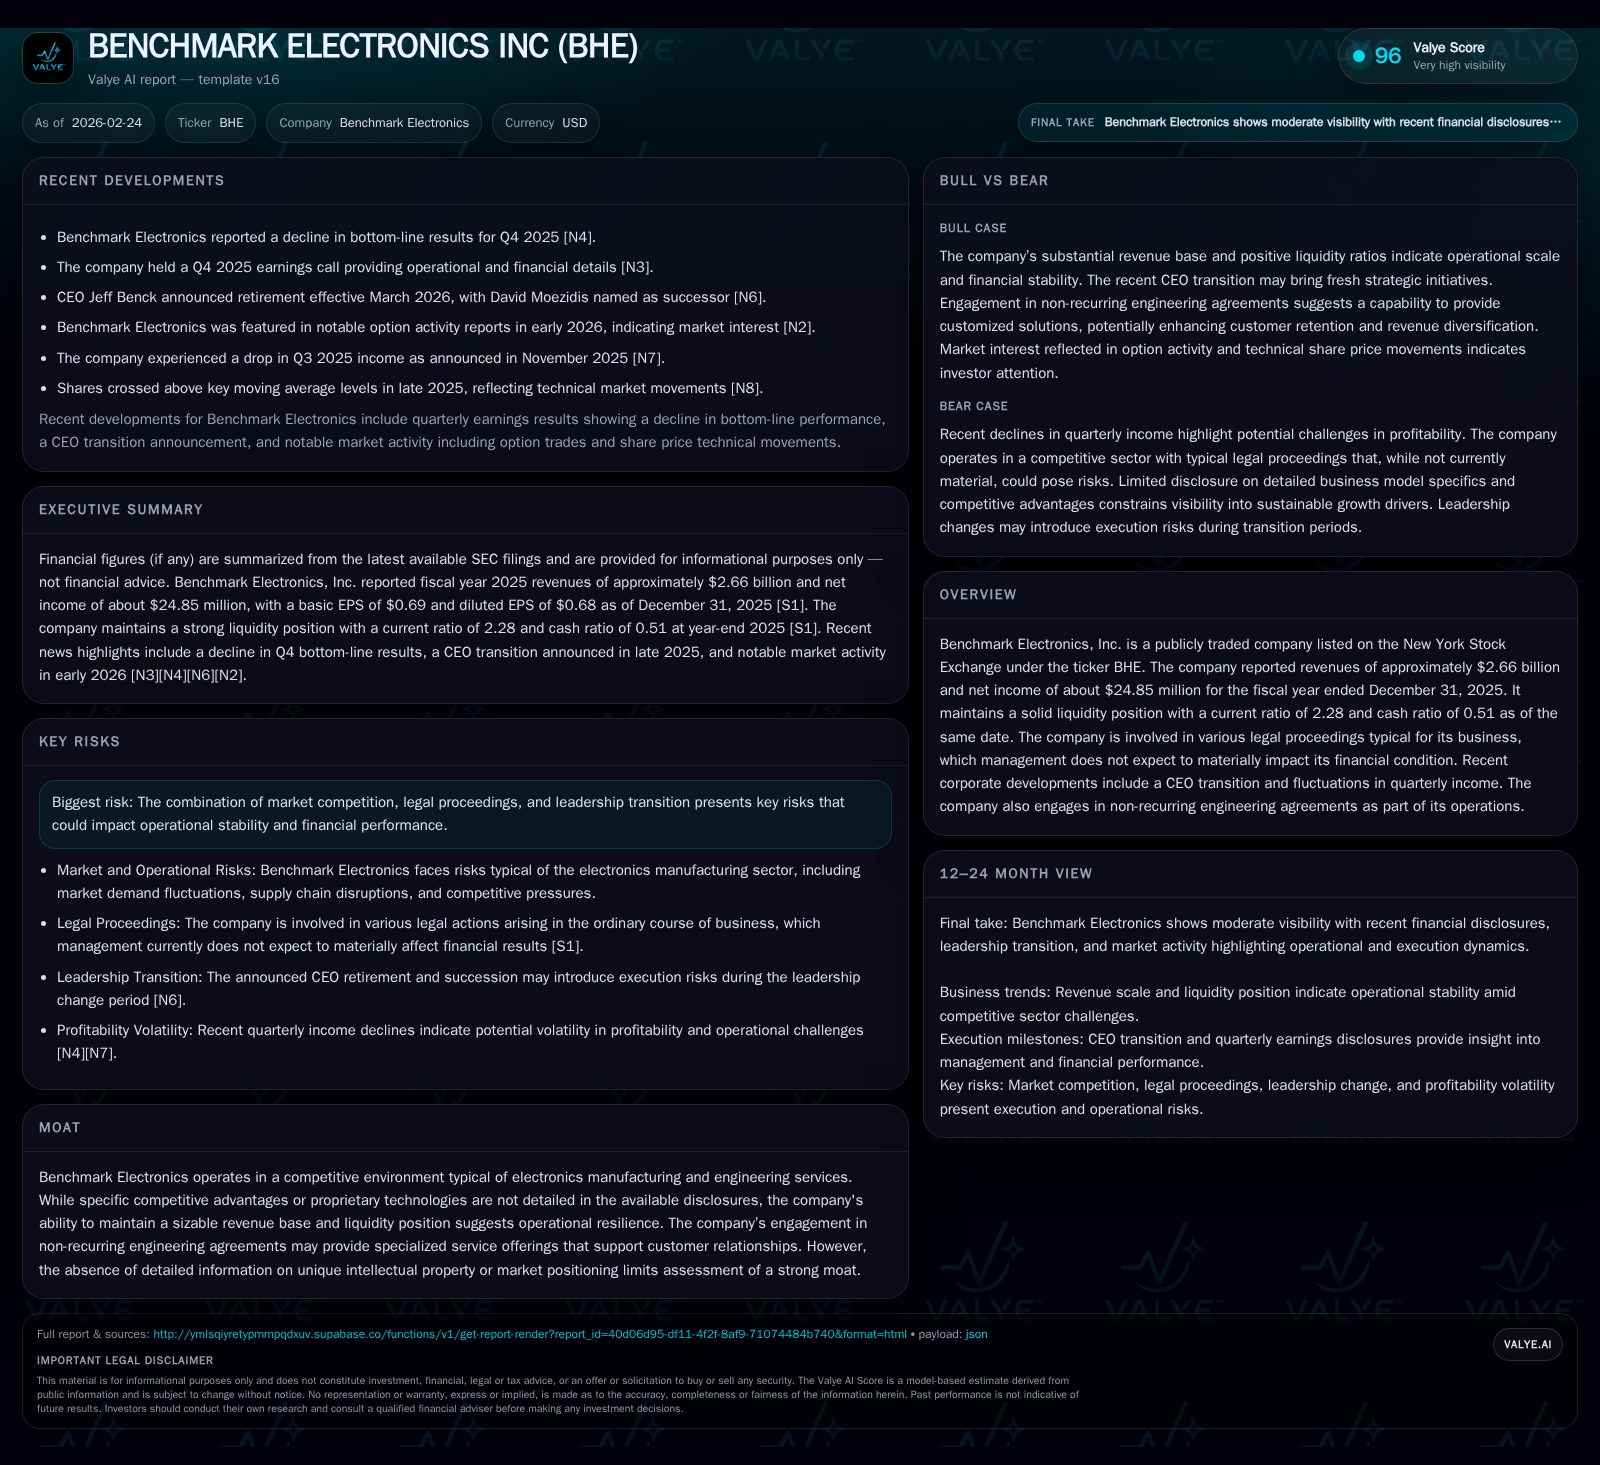
Benchmark Electronics ended fiscal year 2025 with revenues essentially unchanged at $2.66 billion, but experienced a sharp 30.5% decline in operating income to $76 million and a 60.8% drop in net income to $24.85 million, signaling margin pressures. The company’s liquidity remains sound, with a current ratio of 2.28, supporting operational stability amid legal and competitive challenges. Recent CEO transition and increased share repurchases highlight management’s focus on stewardship while monitoring volatility in quarterly profits. Upcoming milestones for 2026 include execution on strategic initiatives under new leadership and the potential impact of restructuring charges.
Resilient Revenue Despite Operating Income Decline in FY2025
Benchmark Electronics closed the fiscal year ending December 31, 2025 with revenues of approximately $2.66 billion, effectively unchanged from the prior year’s $2.656 billion, marking a negligible year-over-year growth rate of just 0.1% [F1]. This plateau contrasts sharply with operating income, which contracted from $109 million in FY2024 to approximately $76 million in FY2025 — a decline exceeding 30% [F1]. Net income reflected an even steeper fall, plunging by nearly 61% to about $24.85 million from $63.3 million the prior year [F1]. The divergence highlights significant margin compression likely driven by cost inflation or pricing pressures prevalent across the electronics manufacturing services (EMS) sector.
Profitability erosion may result from rising input costs outpacing pricing adjustments, shifts toward lower-margin product mix, or increased expenditures related to non-recurring engineering agreements integral to Benchmark's specialty services [N1][N4]. While segment-specific data are not publicly disclosed, these challenges align with broader EMS industry trends characterized by competitive intensity and margin pressures.
Historical performance (annual)
| FY | Rev ($bn) | Net ($mm) | CFO ($mm) | OpInc ($mm) | Rev YoY | Net YoY |
|---|---|---|---|---|---|---|
| 2025 | 2.7 | 25 | 124 | 76 | +0.1% | -60.8% |
| 2024 | 2.7 | 63 | 189 | 109 | -6.4% | -1.5% |
| 2023 | 2.8 | 64 | 174 | 110 | -1.6% | -5.7% |
| 2022 | 2.9 | 68 | -177 | 90 |
Note: Omitted columns lack sufficient annual XBRL coverage in the provided tags (need ≥2 annual points): Capex. Source: SEC companyfacts cache [F1].
Capital returns and efficiency (annual)
| FY | Div ($mm) | Buybacks ($mm) | FCF ($mm) |
|---|---|---|---|
| 2025 | 24 | 27 | 88 |
| 2024 | 24 | 5 | 158 |
| 2023 | 23 | 0 | 101 |
| 2022 | 23 | 9 | -221 |
Source: SEC companyfacts cache [F1].
Note: CFO YoY % excludes anomalous negative CFO in FY22; Capex spike in FY23 likely reflects plant upgrade investments.
Legal Proceedings and Risk Factors
Benchmark Electronics is involved in various legal actions typical of EMS companies including intellectual property claims and contract disputes as detailed in Note 15 of their consolidated financial statements [S1][S4][S6]. Management asserts these do not pose material adverse effects on financial position or operations.
Industry risks include compliance with global product standards and potential warranty claims; however, no specific litigation events currently threaten the company materially [S4]. This risk profile is consistent with companies operating complex global supply chains under stringent quality requirements.
Leadership Transition and Strategic Outlook
A CEO succession plan is scheduled for March 31, 2026 with David Moezidis succeeding Jeffrey Benck [S17]. Moezidis has concurrently been promoted to President with corresponding compensation adjustments reflecting expanded leadership responsibilities [S17].
This internal leadership transition aims for strategic continuity during a period of earnings pressure and operational challenges [N1]. Potential future milestones include execution of strategic initiatives under new leadership and possible restructuring charges related to the transition [S7].
Quarterly Earnings Volatility
Q4 fiscal year-end results showed softness attributed partly to non-recurring engineering agreement costs and other episodic charges impacting margins [N1][N4]. Such volatility illustrates challenges EMS providers face balancing bespoke engineering projects alongside volume manufacturing contracts.
Capital Structure and Liquidity Position
At year-end, Benchmark's current assets totaled approximately $1.45 billion against current liabilities near $636 million yielding a strong current ratio of about 2.28 [F1]. Cash and equivalents stood at roughly $322 million supporting liquidity needs.
Debt levels remain manageable without significant near-term maturities posing refinancing risks as per recent filings [S8–S16]. These metrics indicate disciplined working capital management amid industry headwinds.
Capital Allocation: Dividends, Share Repurchases & Capex
Despite reduced profitability, Benchmark sustained dividends totaling approximately $24.4 million for FY25—consistent with prior years—and markedly increased share repurchases to roughly $26.8 million versus $5.1 million in FY24 [F1][S14][S17][S18].
Capital expenditures rose modestly to about $35.6 million reflecting continued investment in production capacity and technology upgrades essential for competitiveness [F1][S7].
Return on equity is subdued at approximately 2.3%, limited by compressed net margins relative to an equity base exceeding $1 billion [F1], underscoring ongoing challenges converting revenue into elevated returns.
Outlook and Forward-Looking Considerations
Explicit guidance for full-year fiscal 2026 is limited [N1][S7] but key areas for investor attention include revenue trends, margin stabilization efforts including cost management initiatives, restructuring-related expenses during leadership transition, and progress on tax incentive awards.
Monitoring order backlog health and shifts toward higher-margin engineering services will be critical indicators of potential inflection points amid flat revenue growth juxtaposed with prior profit erosion.
Summary: Navigating Competitive EMS Landscape Amid Operational Pressures
Benchmark operates within a highly competitive EMS sector marked by tight margins and rapid technological change where scale advantages coexist with niche engineering services differentiation [F1][S4][S6].
Without proprietary moats, operational resilience supported by strong liquidity positions and diversified service contracts remains crucial.
Legal risks are present but assessed as non-material currently while leadership transitions offer both uncertainty and opportunity for strategic recalibration [S4][S6][S17].
Prudent capital allocation reflected in dividends and increased buybacks despite margin compression signals management commitment to shareholder value amid challenging conditions.
This analysis integrates publicly disclosed financial data from SEC filings and relevant news sources up through February 24, 2026 without speculative forecasts beyond stated information or implied future scenarios requiring confirmation in forthcoming disclosures. Readers should consider these findings as contextual information rather than investment advice.
Disclaimer: This is research-only, informational analysis and not investment advice. It may include AI-generated interpretation and general industry context. Always verify important details using primary sources.
Comments