
Braemar Hotels & Resorts' Shift from Peak Operating Income to Net Losses: Unpacking the 2025 Performance
Braemar’s luxury hotel portfolio boasts strong RevPAR credentials, yet escalating debt costs and fixed advisory fees drove a sharp earnings reversal in 2025.
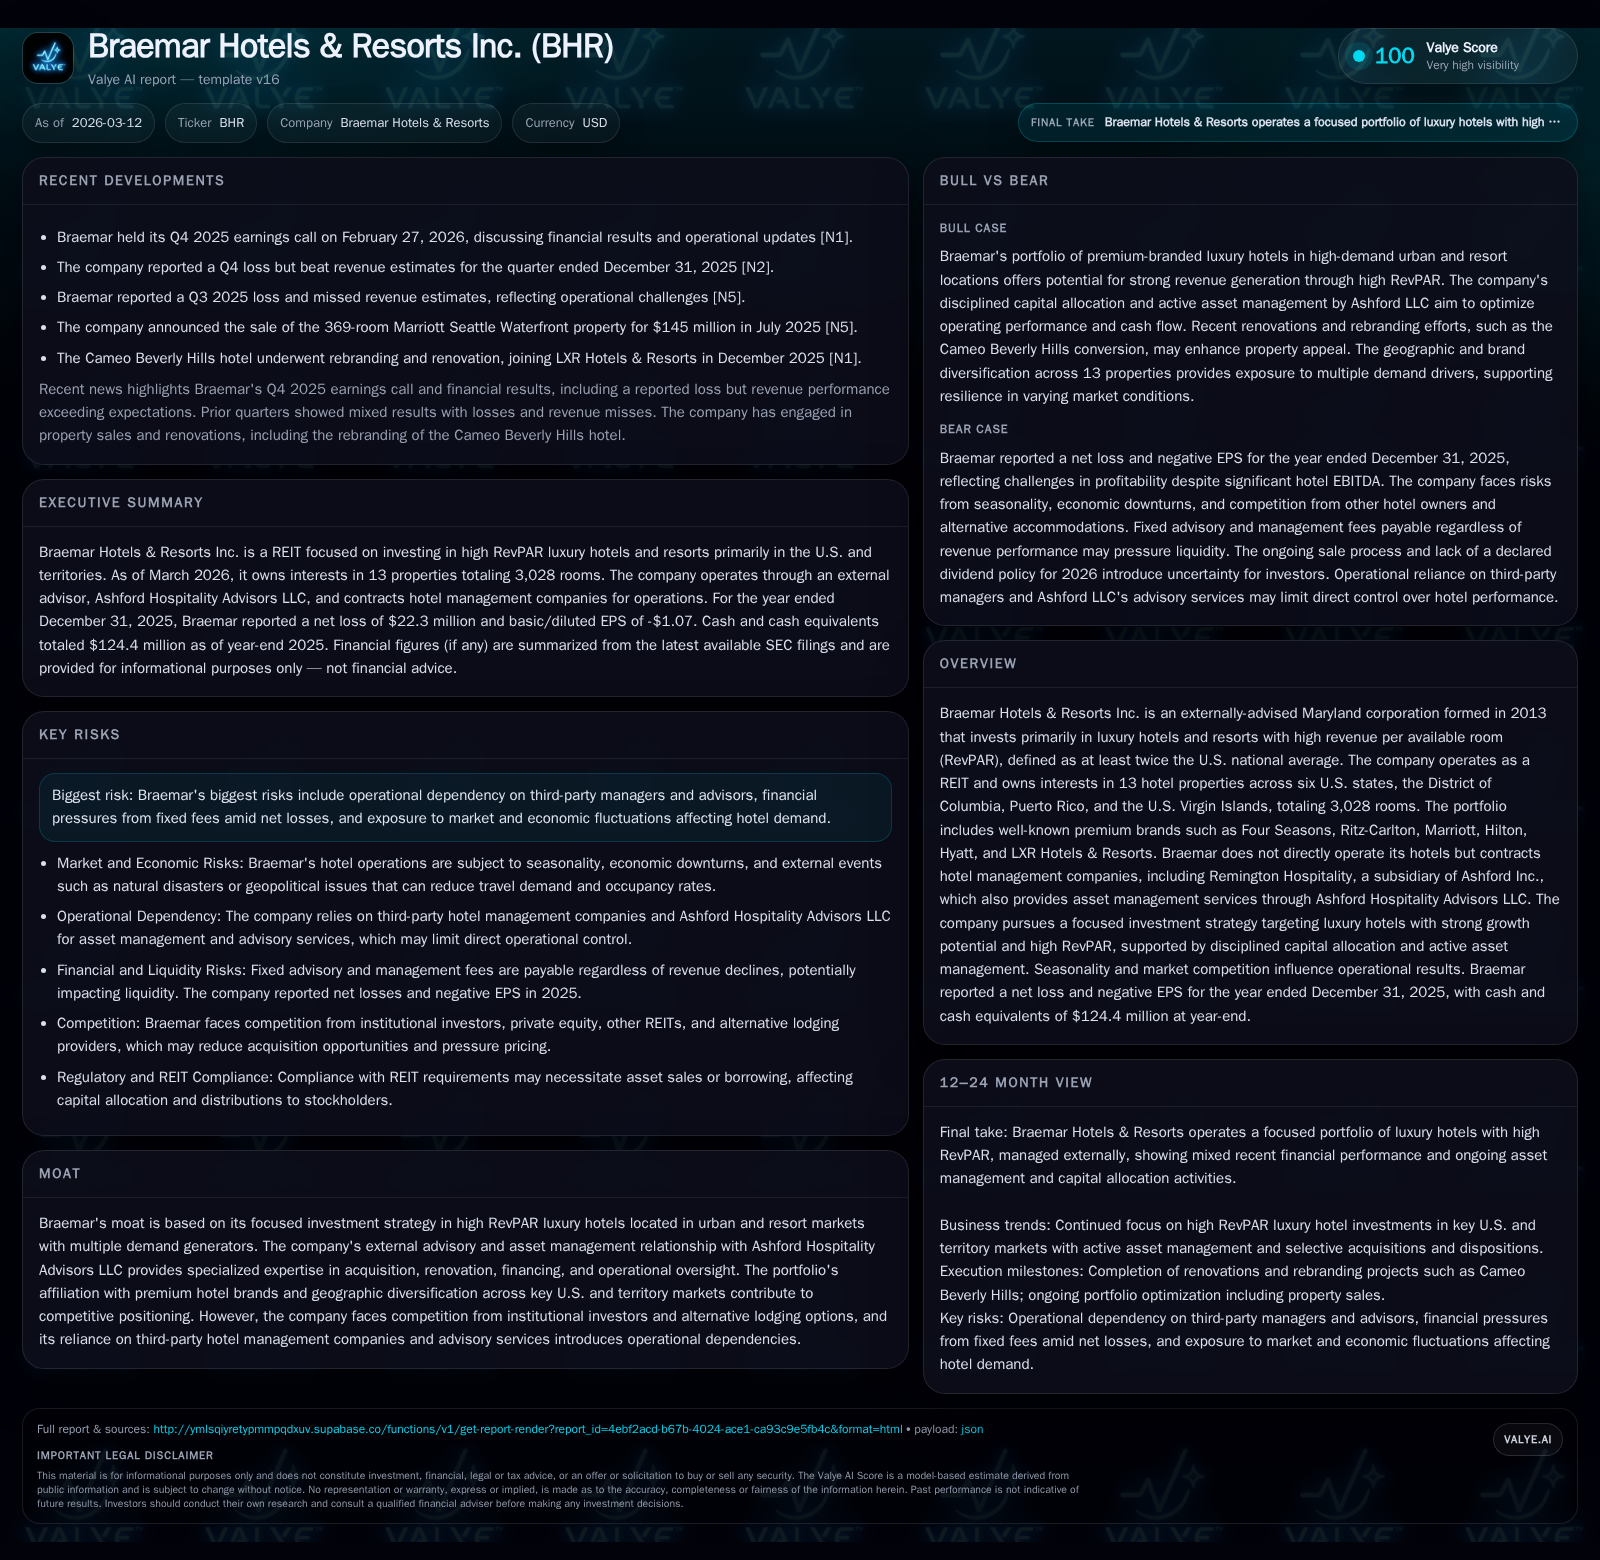
Braemar Hotels & Resorts experienced significant volatility in its financial results, reaching peak operating income in 2024 before reporting net losses in 2025. The company's externally managed REIT structure, focused on luxury hotels with RevPAR at least twice the U.S. average, provides both strategic advantage and operational dependencies. Rising interest expenses on variable-rate debt combined with fixed fees paid to its external advisor Ashford Hospitality Advisors LLC pressured profitability. Management is exploring strategic alternatives amid liquidity constraints, while dividend sustainability remains uncertain given negative returns on equity and diminishing free cash flow.
Braemar’s Distinctive Operating Model and Portfolio Composition
Braemar Hotels & Resorts Inc., established in 2013 as an externally advised Maryland corporation taxed as a REIT, focuses exclusively on high RevPAR luxury hotels defined as generating at least twice the U.S. national average RevPAR — approximately $200 per room nightly for 2025 standards [S1]. Its portfolio includes interests in 13 premium branded properties across six U.S. states, the District of Columbia, Puerto Rico, and the U.S. Virgin Islands totaling about 3,028 rooms [S1][F1].
Braemar contracts hotel management companies rather than operating properties directly. Remington Hospitality, a subsidiary of Ashford Inc., manages five properties while others are operated by third parties under long-term agreements. Ashford Hospitality Advisors LLC serves as asset manager responsible for acquisition support, renovations oversight, financing strategies, budget reviews, and operational accountability [S1]. This external management model enables focused asset oversight but creates dependencies on service providers’ performance and aligned incentives.
Geographic diversification mitigates concentration risk but ties success closely to urban and resort markets with robust demand drivers. Seven of thirteen hotels are managed under Marriott or Hilton affiliates’ brands — reflecting reliance on these dominant hospitality players for brand value creation [S27]. The focus on high RevPAR hotels exposes Braemar primarily to business travelers and affluent leisure segments demanding premium experiences.
Historical Financial Trends: Volatility in Revenue and Profitability
The table below summarizes key financial metrics for Braemar Hotels & Resorts over recent years based on available data [F1]:
Historical performance (annual)
| FY | Net ($mm) | CFO ($mm) | OpInc ($mm) | Capex ($mm) | Net YoY |
|---|---|---|---|---|---|
| 2025 | -22 | 41 | 72 | -1218.3% | |
| 2024 | -2 | 67 | 129 | +93.7% | |
| 2023 | -27 | 85 | 62 | 0 | -252.1% |
| 2022 | 18 | 109 | 68 | 354 |
Source: SEC companyfacts cache [F1].
Capital returns and efficiency (annual)
| FY | Div ($mm) | Buybacks ($mm) | FCF ($mm) |
|---|---|---|---|
| 2025 | 1 | ||
| 2024 | 52 | 0 | |
| 2023 | 53 | 19 | 85 |
| 2022 | 21 | 7 | -245 |
Source: SEC companyfacts cache [F1].
Revenue data is only available through FY2019; however, operating income surged from approximately $68 million in FY2022 to a peak near $129 million in FY2024 before falling sharply by nearly 44% in FY2025 amid rising costs [F1]. Net income swung from modest losses in FY2024 to significant losses exceeding $22 million in FY2025 despite resilient revenue trends prior to pandemic disruptions [F1]. Operating cash flow declined substantially over this period while capital expenditures dropped sharply after heavy investments in earlier years.
Factors Behind the Earnings Reversal in 2025
Despite resilient demand supporting revenue growth pre-pandemic ([N2]), several cost pressures reversed earnings gains:
- Fixed advisory fees payable to Ashford Hospitality Advisors LLC increase with Braemar’s market capitalization and indebtedness levels under their advisory agreement [S9][S11].
- Total indebtedness stood at approximately $1.1 billion at December 31, 2025 with about $1 billion subject to variable interest rates tied to SOFR plus a spread raising interest expense amid rising rates post-pandemic recovery cycles [S4][S8][F1].
- Loan agreements contain cash trap provisions that restrict distributions when hotel performance declines below thresholds required by lenders potentially constraining liquidity and dividend capacity [S4][S17].
- Legal settlement accruals related to employment class actions added non-operating charges though were relatively immaterial compared to structural cost pressures [S23].
- Macroeconomic sensitivity of luxury hotels to economic cycles and geopolitical tensions impacts demand variability given reliance on business travel and high-end leisure segments [S23].
Operational Dependencies and Market Risks
While Ashford Hospitality Advisors LLC provides acquisition expertise and asset management oversight aiming to optimize performance across Braemar’s portfolio ([S13]), reliance on external hotel operators (Remington Hospitality manages five properties) introduces operational leverage risks as coordination across multiple contracts can complicate performance optimization efforts [S26][S27].
Concentration among major brands such as Marriott and Hilton introduces brand-related risks including fee structures that could erode margins if renegotiations occur unfavorably or reputational issues arise ([S18][S27]). Additional industry challenges include labor availability pressures affecting personnel costs and regulatory changes impacting REIT taxation or governance norms ([S23]). Geopolitical tensions may further affect international travel demand.
Capital Structure Challenges and Liquidity Constraints
Braemar’s substantial indebtedness—overwhelmingly variable rate—creates refinancing risk heightened by covenants including cash traps that can restrict access to operating profits when property performance weakens ([S4][S17]). Refinancing debt could prove costly or difficult amid constrained credit markets potentially forcing asset sales at disadvantageous prices or increased leverage exposure ([S11]). Interest expense consumes a growing share of operating income due to higher benchmark rates since early-2022 combined with fixed advisory fees linked directly to indebtedness levels creating feedback loops that may not align with shareholder interests ([S9][F1]).
Dividends, Repurchases, and Shareholder Returns
Despite declining operating cash flow, Braemar maintained dividend payments exceeding $51 million in FY2024 indicating payout ratios above free cash flow generation capacity which may not be sustainable long term without deleveraging ([F1][S5]). Return on equity was negative roughly -16% in FY2025 reflecting net losses relative to equity base signaling economic erosion under current conditions ([F1]). Share repurchases have been minimal with less than $1 million spent under current authorization through FY2025 reflecting conservative capital deployment amid liquidity limitations ([F1][S6]).
Strategic Alternatives Under Review
The board has initiated a strategic review process exploring potential sale transactions either for the entire company or selective asset dispositions aimed at improving capital flexibility or shareholder value realization amid challenging market conditions ([S5]). Execution risks remain significant given volatile financing environments and uncertain timing or terms achievable.
Outlook: Metrics To Monitor Going Forward
Key indicators for investors include quarterly updates on revenue per available room (RevPAR) trends reflecting underlying asset health; progress on refinancing negotiations addressing impending maturities; occupancy recovery trajectories relative to pre-pandemic baselines; developments regarding strategic alternatives; changes in debt covenant compliance status; interest expense trends including hedging effectiveness; advisory fee adjustments tied to capital structure changes; and shifts within third-party management arrangements signaling operational shifts relevant for margin expansion or risk mitigation ([N1][N2]).
This analysis synthesizes information available through SEC filings dated March 12, 2026 ([S1]-[S29]), financial data snapshots ([F1]), and recent earnings call transcripts ([N1], [N2]) without providing investment recommendations.
Disclaimer: This is research-only, informational analysis and not investment advice. It may include AI-generated interpretation and general industry context. Always verify important details using primary sources.
Comments