
BJ's Wholesale Club Elevates Membership Growth and Operational Efficiency in Q1
BJ's Q1 2026 results reveal robust membership income growth, aggressive share repurchases, and strategic supply chain investments underpinning its competitive advantage.
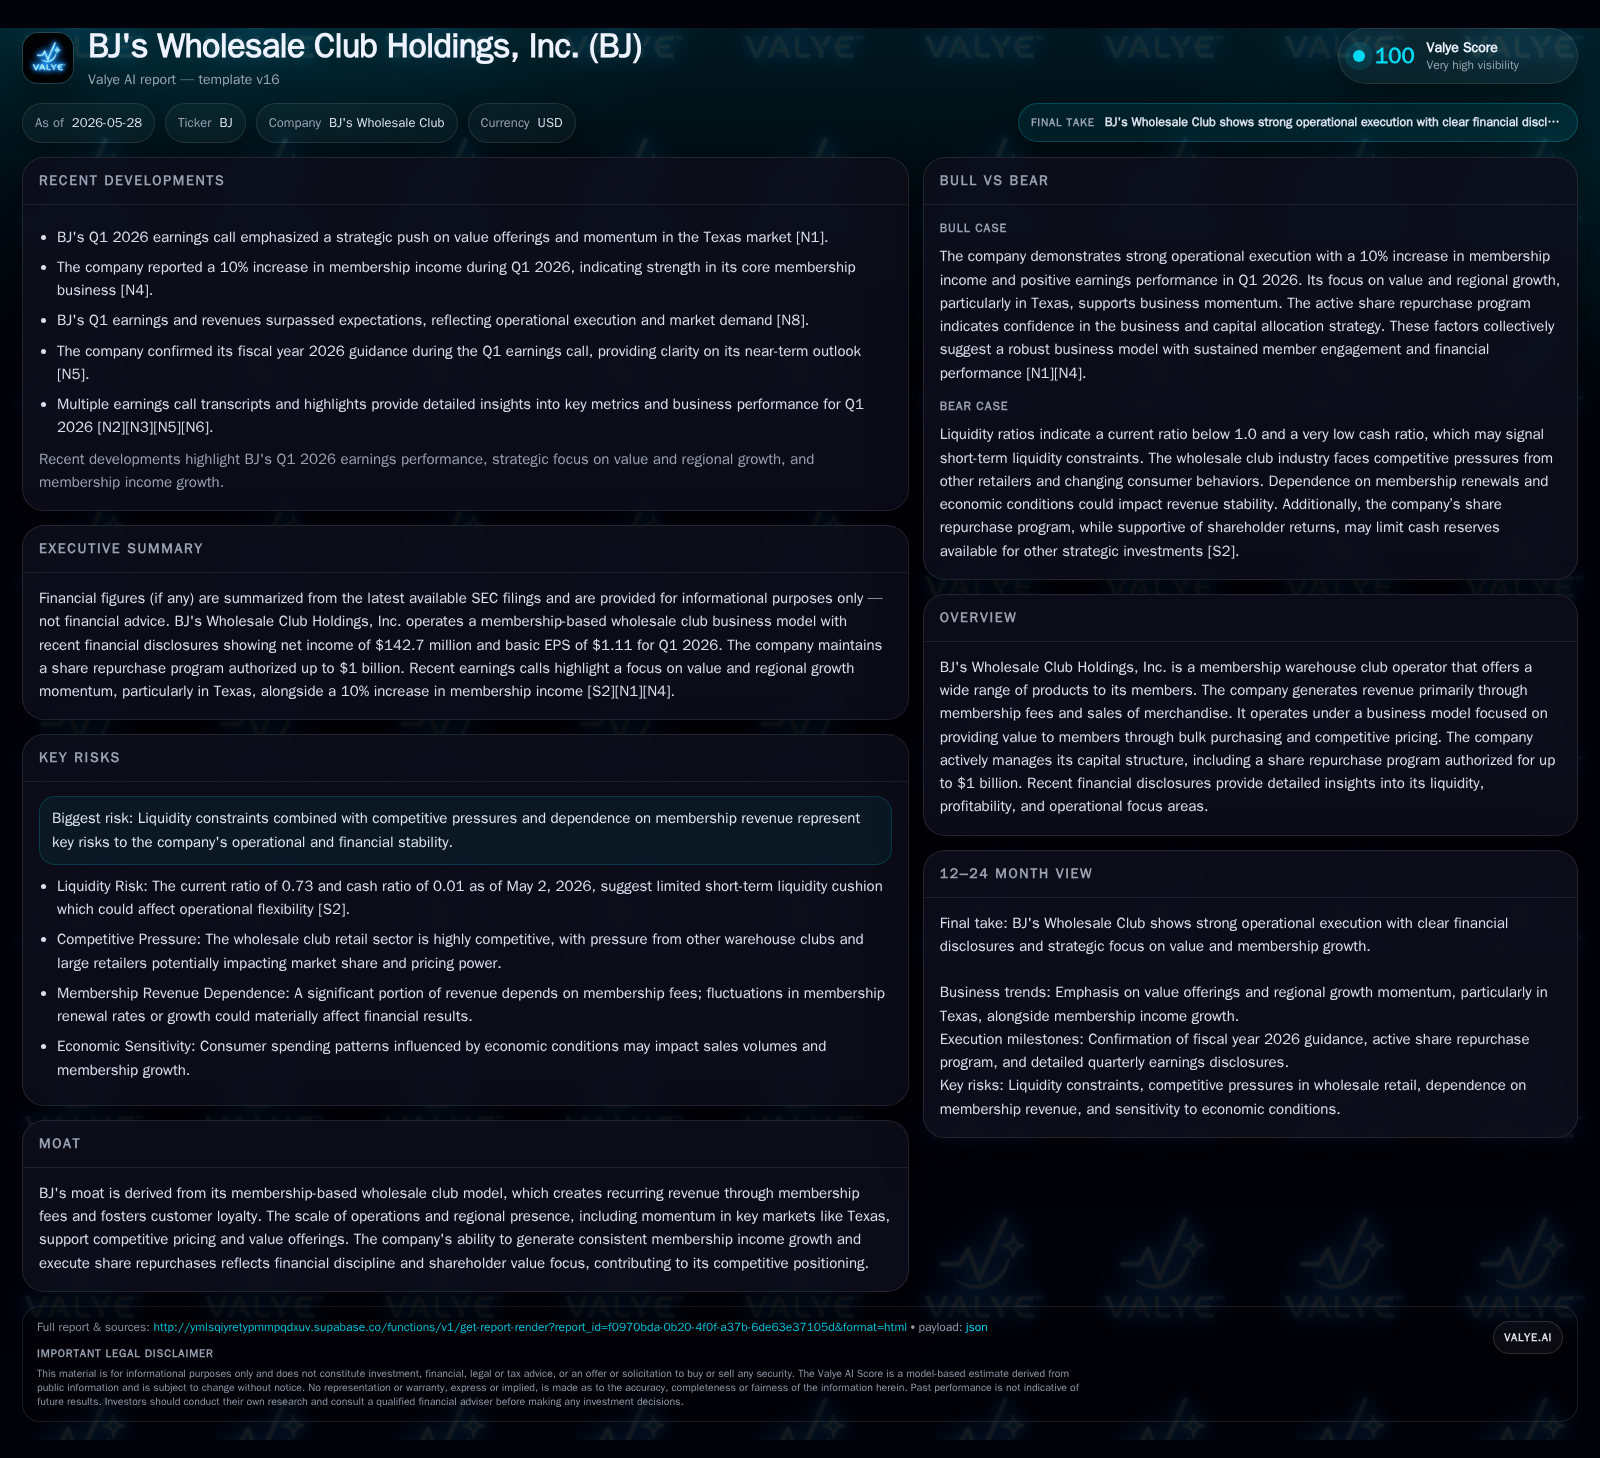
In the first quarter of fiscal 2026, BJ's Wholesale Club reported a 10% increase in membership fee income, signaling strong customer loyalty and recurring revenue strength. The company repurchased over $450 million in common stock under its ongoing share repurchase program, reflecting management’s confidence and capital discipline. Regional momentum, particularly in Texas, combined with supply chain capacity expansion initiatives such as a new Ohio distribution center planned for 2027, position BJ’s well for sustained growth. However, liquidity remains tight with a current ratio below 1, posing watchpoints in an intensely competitive warehouse club market.
Q1 Operating Results: Strengthened Membership Income and Share Repurchases
BJ’s Wholesale Club’s latest quarterly filing for the thirteen weeks ended May 2, 2026 demonstrates solid operational momentum anchored by membership income growth. Membership fee income increased approximately 10% year-over-year in Q1, maintaining the company’s long-standing record of over 25 consecutive years of growth in this high-margin recurring revenue stream [S2], [N4]. This growth reflects sustained customer loyalty within BJ's membership warehouse club model.
Alongside top-line strength, BJ’s actively deployed capital through its ongoing share repurchase program authorized at $1 billion since late 2024. During Q1 alone, the company repurchased approximately 2.3 million shares at an average price near $96 per share, totaling over $450 million spent on buybacks — a clear indication of management confidence in long-term value creation at current prices [S2]. This capital allocation strategy balances reinvestment needs with returning value to shareholders.
The combination of strong membership fee momentum and disciplined buybacks provides financial stability that supports BJ’s strategic initiatives amid an evolving retail environment.
Membership Warehouse Model: Revenue Drivers and Product Quality Insights
BJ's Wholesale Club operates on a dual-revenue model primarily driven by annual membership fees ranging typically from $60 to $120 depending on the tier (Club vs [S1]. Club+). These fees provide steady cash flow independent of merchandise sales volume fluctuations. In fiscal year 2025, membership fees contributed nearly half a billion dollars in income alone
Complementing this is merchandise sales comprising groceries (including private labels), fresh foods, general merchandise, gasoline, and ancillary services [S1]. BJ’s markets itself on delivering up to a 25% savings advantage on branded grocery items versus traditional supermarkets through bulk purchasing efficiencies and tight cost control verified via independent third-party price comparisons conducted biweekly across major competitor banners
A critical element supporting margins is BJ’s proprietary private label brands Wellsley Farms (food) and Berkley Jensen (general merchandise), which represent about 27% of total net sales excluding fuel. Private label penetration not only drives higher margin but also enhances product exclusivity and customer stickiness.
Digital innovation further elevates member experience via mobile app-enabled checkout (ExpressPay), BOPIC grocery pickups, Same-Day Select unlimited delivery option, plus integration with DoorDash and Instacart marketplaces — all tailored for convenience and evolving consumption patterns [S1].
Industry Context: Competitive Positioning Amid Regional Concentration and Peer Dynamics
BJ’s footprint includes 263 clubs mainly concentrated in the eastern U.S., with a dominant presence in densely populated New England markets where it holds roughly triple the number of clubs compared to nearest warehouse club competitors. Expansion momentum has picked up notably within Texas markets where BJ's seeks to leverage regional demand dynamics [S1], [N1].
Warehouse clubs generally rely heavily on recurring membership fees which create switching costs that shield incumbents from transient competition risks. Unlike discount big-box or mass retailers without membership models, BJ’s enjoys predictable revenue inflows enhancing its competitive moat.
However, the broader warehouse club industry is competitive with strong peers like Costco and Sam’s Club pushing pricing aggressiveness and service upgrades. Seasonality impacts quarterly performance due to holiday-driven volume swings plus timing effects of new store openings that carry ramp-up costs diluting short-term profitability [S1], [N3].
BJ’s has pursued selective supply chain investments to differentiate on product availability and logistics efficiency compared to peers operating larger but less regionally focused networks.
Growth Catalysts: Supply Chain Expansion, Digital Services, and Market Penetration
Capex plans include opening a fourth non-perishable distribution center in Ohio anticipated during calendar year 2027 — a significant capacity expansion targeting improved inventory flow for northern Midwestern clubs as well as overall network resilience as the footprint grows [S1]. This distributed logistics model is vital given the scale demands of high-volume grocery fulfillment.
On the digital front, continuous enhancements around express checkout capabilities (ExpressPay) combined with expanded digital delivery options (Same-Day Select subscription service) are anticipated to drive higher basket sizes per member by blending convenience with value proposition messaging [S1], [N2].
New club openings remain steady but measured; management emphasizes disciplined growth aligned with data-driven market selection focusing on densely populated trade areas offering attractive member acquisition economics. This approach supports sustainable same-store sales improvement alongside incremental geographic market gain.
Risks and Constraints: Liquidity Challenges, Competition, and Economic Factors
Despite operational positives, liquidity constraints warrant attention [F1]. The company’s current ratio stood near 0.73 as of May 2, 2026, indicating tight short-term liquidity management challenges under current working capital cycles
Competitive pressures from peers demanding aggressive pricing strategies could erode margin potential especially if inflationary pressures persist affecting cost pass-through capabilities. Furthermore economic downturns impacting consumer discretionary spending might pressure membership renewals or frequency of club visits given the discretionary nature of some merchandise categories.
Key Monitoring Points: Guidance Validation, Membership Trends, and Expansion Execution
Important near-term milestones include verifying full-year fiscal 2026 guidance commitments during upcoming earnings updates incorporating continued membership income trajectories along with same-store sales trends reflecting execution efficacy [S2], [N8].
Tracking progress toward opening the Ohio distribution center will provide insight into capital project management efficiency given its strategic role as a logistics backbone augmentation.
Monitoring average selling price trends within merchandise categories will signal ability to navigate inflation while sustaining value perception necessary for retention.
Share repurchase pacing relative to authorization limits will offer further perspective on management’s return-of-capital priorities balancing reinvestment needs.
Financial Profile Snapshot: Balance Sheet and Profitability Metrics Supporting Strategic Actions
The latest quarter ended May 2 provided context rich profit metrics — operating income reached approximately $816.6 million supporting a net income figure around $578.4 million per latest available data points reflecting full year-end January performance but indicative of overall profitability character despite seasonality effects detailed elsewhere [F1]
Although cash reserves are limited relative to revolving liabilities creating liquidity management challenges reflected by the sub-1 current ratio (0.73), BJ's maintains access to committed financing lines within existing covenant parameters allowing continued capex spend including warehouse build outs critical for future growth layers.
This analysis synthesizes recent SEC filings alongside relevant market news to present an informed overview without conjecture or investment advice regarding BJ's Wholesale Club Holdings, Inc.’s operational progress amidst industry dynamics as of mid-2026.
Disclaimer: This is research-only, informational analysis and not investment advice. It may include AI-generated interpretation and general industry context. Always verify important details using primary sources.

Comments