
BJ's Restaurants Drives Profit Turnaround Through Expansion and Operational Discipline
BJ's Restaurants capitalizes on its upscale dining experience and proprietary craft beers to fuel growth while navigating rising costs and competitive pressures.
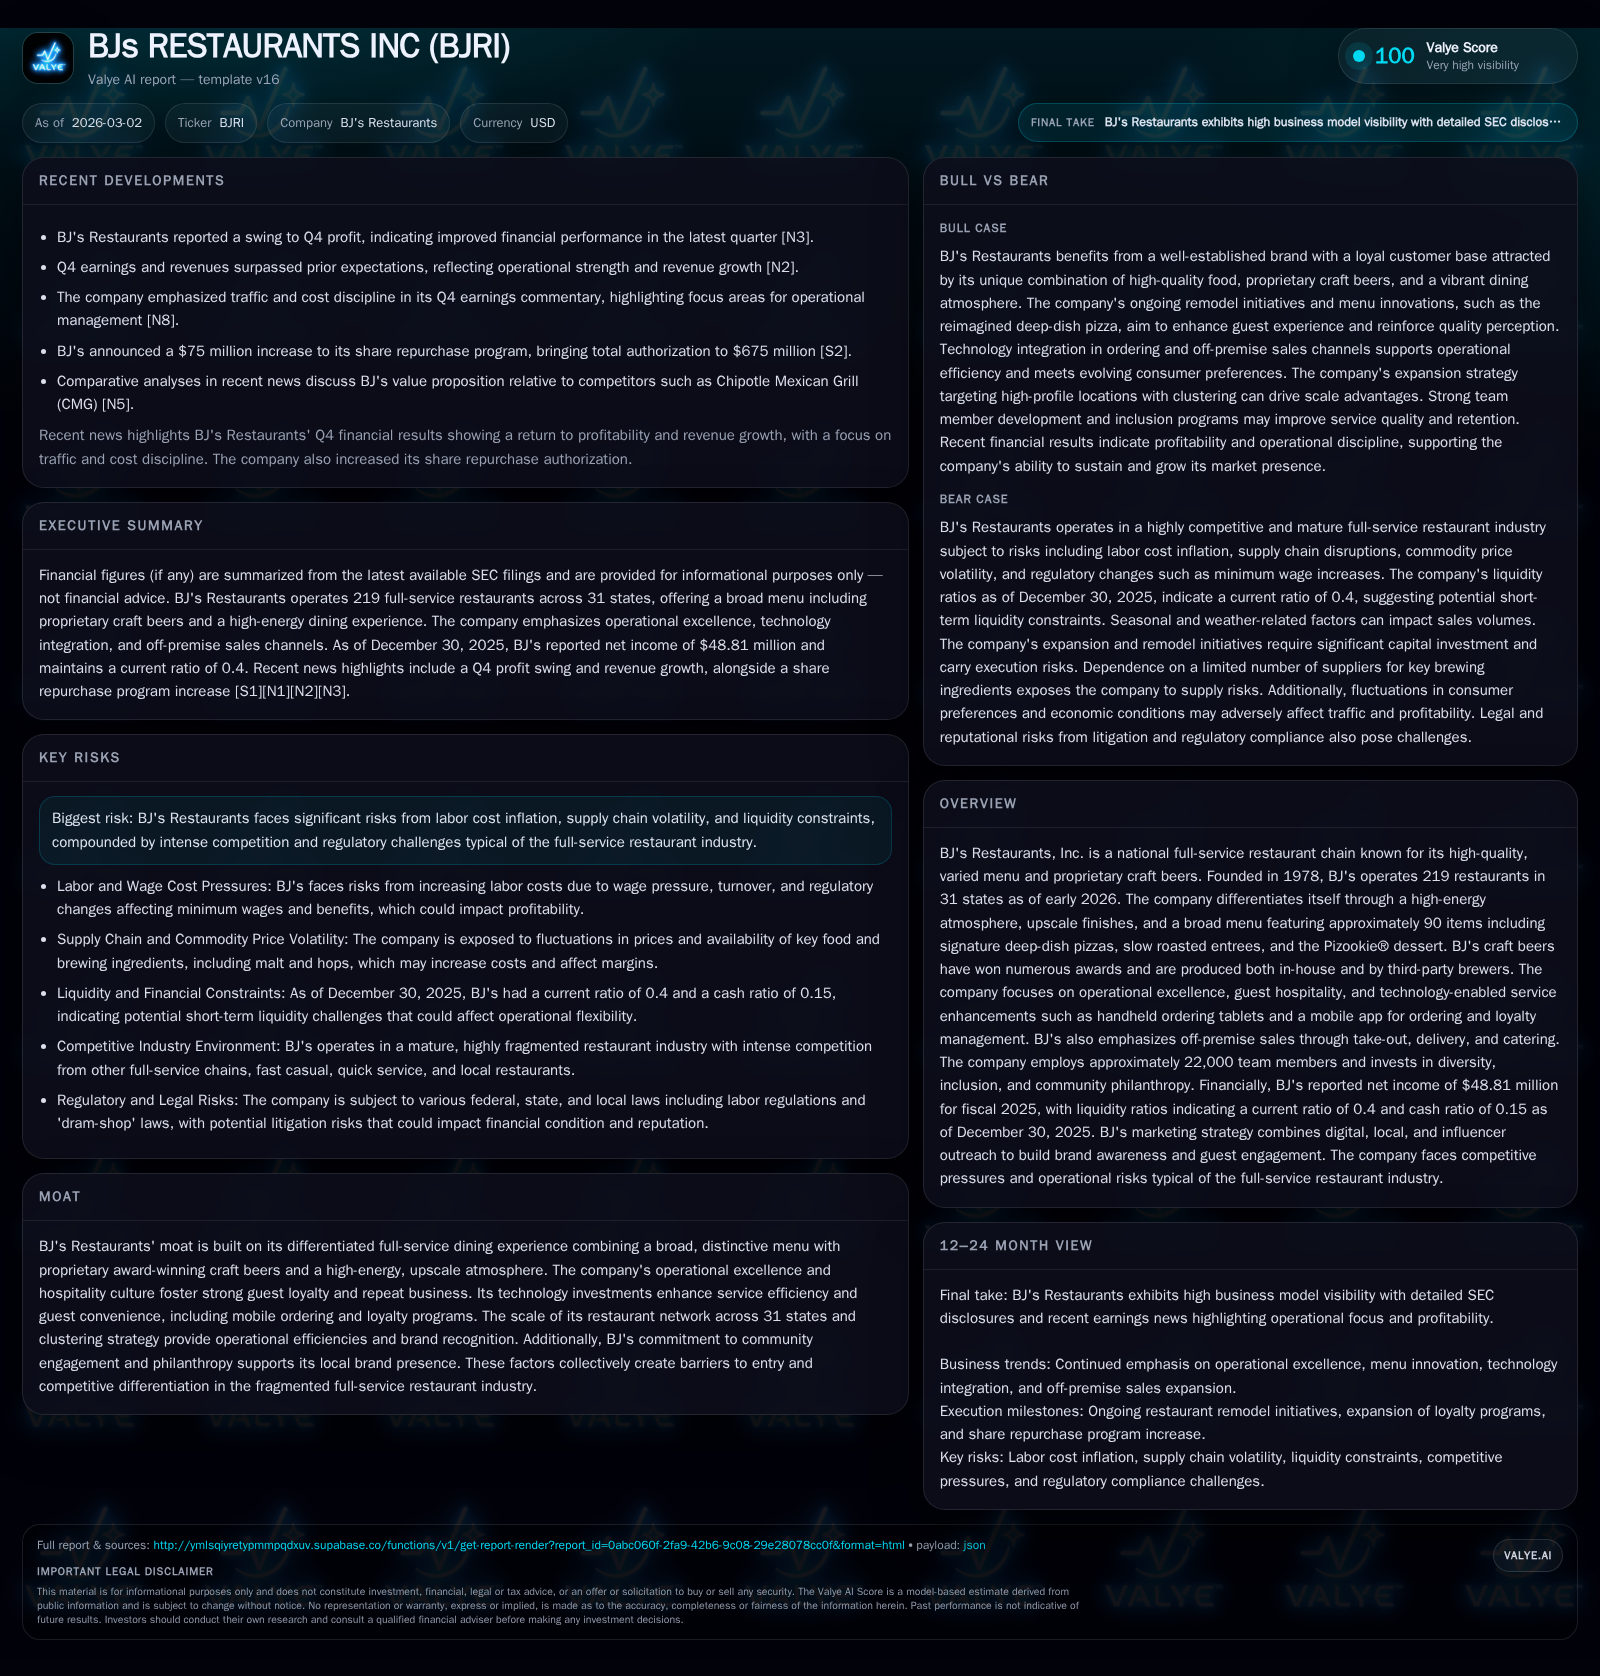
BJ's Restaurants Inc. recovered significantly in fiscal 2025, swinging from losses in prior years to a net income of $48.8 million supported by robust operating income and disciplined cost management. The company's growth strategy hinges on expanding its footprint with a new restaurant prototype aimed at improving profitability and operational efficiency. Challenges such as labor inflation, supply chain disruptions, and regulatory risks remain critical to monitor. Capital allocation has been active with increased share repurchases alongside continued investment in restaurant development.
Company Overview
Founded in 1978 with a single pizzeria featuring Chicago-style deep-dish pizza with a California twist, BJ's Restaurants Inc. has evolved into a nationally recognized full-service restaurant brand operating 219 locations across 31 states by early 2026 [S1][S18]. The company distinguishes itself through an extensive menu of approximately 90 items—including slow roasted entrees, wings, the signature Pizookie® dessert—and proprietary craft beers developed at four in-house brewing facilities supplemented by independent brewers [S1][S21]. BJ’s emphasizes an upscale yet approachable dining atmosphere characterized by high ceilings, large televisions viewable from any seat, distinctive glassware tailored to beverage styles, linen napkins, and a signature bar statement that fosters social engagement [S17].
Historical Performance
BJ's experienced a challenging period from fiscal years 2020 through 2022 marked by losses amid pandemic disruption and inflationary pressures. However, fiscal year 2025 saw a material turnaround driven by revenue recovery and disciplined cost control:
Historical performance (annual)
| FY | Net ($mm) | CFO ($mm) | OpInc ($mm) | Capex ($mm) | Net YoY |
|---|---|---|---|---|---|
| 2023 | 49 | 111 | 46 | 70 | +1097.4% |
| 2022 | 4 | 51 | -5 | 79 | +213.0% |
| 2021 | -4 | 64 | -17 | 42 | +80.1% |
| 2020 | -18 | 41 | -20 | 43 |
Source: SEC companyfacts cache [F1].
Capital returns and efficiency (annual)
| FY | Buybacks ($mm) | FCF ($mm) | ROE% |
|---|---|---|---|
| 2023 | 68 | 41 | 13.3 |
| 2022 | 2 | -27 | 1.2 |
| 2021 | 15 | 22 | -1.1 |
| 2020 | 15 | -3 |
Source: SEC companyfacts cache [F1].
The jump in operating income from negative $5.48 million in FY2024 to positive $46.3 million in FY2025 represents a near tenfold increase, while net income surged over ten times to $48.8 million [F1]. Operating cash flow more than doubled year-over-year reflecting improved core cash generation [F1]. Capital expenditures declined modestly but remain significant due to ongoing restaurant investments [F1]. Share repurchases increased markedly during FY2025 returning nearly $68 million to shareholders compared to just over $2 million prior [F1].
Growth Strategy and Future Prospects
BJ's primary strategy focuses on growing market share within the highly fragmented full-service restaurant sector—estimated at over $100 billion annually—by delivering its "Gold Standard of Operational Excellence," which emphasizes flawless service execution alongside an energized dining environment [S17][S18]. Restaurant expansion continues selectively via new openings concentrated in mature trade areas where clustering allows operational efficiencies including reduced supply chain costs and enhanced marketing leverage [S9][S18].
The company is developing a new restaurant prototype designed to maintain similar seating capacity (~250 guests), improve bar presentation, enhance hospitality speed and efficiency, optimize labor needs, reduce overall expenses, all at a lower capital outlay relative to prior builds [S20][S22]. Mature restaurants typically achieve annual sales above $6.5 million with expected four-wall operating margins between 15%–20%, but maturation can take two to five years post-opening [S20][S22]. Preopening expenses remain meaningful given complex operational needs including recruiting and training up to eight managers plus approximately 150 hourly staff per location.
Operational enhancements rely heavily on technology including handheld ordering tablets used by servers plus mobile app capabilities that integrate online ordering for dine-in, takeout, delivery, and loyalty program management [S1]. Off-premise sales form an increasingly important complement to build customer convenience though third-party delivery partnerships add commission costs impacting margins [S25].
Marketing efforts sustain momentum by combining traditional linear TV with digital video platforms including connected TV plus social media influencer collaborations centered around popular items like Pizookie®, hedging operational marketing with grassroots community engagement at local restaurant levels [S21].
Risks and Challenges
The company faces several risks typical of full-service restaurant operators intensified by BJ's geographic concentration notably across California, Texas, Florida where regulatory landscapes differ materially [S27][S29]. Rising labor costs from mandated wage hikes as well as the need for competitive labor market recruitment challenge margin stability [S23][S26]. Supply chain volatility presents risks particularly for brewing commodities such as malt and hops sourced primarily under one-year purchase commitments; crop failures or adverse weather could materially raise input costs [S23]. Regulatory risks include compliance with complex liquor licensing requirements that vary state-by-state affecting beer production distribution licensing or retail license availability which impacts expansion timing [S13][S15][S29]. Costs related to data privacy laws like CPRA present rising expenditure liabilities.
Additionally, BJ's maintains various insurance policies but retains significant self-insured retentions exposing it to litigation risk related to employment practices or dram-shop statutes linked to alcohol service liability claims [S14][S24]. Cybersecurity vulnerabilities tied to heavy reliance on electronic information systems pose potential operational disruptions if breached despite ongoing investments in technology safeguards [S27]. Competition arises not only from full-service chains but increasingly from grocery deli expansions offering convenience meal solutions lending upward pressure on consumer discretionary spending habits that may compress visit frequencies or check averages over time [S26].
Capital Allocation and Financial Health
BJ’s balance sheet reflects total equity of approximately $366 million against net current liabilities exceeding current assets (current ratio ~0.4), indicating potential short-term liquidity constraints despite overall profitability [F1]. Strong operating cash flow generation ($110 million) supports free cash flow near $41 million after capex spending allowing organic reinvestment combined with executed share repurchases totaling nearly $68 million in FY2025—a notable acceleration versus prior years suggesting elevated confidence from management towards shareholder returns and capital structure optimization [F1]. Dividend policy details were not disclosed.
Returns on equity approximate 13%, marking meaningful improvement post-pandemic era losses yet still leaving room for margin expansion amid controlling cost pressures strategically.
Conclusion: What to Watch Next
BJ's demonstrated strong operational recovery culminating in substantial profitability growth during fiscal year 2025 backed by strategic expansion plans using an optimized prototype design targeting sustainable unit economics leveraging proprietary craft beer differentiation within an upbeat dining experience. Challenges persist surrounding wage inflation trajectories, commodity supply reliability especially malt/hops pricing shifts affecting beer costs, and tighter local government regulations governing alcohol sales licensing. Monitoring quarterly traffic trends amid off-premise channel growth will signal resilience against evolving consumer preferences influenced by macroeconomic conditions. Capital deployment balance between growth-related capex versus shareholder returns remains key. Technological enhancements facilitating order accuracy plus service velocity are value drivers sustaining guest satisfaction metrics essential to message repetition cycles fueling brand loyalty. Risks remain non-negligible given industry fragmentation combined with competition from diverse food-delivery alternatives causing pressure on both traffic volumes as well as average checks. Overall financial discipline coupled with successful execution of expansion initiatives will dictate whether BJ’s continues consolidating its full-service segment presence effectively.
This analysis provides comprehensive insights into BJ's Restaurants Inc.'s business fundamentals based on publicly available data as of March 2nd, 2026.
Disclaimer: This is research-only, informational analysis and not investment advice. It may include AI-generated interpretation and general industry context. Always verify important details using primary sources.
Comments