
BOK Financial Corp's Earnings Momentum Underpinned by Capital and Income Strategy
Examining how BOK Financial leverages its regulatory capital, liquidity, and core income streams to sustain robust earnings growth.
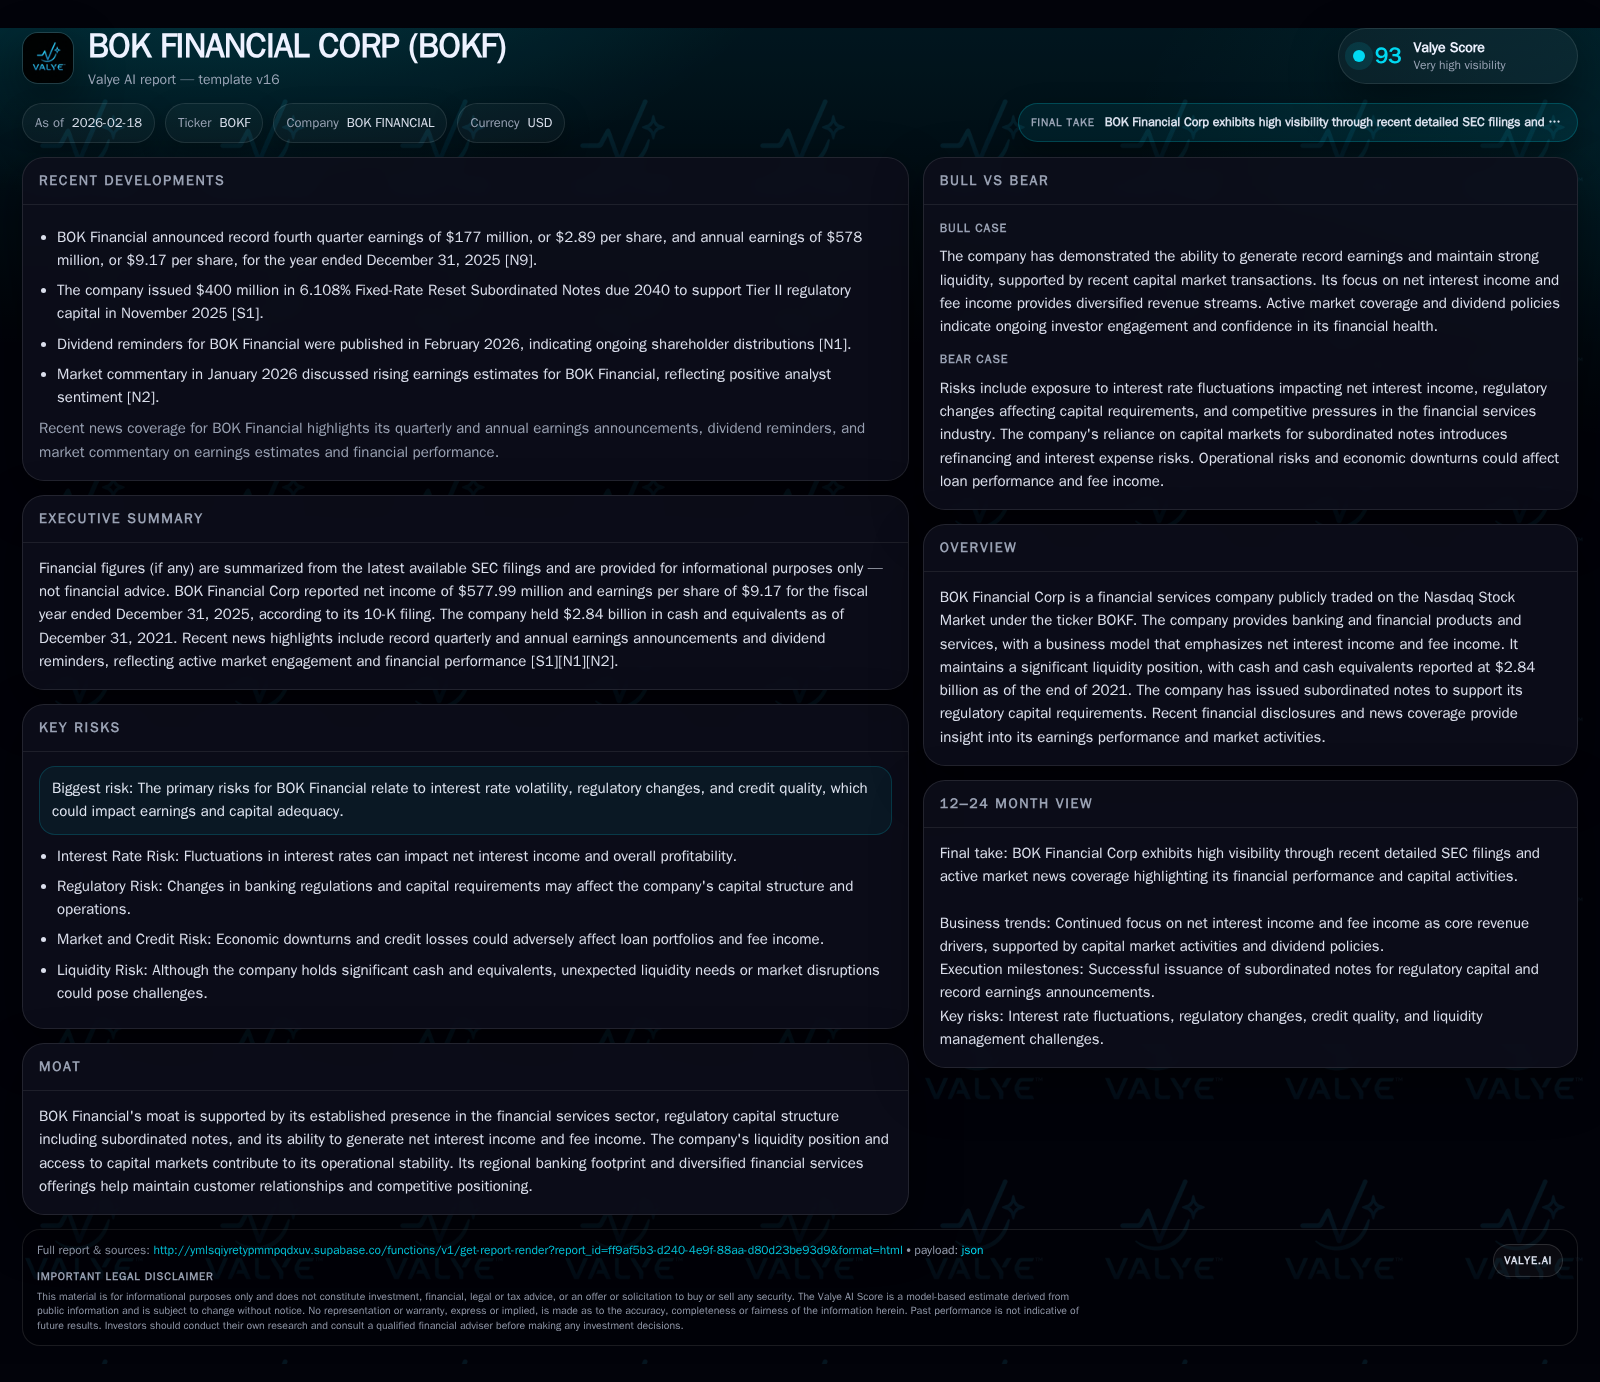
BOK Financial Corp demonstrated strong net income growth in 2025, driven by rising net interest and fee incomes supported by a sound capital base including subordinated notes. Despite a notable decline in operating cash flow year-over-year, the company’s liquidity and Tier II regulatory capital position bolster operational stability. Future growth hinges on managing risks from interest rate volatility and credit quality within a regional banking footprint, while capital allocation remains balanced through dividends and expanded share repurchases.
Historical Growth Drivers: Net Interest Income and Fee Income Performance
BOK Financial Corp’s 2025 financial results underscore a business model that prioritizes net interest income (NII) complemented by fee income streams. In the fourth quarter of 2025, the company reported record quarterly earnings of $177 million, driven largely by higher NII alongside robust fee revenues [N12]. This performance aligns with BOK Financial’s established focus on optimizing net interest margin (NIM), a key sector-native metric reflecting the spread between loan yields and funding costs.
Increasing NIM benefits all banking operations sensitive to interest rate resets and lending mix changes. Fee income, derived from areas such as wealth management, transaction services, and loan-related fees, has provided a stable revenue base contributing diversification beyond pure lending spread income. Quarterly earnings beats over the past year signal sustained core earnings resilience amid moderate economic headwinds [N1][N12].
Shifts in Year-Over-Year Financial Metrics and Operating Cash Flow Trends
While BOKF’s net income expanded by approximately 10.4% to $578 million in FY2025 compared to $523 million in FY2024 [F1], the company experienced a sharp decline in operating cash flow (CFO), which dropped roughly 48.3% from $1.43 billion to $740 million over the same period [F1]. Capital expenditures (capex) contracted modestly by about 4.2%, indicating stable but slightly reduced investment in productive assets.
This divergence between growing accrual earnings and declining CFO suggests influences outside of core profitability—potentially working capital timing differences or changes in loan sales/repayments. The scale of fluctuations also points to possible shifts in non-cash items or changes in deposit inflows used to fund assets. However, the sizable positive CFO figure confirms ongoing cash-generative capability even amidst these fluctuations.
The Role of Regulatory Capital: Subordinated Notes and Liquidity Management
BOK Financial strategically enhanced its Tier II regulatory capital base through issuance of $400 million fixed-rate reset subordinated notes due 2040 at a coupon of 6.108% in November 2025 [S9][S15]. These notes are structured solely as obligations of the Bank subsidiary (BOKF NA) without guarantees from the parent entity.
The treatment of these subordinated notes as Tier II capital bolsters BOKF’s total risk-based capital ratios under Basel III frameworks. This regulatory capital buffer supports continued lending capacity while providing protection against adverse losses.
Liquidity remains a cornerstone of BOK Financial's operational blueprint. The company reported $2.84 billion in cash and cash equivalents as of December 31, 2021—a substantial buffer ensuring funding flexibility amidst market volatility . Maintaining ample liquidity aids both regulatory compliance and strategic investment agility.
Evaluating Risk Factors: Interest Rates, Credit Quality, and Regulatory Environment
Disclosed risk factors highlight exposure to fluctuations in interest rates which can compress NIM through re-pricing mismatches on loans and deposits [S4][S6][S8]. Given the current macroeconomic backdrop with uncertain Fed policy trajectories, this remains an ongoing earnings sensitivity.
Credit risk is another salient consideration; regional economic shifts may stress borrower repayment capacity impacting loan loss provisions and asset quality metrics. The firm’s historical credit management approach strives to mitigate these risks but evolving economic cycles pose inherent uncertainties.
Regulatory landscape changes add additional complexity with potential modifications to capital requirements or compliance burdens influencing cost structures [S4][S6]. These risk dimensions require continuous monitoring given their direct effect on profitability and capital adequacy.
Future Growth Prospects Within BOK Financial’s Regional Banking Footprint
BOK Financial derives much of its strength from a focused regional banking strategy facilitating deep local customer relationships and deposit stability [S3]. Investor presentations emphasize expanding market penetration within core states leveraging tailored commercial lending, consumer banking products, and wealth management services.
Recent analyst commentary praises the company's ability to capitalize on regional economic growth trends yet notes competitive pressures from larger national banks as well as fintech entrants could temper upside potential [N2]. Regulatory tightening scenarios could also curtail more aggressive loan growth strategies.
Overall, BOKF’s foothold in key urban markets coupled with diversified financial offerings positions it well for measured growth while maintaining prudent risk discipline.
Capital Allocation Strategies: Dividends, Share Repurchases, and ROE Analysis
Despite expanding equity base—rising from approximately $5.55 billion in FY2024 to $5.92 billion in FY2025—BOK Financial sustained disciplined returns through consistent dividend payments totaling around $147 million annually [F1][S21]. Concurrently, share repurchases accelerated markedly with buybacks surging from about $90 million to over $413 million year-over-year [F1], reflecting management's intent to enhance per-share value amid favorable market conditions.
These capital return policies support an implied return on equity (ROE) near 9.8%, balancing shareholder distributions with reinvestment needs [F1]. The significant increase in buybacks signals confidence in valuation accretion opportunities yet sustainability hinges on continued capital adequacy compliance given regulatory minima.
What to Watch: Earnings Estimates, Market Reactions, and Upcoming Milestones
Investor focus should remain on upcoming quarterly earnings releases following strong recent beat reports which combined rising NII with fee income gains underpinning positive analyst revisions [N1][N2]. Market reactions have been mixed given deal activities contributing some volatility.
Further scrutiny is warranted on updates regarding regulatory capital measures or liquidity positions disclosed during investor calls or future filings [S3]. Monitoring shifts in credit metrics such as non-performing assets or provision expenses will also provide early indications on emerging credit trends.
Key milestones include scheduled dividend payments announced for March 2026 [S21] which maintain continuity amid ongoing capital deployment programs.
Historical performance (annual)
| FY | Net ($mm) | CFO ($bn) | Capex ($mm) | Net YoY |
|---|---|---|---|---|
| 2025 | 578 | 0.7 | 164 | +10.4% |
| 2024 | 524 | 1.4 | 172 | -1.4% |
| 2023 | 531 | 0.1 | 166 | +2.0% |
| 2022 | 520 | 5.1 | 215 |
Note: Omitted columns lack sufficient annual XBRL coverage in the provided tags (need ≥2 annual points): Rev, OpInc. Source: SEC companyfacts cache [F1].
Capital returns and efficiency (annual)
| FY | Div ($mm) | Buybacks ($mm) | FCF ($bn) |
|---|---|---|---|
| 2025 | 148 | 413 | 0.6 |
| 2024 | 143 | 90 | 1.3 |
| 2023 | 143 | 177 | -0.1 |
| 2022 | 144 | 155 | 4.9 |
Source: SEC companyfacts cache [F1].
Notes: Revenue and operating income data not available from provided tags.
Disclaimer
This analysis is for informational purposes only based on publicly available data as of February 18, 2026; it does not constitute investment advice or recommendations.
Disclaimer: This is research-only, informational analysis and not investment advice. It may include AI-generated interpretation and general industry context. Always verify important details using primary sources.
Comments