
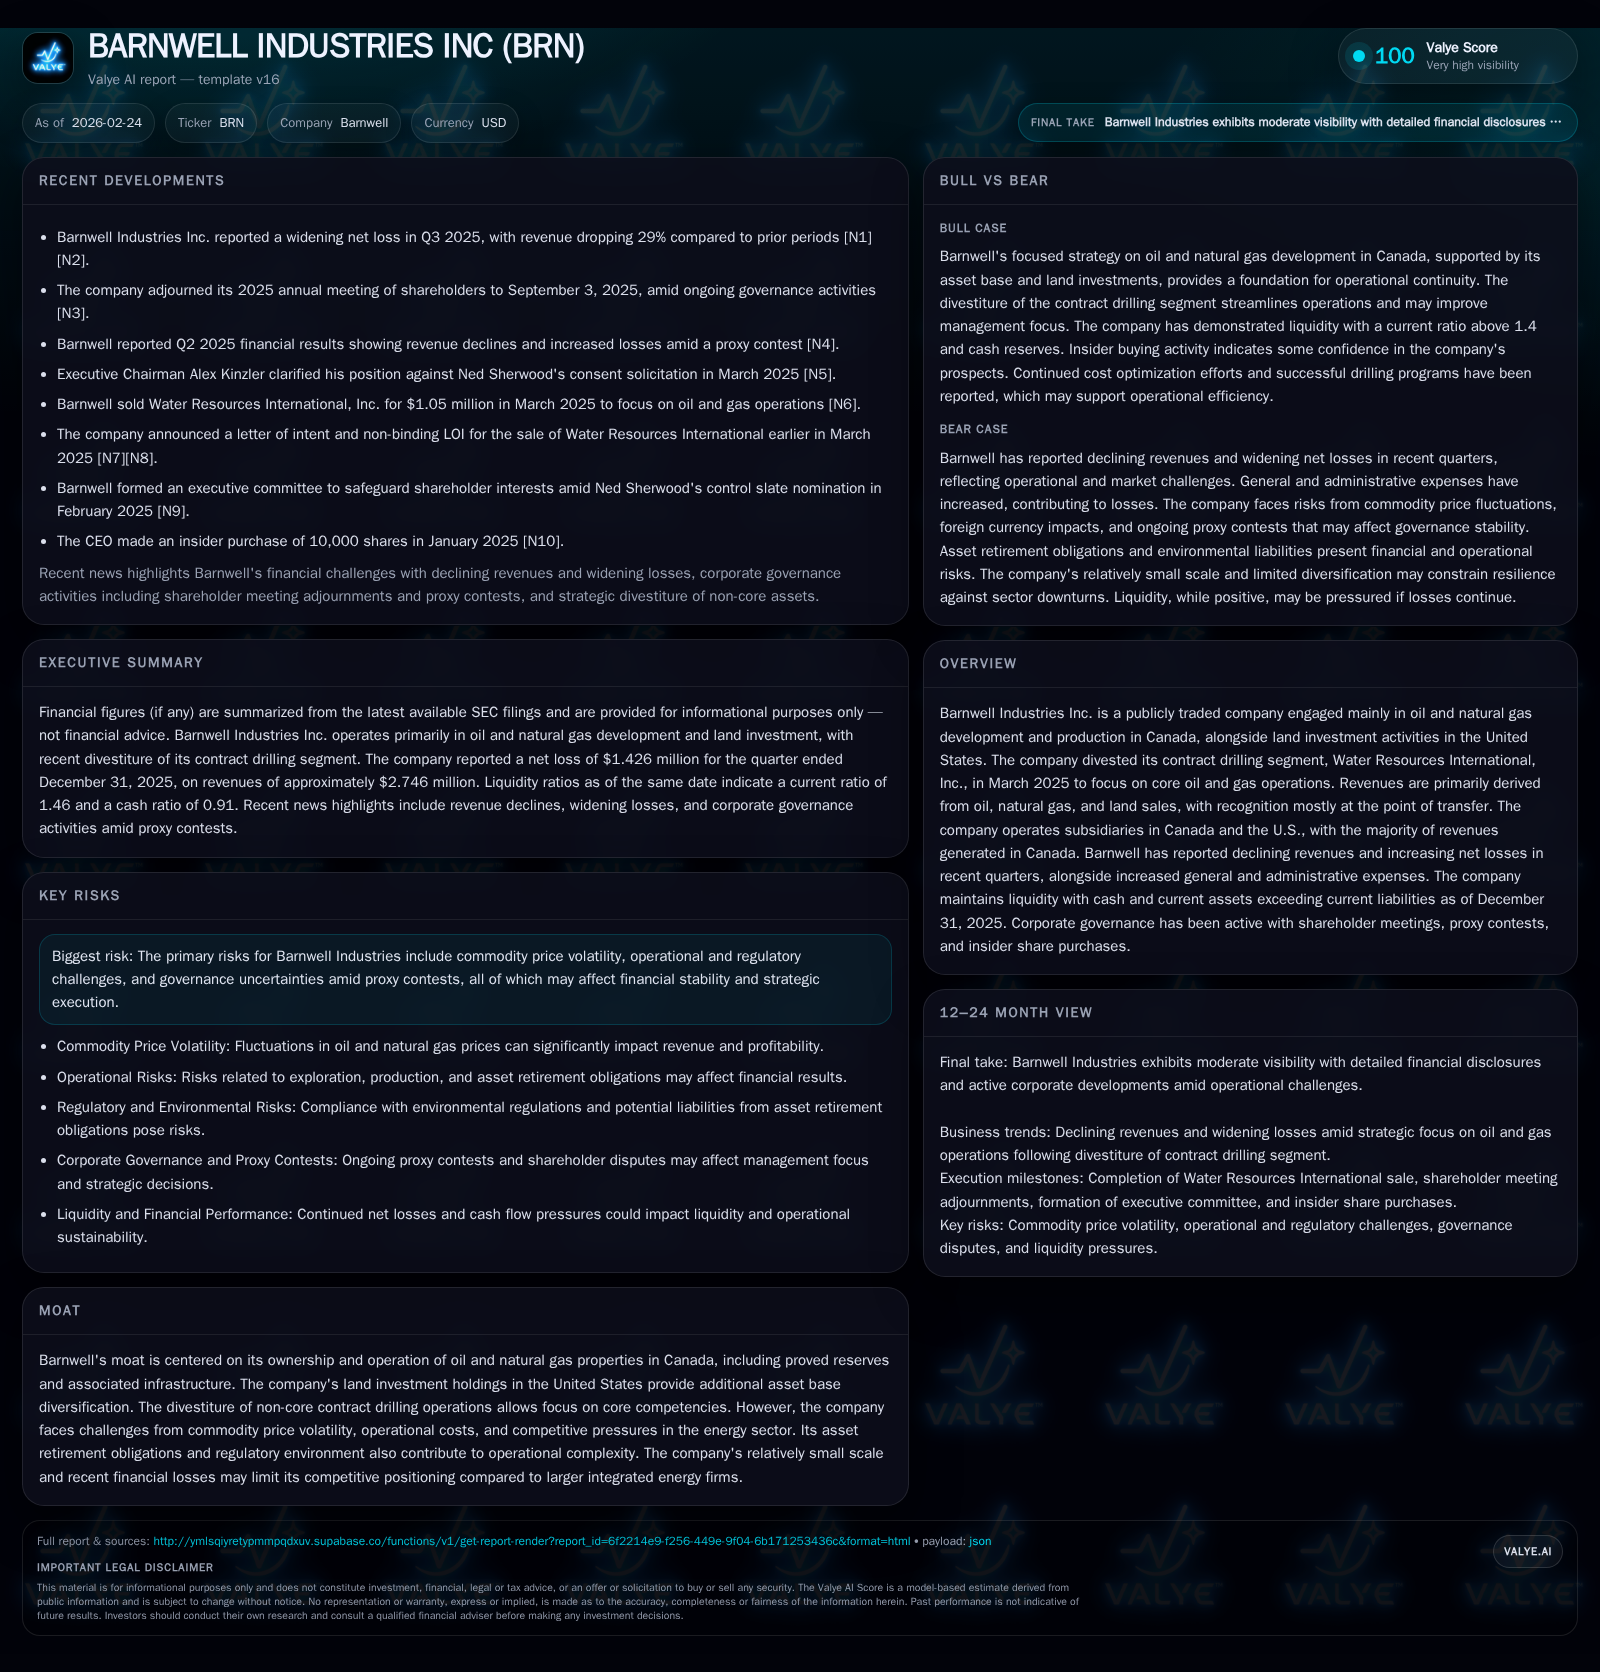
Barnwell Industries' Revenue Collapse Sparks New Strategic Focus
Analyzing Barnwell Industries’ marked revenue declines and strategic divestiture to understand its renewed focus on core oil and gas assets.
Barnwell Industries has experienced a severe contraction in revenues and widening net losses over recent fiscal years due to pressures in its oil, natural gas, and land investment operations. The strategic divestiture of its contract drilling segment in early 2025 serves as a pivot to sharpen operational focus on Canadian oil and gas development while maintaining modest U.S. land holdings. Despite liquidity cushions supported by cash exceeding current liabilities, the company faces capital allocation challenges amid weak returns on equity and volatile commodity prices. Moving forward, investors should monitor the impact of Barnwell’s streamlined asset base, cost control efforts post-divestiture, and governance developments that could shape execution risk.
Historical Earnings and Revenue Trends: The Declining Curve
Barnwell Industries has endured a significant decline in financial performance over the past several years. Its revenues have fallen precipitously from $28.5 million in FY2022 down to $13.7 million in FY2025 (FY ending September) representing a nearly 52% reduction over three years, with the latest fiscal year alone recording a drop of -36.9% [F1]. Operating income similarly contracted sharply from $11.6 million in FY2022 to just $30 thousand in FY2025 — a dramatic erosion signaling compression in operating margins amid challenging market conditions.
Despite some stabilization in operating income compared to FY2024’s negative figure (-$0.7 million), net income losses expanded persistently reaching -$7.1 million in FY2025 [F1]. This dislocation between operating profitability and bottom-line results reflects higher non-operational expenses including elevated general & administrative costs.
Historical performance (annual)
| FY | Rev ($mm) | Net ($mm) | CFO ($mm) | OpInc ($mm) | Rev YoY | Net YoY |
|---|---|---|---|---|---|---|
| 2025 | 14 | -7 | 0 | -36.9% | -27.6% | |
| 2024 | 22 | -6 | 5 | -1 | -14.0% | -479.1% |
| 2023 | 25 | -1 | 2 | 5 | -11.5% | -117.4% |
| 2022 | 29 | 6 | 7 | 12 |
Note: Omitted columns lack sufficient annual XBRL coverage in the provided tags (need ≥2 annual points): Capex, Buybacks, FCF. Source: SEC companyfacts cache [F1].
Capital returns and efficiency (annual)
| FY | Div ($) | ROE% |
|---|---|---|
| 2025 | -101.4 | |
| 2024 | 0 | -42.7 |
| 2023 | 599000 | -5.1 |
| 2022 | 149000 | 28.8 |
Source: SEC companyfacts cache [F1].
Note: Capital expenditures data for recent years is not available from provided tags; ROE calculated as net income divided by shareholder equity for latest year [F1].
The precipitous revenue compression—driven primarily by depressed sales volumes/prices across oil and natural gas segments paired with lower land investment sales—has strained margins despite small operational gains [F1]. The company's modest rebound in positive operating income for FY2025 is overshadowed heavily by net losses exacerbated by overhead and other indirect expenses.
Divestiture of Non-Core Operations: Refocusing on Oil & Natural Gas
In March 2025, Barnwell completed the divestiture of its contract drilling subsidiary Water Resources International, Inc., effectively exiting the drilling services sector [S1][S2]. This marked an intentional strategic pivot designed to refocus resources exclusively on core upstream activities—namely Canadian oil and natural gas development—and the company’s U.S.-based land investments.
This move was intended to streamline Barnwell’s operational footprint by shedding businesses peripheral to its primary value drivers while allowing management attention to concentrate on exploiting proved reserves in Alberta where it owns mid-sized producing properties supported by related infrastructure [S15][S18].
The sale removed volatility associated with fluctuating demand for drilling services and related regulatory complexity inherent in contract drilling operations [S1], while simultaneously reducing capital outlays required to maintain non-core assets.
Geographic Revenue and Asset Composition Overview
Barnwell generates the lion’s share of its revenues from upstream hydrocarbon production activities located predominantly in Alberta, Canada [S9][S15]. Its Canadian properties encompass proved reserves managed under full cost accounting giving transparency over depletion schedules and impairment monitoring.
Revenues from oil constitute the largest component at approximately $1.9 million for Q4 2025 alone versus roughly $471 thousand from natural gas and smaller contributions from natural gas liquids [S18]. The company recognizes revenues mostly at point-of-transfer reflective of typical upstream industry practice where title passes upon sale.
In addition to Canadian upstream assets, Barnwell maintains land investments rights linked to residential lot developments in Hawaii via partnerships such as Kaupulehu Developments [S25]. These holdings provide revenue diversification albeit relatively minor compared with core hydrocarbons segment.
Total long-lived assets comprise around $15.6 million split roughly $9.6 million in Canadian oil/gas properties and $6 million associated with land interests alongside retirement benefits assets demonstrating multi-geographic exposure albeit weighted heavily towards Canadian energy [S11][S9].
Current Fiscal Health: Liquidity and Debt Profile
As of December 31, 2025, Barnwell reported current assets totaling approximately $5.8 million against current liabilities of about $4 million yielding a current ratio of roughly 1.46—a reasonable short-term liquidity cushion consistent with operational needs [F1][S7].
Cash and cash equivalents stand at $3.62 million supporting working capital adequacy while accounts receivables hold steady near $1.4 million net of credit loss provisions signaling manageable collections risk [F1][S10].
Debt burdens appear limited; importantly, insurance premium financing arranged for directors’ liability insurance totaling approximately $183 thousand with a high interest rate was fully repaid ahead of schedule by September 2025 alleviating short-term leverage concerns [S7].
Asset retirement obligations—a significant liability type common among upstream operators reflecting future well site restoration costs—are measured at fair value on Level 3 basis incorporating discounted cash flows under management assumptions for timing, inflation, legal requirements, etc., summing near $7.4 million [S7][S17]. This sizable obligation underscores inherent regulatory compliance cost risk embedded within Barnwell’s operational model.
Capital Allocation Decisions: Equity Raise and Shareholder Rights Plan
In November 2025, Barnwell executed a private placement raising gross proceeds near $2.4 million involving key shareholders including directors who participated directly thereby reinforcing internal confidence amidst turbulent markets [S16]. Net proceeds after issuance costs were close to $2.41 million enhancing the balance sheet liquidity profile.
Shortly thereafter, the company instituted a new shareholder rights plan effective January 30, 2026 designed as an anti-takeover defense mechanism granting existing shareholders rights exercisable under defined triggering events such as acquisition attempts exceeding specified ownership thresholds [S4][S8]. The plan enables issuance of common shares exercisable at discounted purchase price thereby diluting hostile bidders if necessary.
Such governance moves underscore management's intent to retain control during periods of operational stress but also introduce considerations around investor relations particularly given recent proxy contest activities reported previously (not available in provided citations).
Restricted stock units (RSUs) compensation expense has been notable with grants during late 2025 increasing outstanding units considerably contributing approximately $79 thousand expense recognized during Q4 alone reflecting incentivization efforts amidst financial pressures [S20][S23].
Financial Performance Drivers and Headwinds
Commodity price volatility remains the most significant driver impacting Barnwell’s revenue streams exposing it acutely to global oil/gas pricing cyclicality which constrains top-line predictability [S1][S5]. Operational scale inefficiencies derive partly from Barnwell's smaller footprint relative to larger integrated peers limiting bargaining power for service contracts or economies of scale.
Regulatory requirements around environmental compliance including asset retirement obligations further increase operating complexity adding significant long-term provisions impacting cash flow forecasts negatively if not managed prudently [S7][S13].
General and administrative expenses have increased notably resulting in wider losses despite marginal operating profitability improvements indicating ongoing overhead pressure potentially linked to corporate governance actions such as proxy contests creating distractions or inefficiencies on executive resource allocation [F1][S18].
Analyst Indicators: Operating Cash Flows vs Capex and ROE Analysis
Though net losses persistently weigh on earnings capacity, Barnwell exhibits improving free cash flow dynamics partially supported by disciplined low capital expenditure levels recently reported near just $28 thousand for Q4 versus much heavier prior year spendings indicating stringent capex controls post-divestiture [F1][S18].
Operating cash flows plummeted after robust $7+ million levels seen earlier but remain materially positive relative to net income losses suggesting non-cash charges dominate accounting losses signaling some liquidity resilience [F1].
Return on equity approximates minus one hundred one percent (-101%) reflecting chronic shareholder value erosion amid accumulated deficits dwarfing equity base highlighting urgent need for improved capital efficiency or transformational turnarounds if sustainable profitability is targeted [F1].
Free cash flow for latest available annual period approximates $3.96 million (operating cash flow minus capex), indicating positive cash generation despite accounting losses [F1].
Risks Embedded in Commodity Price Volatility and Regulatory Environment
Key risks revolve around commodity price swings disrupting revenue visibility coupled with regulatory constraints compelling resource-intensive compliance actions affecting profitability projections including strict environmental standards governing site restoration timelines commonly referenced as asset retirement obligations fair value measurement challenges requiring continuous management judgment [S5][N/A].
Further governance uncertainties arise due to active proxy contests introducing strategic execution risk potentially impeding decisive capital allocation or operational restructuring efforts essential under current market stressors (not detailed in provided tags).
Legal proceedings remain disclosed but do not appear material presently; however latent litigation risks cannot be ignored particularly tied with regulatory shifts or environmental litigation increasingly present across the energy sector broadly affecting operators similar to Barnwell.
Outlook: What Investors Should Monitor Next
With no explicit forward guidance available publicly from provided sources, investors should focus closely on:
- Commodity price trajectories influenced by geopolitical developments impacting Canadian oil/natural gas demand-supply fundamentals.
- Management updates regarding cost control initiatives especially realized efficiencies following contract drilling divestiture.
- Any structural changes announced around capital allocation plans including potential further equity raises or debt refinancing tied with liquidity preservation strategy.
- Progress or resolution surrounding proxy contests offering clarity on potential shifts in board composition affecting strategic priorities.
- Operational metrics such as production volumes, depletion rates, reserve replacement ratios critical for confirming sustainability of core asset cash flows.
- Monitoring developments linked with asset retirement obligation estimates which could materially impact future financial statements given sensitivity to regulatory or environmental standards evolution.
Disclaimer: This analysis is based solely on publicly available information as cited without any personalized investment recommendations or endorsements regarding BARNWELL INDUSTRIES INC (BRN). All financial figures are drawn strictly from SEC filings as referenced through February 24, 2026.
Disclaimer: This is research-only, informational analysis and not investment advice. It may include AI-generated interpretation and general industry context. Always verify important details using primary sources.
Comments