
Southern First Bancshares Doubles Profits Backed by ClientFIRST Model
Southern First Bancshares’ distinctive relationship banking approach underpins a near doubling in profitability amid regional economic headwinds.
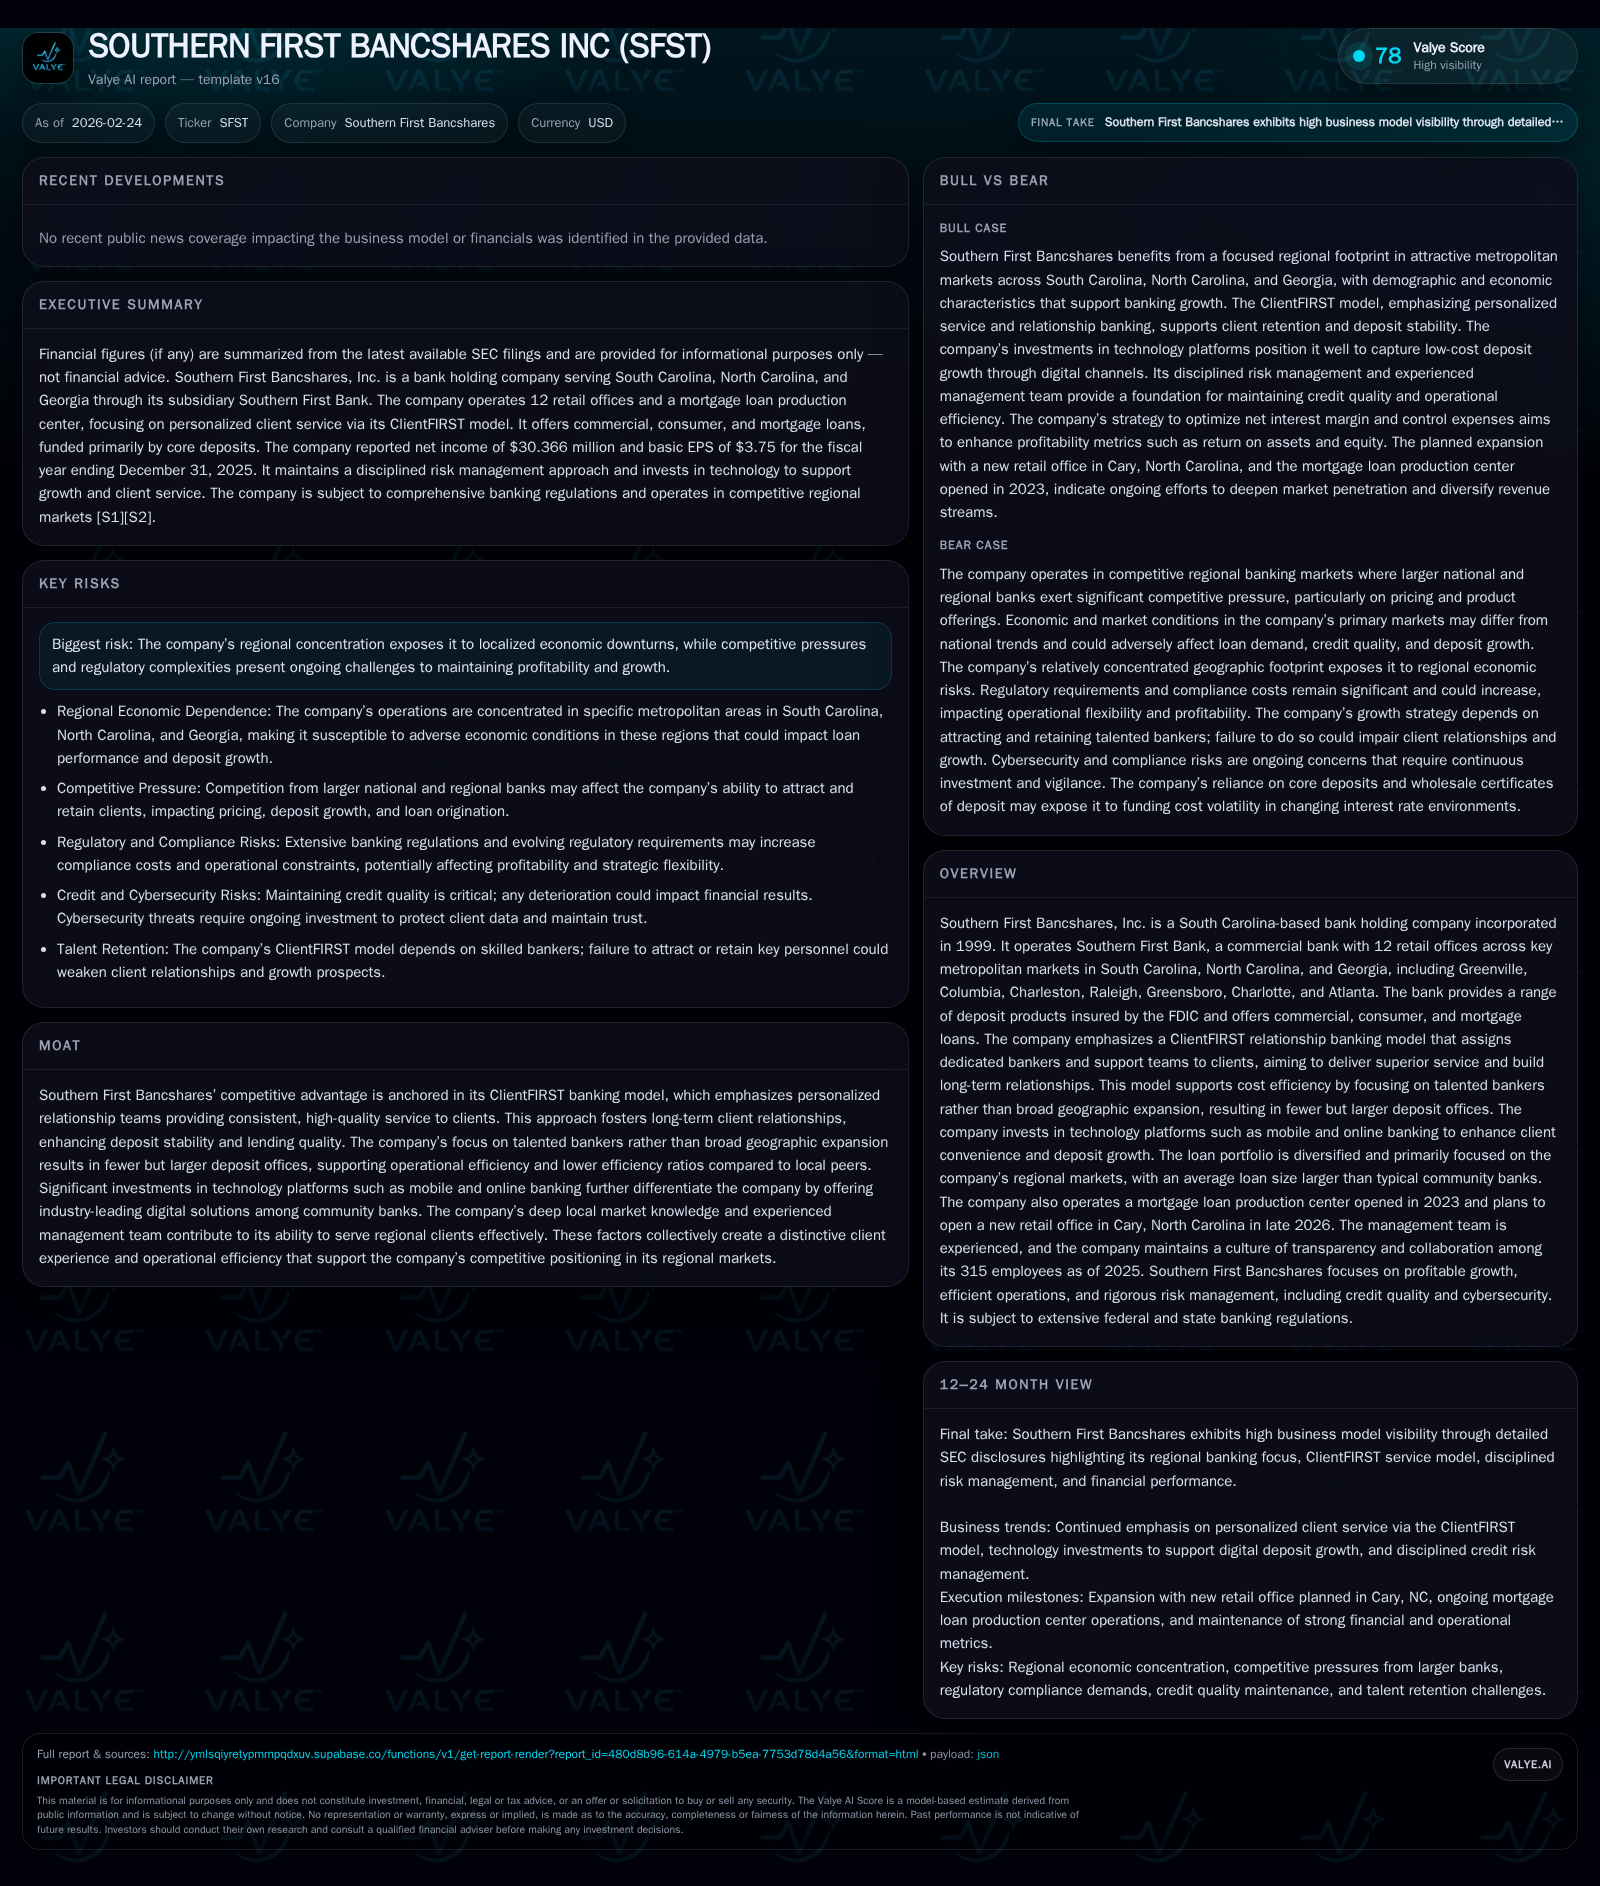
Southern First Bancshares, a South Carolina-based regional bank holding company, illustrated strong financial momentum in 2025 with net income rising nearly 96% year-over-year. This surge is supported by the company’s ClientFIRST relationship banking model, which fosters long-term client loyalty and operational efficiency through fewer but larger retail offices. The bank’s deposit stability and disciplined underwriting have maintained credit quality within its loan portfolio, heavily concentrated in real estate lending across key Southeastern metro markets. With well-capitalized levels and robust cash flow generation, Southern First balances cautious expansion with significant technology investments. However, its geographic concentration and evolving regulatory environment pose ongoing risks to watch.
Historical Profit Leap: Net Income Nearly Doubles in 2025
Southern First Bancshares posted a remarkable acceleration in profitability in fiscal year 2025 with net income reaching $30.4 million — an increase of 95.5% versus $15.5 million recorded in 2024 [F1]. This dramatic improvement contrasts with relatively stable operating cash flow (CFO) trends that rose by 19.2% to $30.5 million and a notable reduction in capital expenditures which fell 26% to approximately $0.58 million [F1]. The sharp profit expansion despite modest capex cuts signals heightened operational leverage facilitated by the bank’s focused ClientFIRST model.
The firm’s stockholders’ equity grew moderately through this period from $330.4 million in 2024 to $368.7 million by end-2025 (+11.6%), supporting capital adequacy for continued loan growth and balance sheet strength [F1]. These figures highlight a transition period where latent efficiencies within the existing franchise have been unlocked without major incremental investment.
Historical performance (annual)
| FY | Net ($mm) | CFO ($mm) | Capex ($mm) | Net YoY |
|---|---|---|---|---|
| 2025 | 30 | 30 | 1 | +95.5% |
| 2024 | 16 | 26 | 1 | +15.7% |
| 2023 | 13 | 18 | 1 | -53.9% |
| 2022 | 29 | 50 | 14 |
Note: Omitted columns lack sufficient annual XBRL coverage in the provided tags (need ≥2 annual points): Rev, OpInc, Div, Buybacks. Source: SEC companyfacts cache [F1].
Capital returns and efficiency (annual)
| FY | FCF ($mm) | ROE% |
|---|---|---|
| 2025 | 30 | 8.2 |
| 2024 | 25 | 4.7 |
| 2023 | 16 | 4.3 |
| 2022 | 36 | 9.9 |
Source: SEC companyfacts cache [F1].
Note: Revenue and operating income data unavailable; capex shows sizeable variability due to discrete investments.
ClientFIRST Banking Model: The Competitive Advantage Behind Growth
Central to Southern First’s success is its ClientFIRST relationship banking model , [S1]. This approach eschews expansive branch proliferation in favor of cultivating deeply personalized client interactions through dedicated banker teams assigned to each customer segment.
Each client benefits from consistent contact points supported by specialized bankers and relationship managers who build trust over time, improving deposit stickiness and loan quality — critical factors mitigating credit risk particularly given the regional economic cycle sensitivity.
Operationally, this manifests as fewer but larger deposit offices; the twelve retail locations average roughly $263.7 million deposits per branch — considerably higher than typical peers — resulting in better cost efficiency ratios (64% efficiency ratio for FY2025) and strong scalability [S25]. The concentrated office strategy also reduces overhead expenses while maintaining superior customer service levels.
The bank complements these human relationships with industry-leading digital platforms for mobile and online banking—enabling remote deposit capture channels to contribute meaningfully (~58% of total deposits via remote/mobile means during FY2025) [S9]. These integrated technological investments fortify ClientFIRST’s competitive moat among community banks.
Geographic Focus and Market Dynamics Impacting Southern First
Southern First’s footprint centers on seven metropolitan markets spanning South Carolina, North Carolina, and Georgia: Greenville, Columbia, Charleston, Raleigh, Greensboro, Charlotte, and Atlanta , [S16]. This regional concentration provides both advantages—such as deep local market knowledge—and challenges arising from economic cyclicality localized to these areas.
These markets feature diverse economic drivers ranging from manufacturing clusters (Greensboro Triad region) to financial hubs (Charlotte) and major corporate headquarters (Atlanta). Despite their growth profiles, these areas have faced persistent inflationary pressures coupled with restrained consumer spending patterns throughout late-2024 into early-2025 [S1], potentially dampening loan demand or asset quality.
Southern First currently operates twelve retail branches supplemented by specialized centers like the Dream Mortgage Center opened in Columbia during late-2023 aimed at strengthening mortgage origination efforts [S4]. A new retail office planned for Cary, NC, aims at controlled expansion slated for late-2026 reflecting cautious but targeted growth ambitions anchored cautiously within nearby contiguous geographies [S1].
Loan Portfolio Profile: Size, Quality, and Underwriting Rigor
At December-end 2025, Southern First held net loans of approximately $3.80 billion representing about 86% of total assets—a substantial concentration reflecting conservative asset deployment priorities [S4]. Of note is the loan portfolio’s heavy underpinning by real estate collateral comprising approximately 83% of loans outstanding providing a secondary repayment source if needed [S1], [S16].
The bank’s average loan size stands around $382 thousand—larger than the typical community bank segmentation—emphasizing a focus on mid-sized business clients rather than retail borrowers [S4]. Consumer loans make up a small portion (~1%) of total loans with stringent underwriting based on borrower income analysis and collateral valuation mitigating unsecured exposures [S5].
Credit risk management is robust featuring layered approval hierarchies culminating at the Credit Approval Support Team (CAST)—comprising senior lenders and management—to ensure adherence to strict lending standards even on larger commitments exceeding internal thresholds ($45.9 million limit versus $65+ million regulatory cap as of FY2025) [S6], [S12].
This approach has maintained healthy portfolio performance metrics with minimal nonperforming assets reported despite macroeconomic uncertainty affecting sectors such as commercial construction loans which present inherent project completion risks managed via guarantees and loan-to-value caps set at or below 80% [S27].
Retail Deposits and Funding Strategy Bolstering Stability
The core funding source remains client retail deposits gathered primarily via its brick-and-mortar locations totaling twelve offices across its three-state footprint [S5]. These low-cost transaction accounts bolster margin resilience particularly during periods of rising interest rates since they tend to be less rate-sensitive than wholesale funding alternatives.
Wholesale certificates of deposit (CDs) aggregate approximately $552.9 million but are being strategically reduced relative to retail deposit growth initiatives enhancing overall funding cost structures [S5]. Deposit pricing remains competitive regionally while senior management monitors deposit rate levels closely balancing retention against margin compression risks.
Other fee-generating services such as internet banking fees, debit/credit card transactions fees, wire transfers and ATM usage produce modest noninterest income streams further diversifying revenue beyond net interest dynamics [S5]. This integrated depositor-centric approach aligns tightly with the ClientFIRST culture emphasizing service-driven client loyalty.
Capital Allocation Trends: ROE, Cash Flow Generation, and Expense Discipline
Southern First delivered a return on equity (ROE) estimated at approximately 8.2% for FY2025 derived from reported net income of $30.4 million against shareholders' equity of $368.7 million evidencing reasonable capital profitability for a mid-sized community bank amidst challenging macro headwinds [F1].
Robust free cash flow generation totaling near $29.9 million was realized based on high operating cash flows ($30.45 million) offset minimally by limited capital expenditures ($0.58 million)—the latter indicating restrained growth or maintenance investments securing existing infrastructure rather than expansive footprint increases [F1], [S10].
While explicit share repurchase volumes remain unavailable in filings as of early-2026, management authorized a minor buyback plan capped at $5 million suggesting cautious capital redeployment aligned with sustaining balance sheet strength rather than aggressive shareholder returns currently ([S10]). Dividend payout history is sparse but regular dividends have been issued historically indicating preference for stable distributions balanced against organic reinvestment needs.
Future Growth Drivers and Emerging Challenges
Momentum from recent positive earnings surprises for Q4/25 confirms ongoing operational strength allowing measured optimism regarding near-term growth potential ([N1], [N2]). The Dream Mortgage Center initiative underscores strategic diversification into mortgage lending while planned expansions like the Cary retail office support geographic adjacencies offering additional lending/deposit channels without excessive incremental cost burdens ([S1], [S19]).
Nonetheless, growth prospects face limitation stemming from concentrated regional exposure—which subjects credit profiles directly to localized economic volatility exacerbated by persistent inflationary risks—as well as intensifying competition from larger regional/national banks encroaching on mid-market clients ([S1], [S19]). Additionally regulatory complexities surrounding evolving capital rules including Basel III compliance adjustments necessitate vigilant capital planning to preempt constraints ([S14], [S19]).
What to Watch: Key Milestones and Risk Factors Ahead
Key upcoming milestones include successful opening and ramping up of the Cary office targeted for late-2026 along with continued deployment of digital channel enhancements supporting ClientFIRST delivery ([S1]). Monitoring loan portfolio shifts especially in commercial construction segments will be essential due to their elevated risk profiles related to project execution delays or real estate market corrections ([S27]).
Pricing competition may pressure deposit costs impacting net interest margins if not balanced carefully—a dynamic flagged as a potential risk factor impacting future profitability ([S19]). Regulatory developments including possible amendments or implementation delays related to capital adequacy frameworks should be observed closely as they could affect distribution capacity or organic capital accumulation strategies ([S14]). Maintaining discipline on credit standards while preserving superior client relationships will be paramount amid broader macroeconomic uncertainty.
Disclaimer: This analysis reflects information available through February 24, 2026 based on SEC filings and public disclosures without any speculative forecasts or investment recommendations.
Disclaimer: This is research-only, informational analysis and not investment advice. It may include AI-generated interpretation and general industry context. Always verify important details using primary sources.
Comments