
Brown & Brown Navigates Regulatory Costs and Acquisition Integration in Q2 2026
Q2 results highlight growth challenges from regulatory headwinds and integration expenses alongside steady commission-based revenue.
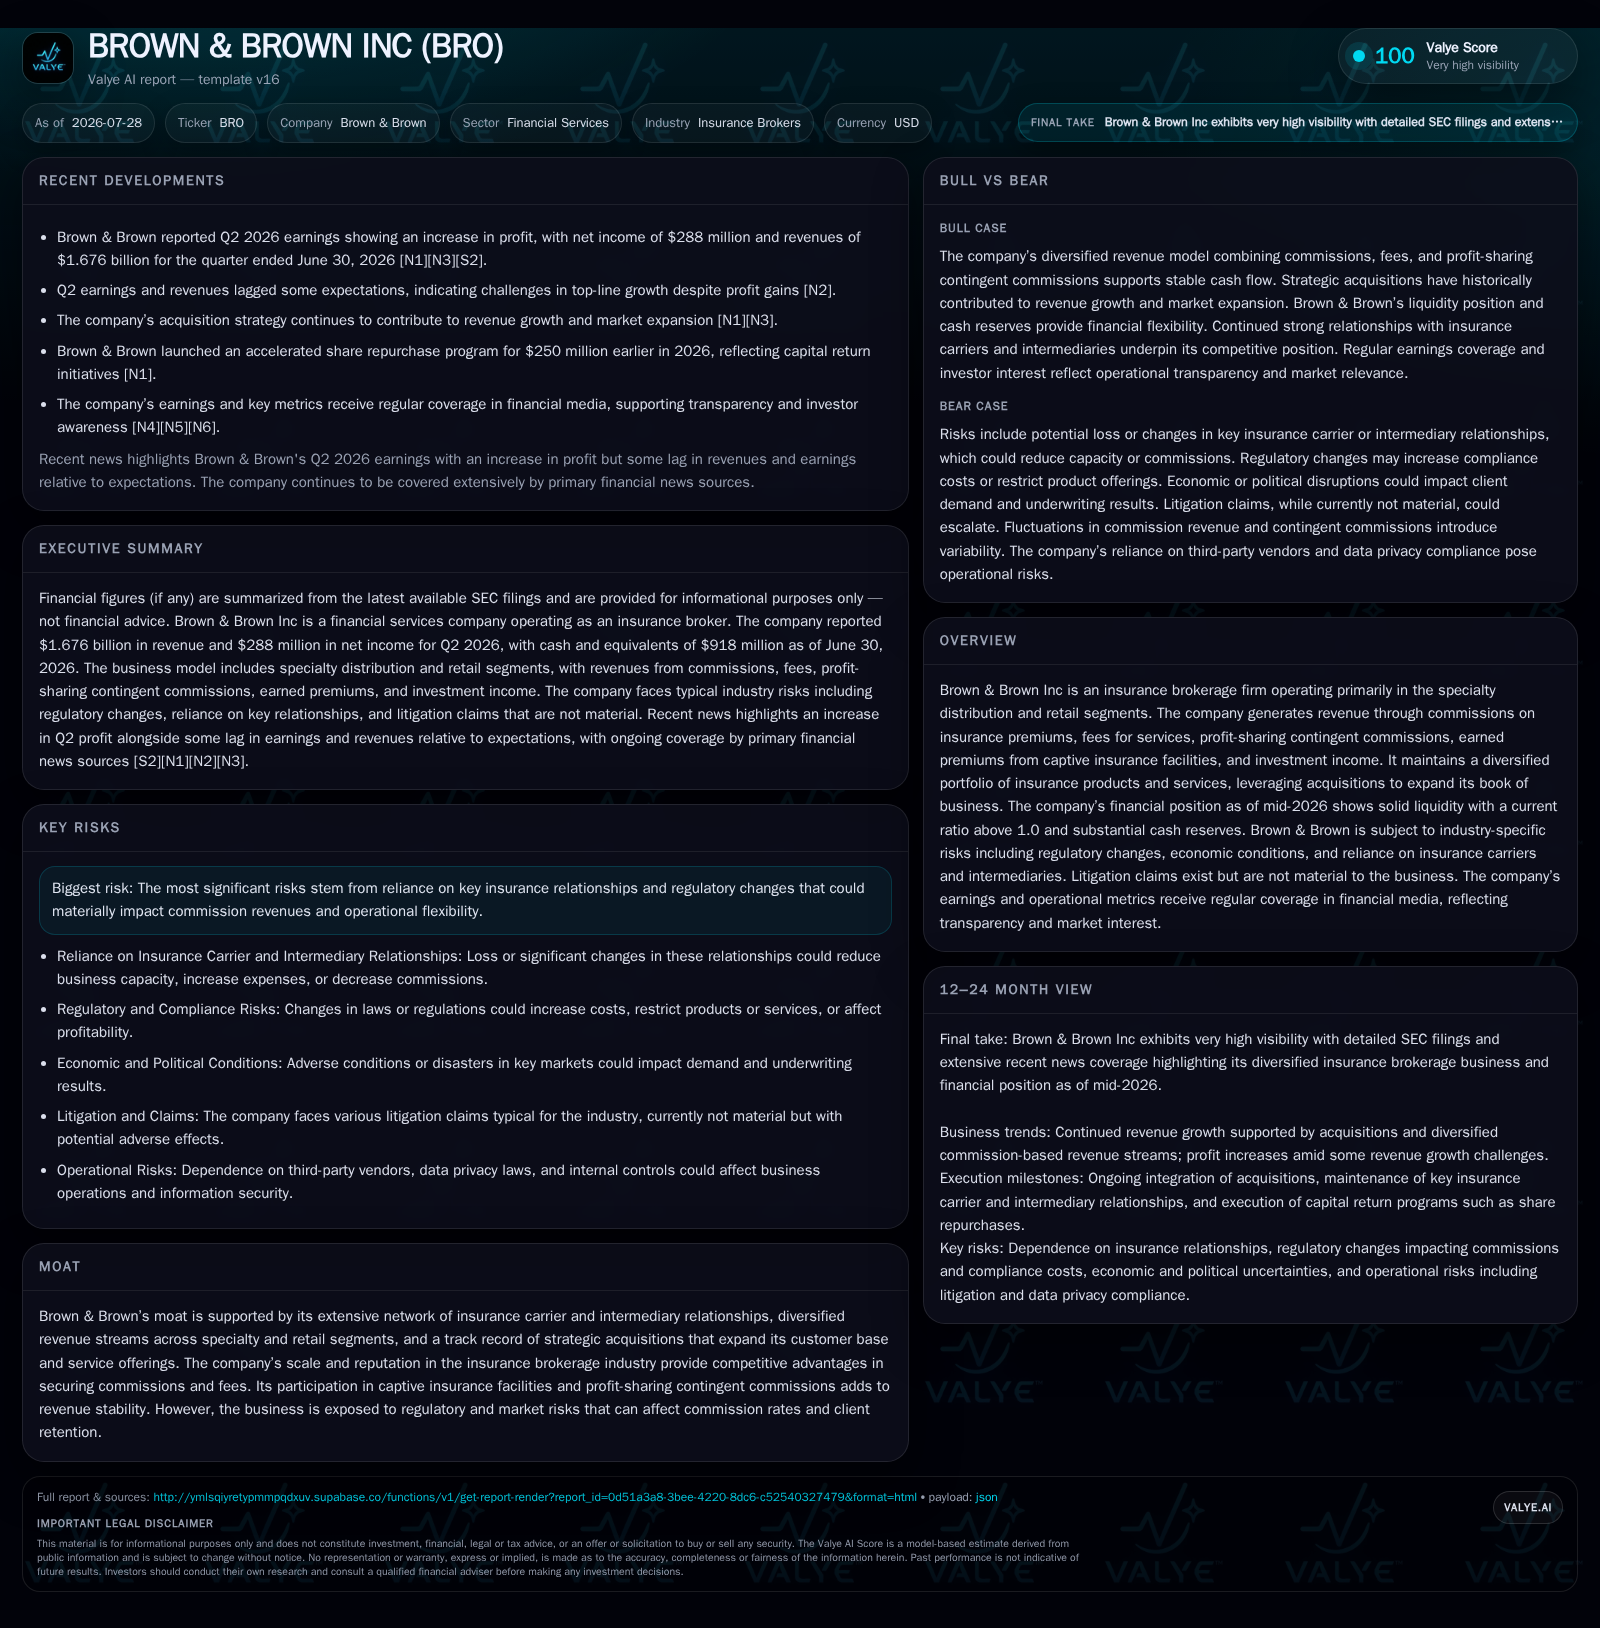
In its latest quarter, Brown & Brown Inc reported modest gains tempered by increased regulatory compliance costs and pressures on commission growth. The company’s robust acquisition pipeline continues to expand its specialty distribution and retail segments but integration expenses weigh on margins. Brown & Brown’s business remains anchored in diversified commission revenues from insurance carriers and stabilized by profit-sharing and investment income from captive insurance facilities. Key industry risks notably include evolving regulation and dependency on carrier relationships, while acquisition execution remains a critical growth lever to watch.
Recent Operating Update
Brown & Brown’s Q2 2026 operating results [S2], reported July 27, underline a business managing growth through increasingly complex regulatory demands alongside ongoing strategic acquisitions. Management flagged regulatory changes as a headwind that could reduce profitability by increasing compliance costs or restricting allowable products, markets, sales methods, pricing, or compensation forms from carriers or third parties—highlighting a sector-wide risk [S2]. Despite these challenges, the company’s dual-segment structure—Retail Brokerage and Specialty Distribution—continues generating consistent commission revenues derived primarily from property/casualty and employee benefits insurance lines.
The company’s Q2 filings also confirm ongoing acquisition investments that expand both its footprint and service capabilities. Recent integrations bring intangible assets with useful lives stretching up to 15 years, reflecting long-term strategic bets on customer account longevity [S7]. However, the associated integration expenses add operational complexity near term.
Industry news coverage [N1][N2][N12] confirms Brown & Brown’s Q2 earnings exceeded profit expectations modestly but revenues trailed estimates slightly amid these cost pressures.
Business Model Analysis
Brown & Brown operates as an intermediary between insurance carriers (underwriters) and clients (businesses and individuals), earning revenue largely through commissions based on premiums for property, casualty, employee benefits, and specialty insurance policies it brokers [S1]. It divides operations into two principal reportable segments: Retail Brokerage focuses on direct service to end clients across diverse industries while Specialty Distribution handles wholesale brokerage and insurance program management including unique risk solutions.
Revenue mix includes:
- Core commissions earned on premiums placed with carriers.
- Fee revenue for additional advisory services such as policy administration and risk management consulting.
- Profit-sharing contingent commissions that reward achieving volume or profitability targets with carriers.
- Earned premiums from captive insurance facilities where the firm participates in underwriting risk.
- Investment income tied to captive insurance capital deployment.
This multi-faceted revenue approach provides some insulation against fluctuating commission rates but remains vulnerable to carrier negotiation dynamics [S1][S2]. Commission rates are sensitive to market competition and regulatory limitations on permissible remuneration structures. Brown & Brown’s scale supports negotiating breadth with carriers across products which is a competitive advantage relative to smaller regional brokers.
Acquisition strategy is critical to growth, enabling expansion into new geographies or specialty niches while enhancing fee offerings through cross-selling opportunities. Recent deals have prompted segment realignment consolidating wholesale brokerage under Specialty Distribution to better reflect integrated service delivery [S7]. Successful portfolio integration is required to sustain client retention rates vital for recurring commissions.
Industry Structure and Competitive Position
The insurance brokerage industry positions firms like Brown & Brown as essential distribution intermediaries between carriers underwriting risk and clients seeking tailored insurance coverage. The market structure features several large national players with extensive carrier relationships (e.g., Aon, Marsh & McLennan) alongside mid-tier specialists differentiated by niche expertise or geographic focus.
Brown & Brown’s strength lies in its diversified exposure across retail brokerage clients spanning commercial insurance needs and specialty distribution serving complex programs including captive insurance solutions. This balance supports more stable total commissions earned compared to peers highly concentrated in either segment alone.
Competitive pressures arise from carrier pricing power that limits commission rates as well as evolving regulations curtailing permissible compensation structures. Technological disruption also threatens traditional brokering models by enabling direct carrier-to-client platforms or alternative risk transfer products [S1][S2]. Brown & Brown’s investment in advisory services and captive facilities participation helps differentiate it beyond commoditized brokerage services.
Growth Drivers
Several factors underpin potential growth opportunities for Brown & Brown:
- Expansion into specialty insurance lines with higher-margin advisory components responds to growing client demand for tailored risk management solutions.
- Continued rollout of acquisitions drives book of business increases through access to new clients and cross-selling of ancillary services.
- Complexity in client insurance needs boosts demand for multi-product solutions integrating employee benefits with property/casualty coverage.
- Participation in captive insurance facilities adds stable premium volume less sensitive to traditional commission volatility.
- Technology adoption enhances client engagement channels and operational efficiency supporting scalable growth without proportionate cost increases.
- Rising overall insurance premiums globally provide leverage on commission bases absent material rate reductions [N4][N6]
Monitoring operational KPIs like client retention rates, average commission per policy mix shifts toward fee revenues and success integrating acquisitions will be important markers of sustained value creation.
Risks and Constraints
Key risks influencing Brown & Brown's outlook include:
- Regulatory changes introducing new compliance costs or restricting commission/payor structures directly impact broker profitability margins [S2].
- Heavy reliance on carrier relationships means any loss or deterioration could reduce available capacity or compress agreed commission rates.
- Economic downturns could depress insurance purchasing volumes especially in commercial lines affecting overall premium bases handled.
- Integration risks remain material given acquisition frequency; failure to capture expected synergies or client churn post-deal would impair earnings.
- Litigation risks exist but appear immaterial currently per disclosures; however ongoing compliance vigilance is necessary given heightened regulatory scrutiny [S1].
- Competitive disruptions potentially stemming from technology-enabled new entrants or direct-to-client carrier models require continued innovation investment.
- Elevated leverage resulting from financing acquisitions imposes capital efficiency constraints at a net debt approaching $6.1 billion as of mid-2026 [F1].
What To Watch Next
Investors should track several near-term developments:
- Quarterly updates on revenue composition changes reflecting acquisition contributions versus organic retention/growth trends.
- Clarification from management regarding cost impact trajectories related to regulation-induced compliance spending increases [S2].
- Metrics relating to client renewal rates within both reportable segments signaling robustness of core recurring commissions.
- Progress reports on acquisition pipeline execution timing, deal sizes, integration milestones and resultant book of business expansions.
- Any indications from carriers regarding shifts in negotiated commission percentages or fee structures that materially affect revenue generation.
- Macroeconomic indicators influencing commercial insurance demand dynamics such as industry-specific exposures or premium inflation patterns.
Financial Profile Discussion
As of June 30, 2026, Brown & Brown reported cash and equivalents totaling approximately $918 million alongside current assets of about $8.69 billion versus current liabilities around $7.71 billion yielding a current ratio indicative of solid near-term liquidity at roughly 1.13x [F1]. This liquidity profile ensures operational flexibility amid rising regulatory compliance spending noted in filings [S2].
However, total debt remains elevated near $7.03 billion nominally at fiscal year-end December 31, 2025, implying net debt levels around $6.1 billion after accounting for cash buffers [F1]. This leverage reflects substantial borrowing tied primarily to funding recent acquisitions that are integral growth engines but also expose the firm to interest cost sensitivities under varying credit market conditions.
While the company has historically demonstrated free cash flow generation capacity supportive of debt servicing, careful management of cash conversion effectiveness amidst integration expenditures will be necessary moving forward. Return metrics such as operating margin absorption due to cost investments represent critical areas for scrutiny into late 2026 earnings disclosures plus subsequent quarters' trajectory guidance if provided explicitly by management.
Overall profitability remains anchored in recurring commission streams augmented by profit sharing contingent commissions alongside investment income diversifying sources beyond pure brokerage fees [S1][F1]. Maintaining this blend against external pressures will define margin sustainability over the medium term.
This analysis is based solely on publicly available SEC filings dated up to July 27, 2026 ([S1], [S2], [S3]) and standard industry understanding without any proprietary or non-public information. It aims exclusively to contextualize operating developments within industry fundamentals without constituting investment advice.
Financial position in context
As of 2026-06-30, companyfacts shows $918mm in cash and equivalents [F1]. Current assets of $8.7bn and current liabilities of $7.7bn imply a current ratio near 1.13x for 2026-06-30 [F1].
Disclaimer: This is research-only, informational analysis and not investment advice. It may include AI-generated interpretation and general industry context. Always verify important details using primary sources.

Comments