
Bridgewater Bancshares’ Earnings Rebound Signals Strength Amid Banking Sector Challenges
Bridgewater Bancshares delivered a strong net income rebound in fiscal 2025, capitalizing on stable loan growth and disciplined capital management.
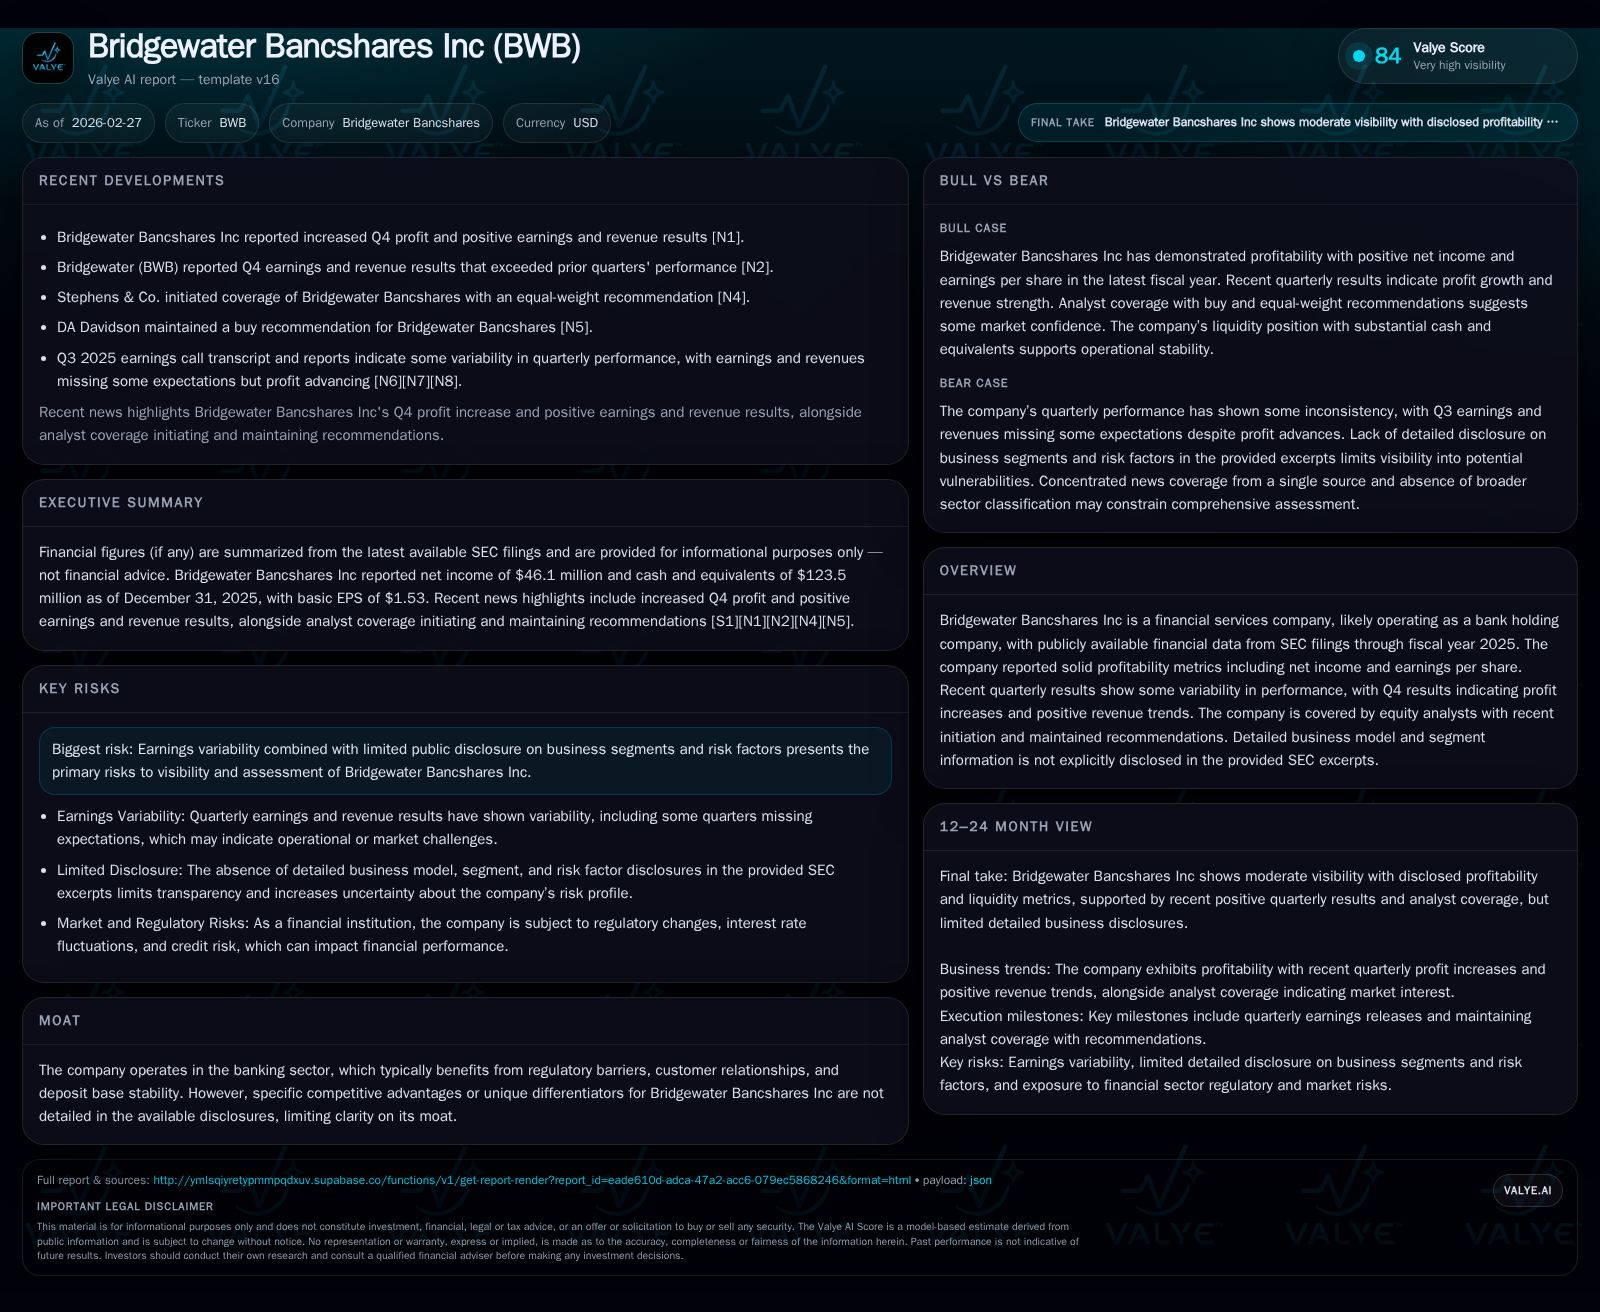
Bridgewater Bancshares reversed the earnings volatility seen in prior years with a 40.4% year-over-year net income increase in fiscal 2025, driven by expanding loans and deposit growth following its recent acquisition. Despite a notable decline in operating cash flow, the company maintained solid profitability metrics, including an approximate return on equity around 8.9%. Capital allocation remained prudent with moderated share buybacks and consistent dividend payments, supported by a strengthened equity base. Going forward, loan portfolio quality, margin pressures amid interest rate shifts, and regulatory scrutiny represent key watch points for future performance amid broader banking sector headwinds.
Fiscal 2025 Reverse: Earnings Rebound and Key Growth Drivers
Historical performance (annual)
| FY | Net ($mm) | CFO ($mm) | Capex ($mm) | Net YoY |
|---|---|---|---|---|
| 2025 | 46 | 28 | 6 | +40.4% |
| 2024 | 33 | 46 | 4 | -17.9% |
| 2023 | 40 | 30 | 3 | -25.2% |
| 2022 | 53 | 85 | 2 |
Source: SEC companyfacts cache [F1].
Capital returns and efficiency (annual)
| FY | Buybacks ($mm) | FCF ($mm) | ROE% |
|---|---|---|---|
| 2025 | 2 | 22 | 8.9 |
| 2024 | 5 | 42 | 7.2 |
| 2023 | 5 | 27 | 9.4 |
| 2022 | 11 | 83 | 13.5 |
Source: SEC companyfacts cache [F1].
Bridgewater Bancshares posted a meaningful net income increase of approximately 40.4% year-over-year in its fiscal 2025 results, rising from $32.8 million in FY2024 to $46.1 million in FY2025 [F1]. This rebound follows revenue gains observed notably in Q4 2025, where Bridgewater exceeded analyst expectations on both earnings and revenue [N1][N3]. The surge is largely attributable to continued loan growth which accelerated post-acquisition of First Minnetonka City Bank at the end of 2024—a deal that contributed around $117 million in loans and an additional $226 million in deposits immediately [S18]. These increments helped expand net interest income by leveraging a larger deposit base, supporting core banking revenues.
However, contrasting results appear when examining associated cash flow metrics; operating cash flow declined by approximately 40% over the same period despite rising net income [F1]. This suggests increased working capital or timing effects likely due to higher investments or shifting loan portfolio management strategies. Overall, Bridgewater's earnings recovery underscores operational resilience within a volatile banking environment.
Loan Portfolio and Deposit Base: Foundations of Stability
The strength of Bridgewater's asset base anchors its financial performance. The company’s loan portfolio shows healthy segmentation across commercial real estate (both owner-occupied and non-owner occupied), multi-family residential properties, one-to-four family mortgages, construction loans, and consumer lending segments as detailed in quarterly regulatory reports [S2][S26]. Credit quality metrics indicate most loans remain classified as 'pass' with limited exposure categorized under 'special mention' or 'substandard'—a positive signal pointing toward controlled credit risk profiles.
Deposits grew significantly through organic expansion and branch footprint enhancement following the First Minnetonka City Bank acquisition [S18]. This added two branches in Minnetonka and boosted deposit liquidity by over $225 million at closing. In a banking industry context, such deposit stickiness fosters a defensive competitive positioning against peers reliant on more volatile wholesale funding sources.
Examining Profitability Metrics and Operating Efficiency
Bridgewater delivered an approximate return on equity (ROE) of 8.9% for FY2025 based on reported net income relative to equity of about $517 million [F1]. This compares favorably following fluctuations from prior years attributable to macroeconomic shifts and integration costs post-acquisition.
Notably, operating cash flow decreased year-over-year—from $46.4 million to roughly $27.8 million—as capital expenditures climbed roughly 43%, reaching nearly $5.85 million [F1]. Increasing capex reflects strategic investments potentially tied to branch modernization or technology upgrades aimed at maintaining competitive service levels within regional banking markets.
The divergence between rising net income yet declining cash flow underscores nuanced operational dynamics where accrual accounting benefits may not immediately convert into liquidity—an important consideration for assessing sustainability against sector peers.
Capital Allocation Priorities: Dividends, Buybacks, and Investment Trends
Bridgewater maintained its commitment to shareholder returns through dividend payments while moderating share repurchase activity significantly. Total buybacks fell from approximately $5.19 million in FY2024 to just over $2.19 million in FY2025 [F1][S23]. This cautious pace may reflect prudent balance sheet management amidst uncertain economic conditions by preserving capital buffers rather than aggressively returning cash.
The company also executed subordinated note transactions during mid-2025 involving issuance of new fixed-to-floating rate notes due 2035 totaling $80 million used partly to redeem older debt maturing sooner [S15]. This refinancing illustrates proactive liability management shaping longer-term funding cost profiles.
Liquefying Liquidity: Cash Flow Variability and Funding Structure
The company ended calendar year 2025 with cash and equivalents around $123.5 million [F1], down from previous quarters but supported by substantial deposits surpassing liabilities on the balance sheet [S16][S17]. Operating cash flows have shown noticeable variability tied to managing accrued interest receivables/payables alongside securities sales/purchases inherent to bank portfolios.
Bridgewater’s debt structure includes Federal Home Loan Bank advances fluctuating between principal repayments and new advances—typical for regional banks seeking diversified funding sources—and subordinated debt refinancings that shift interest obligations forward into longer horizons [S19][S10]. Hedging instruments such as interest rate swaps are employed per disclosures but levels are not extensively quantified [S6], suggesting an intermediate level of derivative usage typical among mid-sized financial institutions balancing rate exposures without complex instruments.
Forward View: Growth Prospects, Risks, and Sector Headwinds
Looking ahead, Bridgewater's growth depends heavily on sustaining loan book expansion while containing credit expense amid volatile economic cycles highlighted in recent risk factor disclosures [S4][S29]. Legal proceedings referenced remain limited but warrant monitoring given the banking regulatory environment's intensifying oversight standards.
No explicit segment-level guidance was published; however, market intelligence indicates margin pressures may arise if deposit cost competition intensifies or national rate volatility impacts lending spreads negatively [N1][N3]. Similarly, evolving commercial real estate conditions could add pressure if certain segments experience softness—it remains crucial that credit quality maintains current levels.
Investor Takeaways: Indicators to Watch in Upcoming Quarters
With no explicit forward guidance available from Bridgewater's filings or release notes, several indicators warrant close observation:
- Loan Growth Mutation: Monitoring quarterly updates for sustained momentum post-acquisition integration will reveal underlying organic demand strength.
- Credit Quality Evolution: Watch shifts within loan segments tagged as pass versus substandard or special mention.
- Net Interest Margin Dynamics: Changes reflecting funding cost fluctuations against asset yields will impact profitability trends.
- Capital Return Policies: Adjustments to dividend rates or share buyback programs may signal evolving confidence or caution.
- Liquidity Status: Cash reserves alongside managed debt maturity schedules provide critical stress test insights amid sector uncertainties.
Overall, Bridgewater exhibits signs of financial health recovery buttressed by strategic acquisitions and disciplined capital actions — yet it navigates familiar challenges endemic to regional banks operating within national regulatory frameworks.
This analysis leverages publicly available SEC filings through fiscal year-end 2025 combined with recent earnings commentary but does not constitute investment advice.
Disclaimer: This is research-only, informational analysis and not investment advice. It may include AI-generated interpretation and general industry context. Always verify important details using primary sources.
Comments