
Baldwin Insurance Group Expands Revenue Amid Rising Expenses and Partnership Growth
Strong organic and partnership-driven commission growth in Q2 2026 contrasts with sharp expense increases and ongoing net losses.
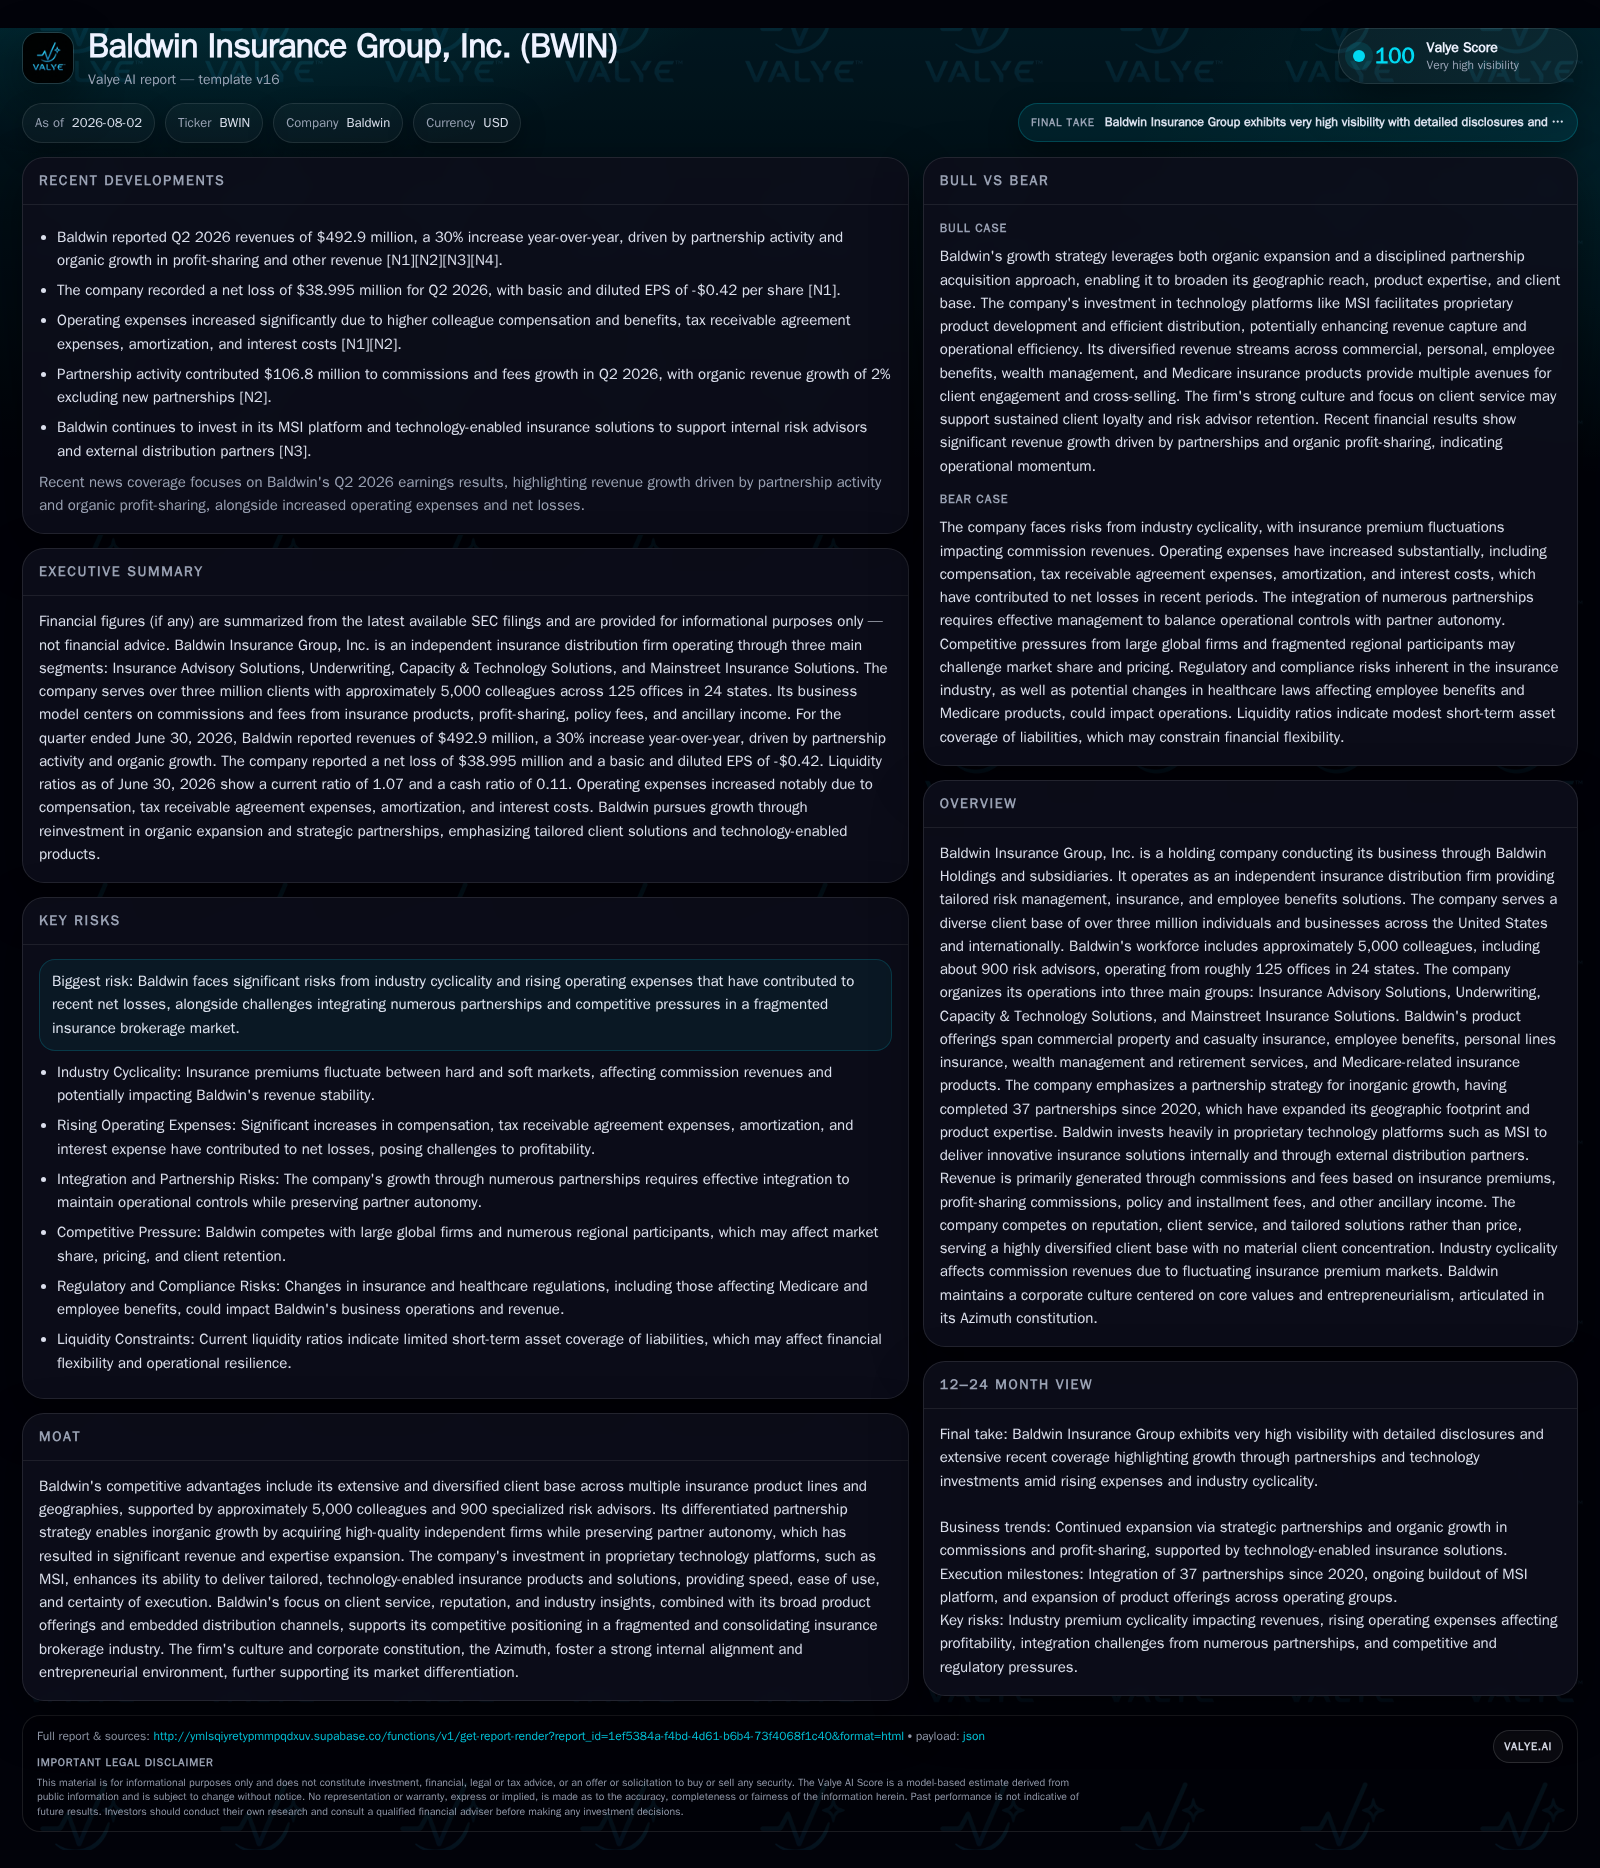
Baldwin Insurance Group (BWIN) reported a 30% increase in commissions and fees revenue in Q2 2026, fueled by organic growth and acquisitions. Despite top-line strength, operating income swung to a loss due to substantial rises in compensation, amortization, and other operating expenses related to new partnerships. The company continues executing a partnership strategy that drives scale and diversification while investing in proprietary technology platforms. Key risks include expense inflation, integration complexity, and industry cyclicality impacting commission yields. Liquidity appears adequate with $184.5 million cash and $259 million revolver availability as of mid-2026, supporting continued growth initiatives.
Recent Operating Update
However, this top-line growth was overshadowed by a significant hike in operating expenses which jumped 43% to over $501 million during the quarter. Key cost drivers were a notable 35% increase in colleague compensation and benefits ($264 million), reflecting the integration of new partners and payroll inflation pressures. Other operating expenses surged by an outsized 68%, likely from integration-related costs, expanded service capabilities, and elevated administrative outlays [S2]. Amortization expense more than doubled to $56 million year-over-year due to acquisition-related intangibles.
Consequently, the company recorded an operating loss of $8.3 million compared with operating income of $27.9 million in the year-ago quarter. Interest expense net of capitalized costs climbed meaningfully by approximately 46%, exacerbating overall net loss dynamics. After taxes, Baldwin posted a net loss of about $56 million in Q2 versus a much smaller loss previously [S2]. This outcome reflects the near-term trade-off Baldwin incurs by accelerating inorganic growth while investing heavily in workforce expansion and technology.
Business Model Overview
Baldwin operates as an independent insurance brokerage holding company providing tailored insurance distribution across commercial property & casualty (P&C), employee benefits, personal lines insurance, Medicare-related products, wealth management, and retirement services [S1]. The company generates revenue primarily through commissions and fees on insurance premiums it helps place between clients—over three million individuals and businesses—and insurers. Commission levels correlate closely with insurance premium volumes which are cyclical given market-driven rate changes.
In addition to core commissions typically derived as a percentage of premium volumes placed for clients, Baldwin earns profit-sharing commissions tied to underwriting results or volumes achieved with insurance carrier partners. It also leverages administrative service fees under managing general agent (MGA) arrangements providing policy documentation, payment processing, or premium financing services [S1].
Revenue growth stems from expanding client relationships organically—renewing existing policies or cross-selling additional lines—and from inorganic lifts through strategic acquisitions of entrepreneurial independent brokerages that retain operational autonomy but benefit from Baldwin’s scale infrastructure.
Industry Structure & Competitive Position
The insurance brokerage industry is highly fragmented but undergoing sustained consolidation amid fierce competition on product breadth, service differentiation, client relationships, technology adoption, and pricing power. Large global firms like Marsh & McLennan Companies, Aon plc, Willis Towers Watson, Arthur J. Gallagher & Co., and Brown & Brown represent broad-based competitors offering comprehensive risk management solutions.
Baldwin’s competitive moat relies on blending extensive geographic reach (125 offices across 24 states), diversified product mix spanning multiple insurance lines including fast-growing employee benefits and Medicare markets, and nearly 900 specialized risk advisors who maintain close client engagement [S1]. Its strategic partnership model acquires high-quality independent firms preserving entrepreneurial culture while scaling service excellence.
Proprietary technology platforms such as Mainstreet Insurance Solutions (MSI) play an increasing role in differentiating Baldwin by enabling speedier policy placement automation, customized insurance products tailored with embedded analytics, enhanced client experience through digital access points, and delivering certainty of execution critical for retention [S1]. This technology-enabled approach supports resilient client loyalty despite soft or competitive market conditions affecting premium rates
Growth Drivers
Organic revenue expansion hinges on policy renewals at solid rates—the seasonal cadence historically favors first-quarter renewals—but also on growing average premium size per client via cross-selling more products or upgrading coverage aligned with evolving risk exposures [S1]. Investment in expanding risk advisor headcount boosts opportunity pipeline generation.
Inorganic growth remains central via partnership acquisitions that add scale rapidly without diluting entrepreneurial partner autonomy—a provider-friendly approach attracting top brokers [S2]. Since early 2026 alone, Baldwin integrated key partnerships (CAC Group/Obie), adding materially to risk advisor count and expanding geographic reach.
Widening product offerings into employee benefits administration services and Medicare market segments captures favorable demographic tailwinds from aging populations requiring more specialized insurances [S1]. The company’s flagging efforts in wealth management round out holistic financial protection strategies appealing to clients seeking integrated advisory solutions.
Technology investments bolster operational efficiencies lowering cost-to-serve ratios over time as MSI matures across internal users and external distribution channels [S1]. This transformation underpins potential margin improvement once amortization stabilizes post-integration phases.
Risks & Growth Constraints
Significant short-term risks arise from sharp rises in operating expenses linked to acquisition integrations—colleague compensation surged disproportionately given onboarding new partners plus wage pressures—and the doubling of amortization charges related to intangible assets from recent partnerships jeopardizes near-term profitability targets [S2]. Persistently negative net income pressures balance sheet strength if not offset by cash flow generation.
Market cyclicality affecting property/casualty premium rates exerts direct influence on commission yield volatility. Soft market conditions could compress commissions despite volume gains; intense carrier competition may further reduce rates offered to brokers which dampens revenue upside even amid rising insured values or client counts [S1]
Integration complexity remains nontrivial. Preserving partner independence while requiring consistent financial reporting standards can strain back-office operations and delay capturing full synergy benefits. Failure to harmonize technologies or cultural incompatibilities could disrupt client retention or motivator incentives within newly onboarded teams.
Elevated leverage (approximately $1.6 billion debt against ~$185 million cash) requires prudent liquidity management particularly as interest costs have grown significantly alongside rising borrowings utilized for partnership funding activities [F1][S15][S7]
What To Watch Next
Upcoming milestones include monitoring organic commission growth pace quarter-over-quarter excluding new partnership contributions for evidence of core demand resilience amid cyclical premiums shifts [S19].
Policy renewal rates remain critical early indicators given their material contribution to recurring commissioning streams; any deviation would signal client attrition or product competitiveness issues.
Adjusted EBITDA margin evolution will reveal whether operational leverage improves as integration costs normalize post-acquisition waves seen through early 2026.
Further partnership deals announced or closed will indicate sustainability of inorganic growth engine fueling network expansion as well as risk advisor recruitments which directly impact future revenue capacity.
Capital allocation decisions around stock repurchases authorized up to $250 million offer insight into confidence toward balancing shareholder returns versus reinvestment needs amid current losses [S7]. Tracking quarterly progress on amortization expense stabilization offers clues on transition maturity alongside MSI platform adoption metrics internally.
Financial Profile Discussion
As of June 30, 2026, Baldwin held solid liquidity positions with about $184.5 million cash balances complemented by current assets of approximately $1.85 billion and current liabilities near $1.72 billion, resulting in a current ratio of about 1.07x, reflecting balanced short-term asset and liability positioning [F1]
Interest expense pressures reflected rising borrowings allocated toward funding acquisition payments alongside general interest rate fluctuations pushing net interest costs higher by roughly 46% year-over-year in Q2 alone [S2]
Overall free cash flow generation remains positive albeit under pressure given reinvestment in partnerships; maintaining discipline around cost containment paired with achieving synergies remains pivotal for medium-term margin recovery alongside revenue scale benefits accrued from expanded geographic footprints and portfolio diversification effects.
Disclaimer: This analysis is prepared solely for informational purposes referencing public filings without providing investment advice or research views.
Disclaimer: This is research-only, informational analysis and not investment advice. It may include AI-generated interpretation and general industry context. Always verify important details using primary sources.

Comments