
CrossAmerica Partners LP Pursues Growth Amid Operational Complexity and Leverage Constraints
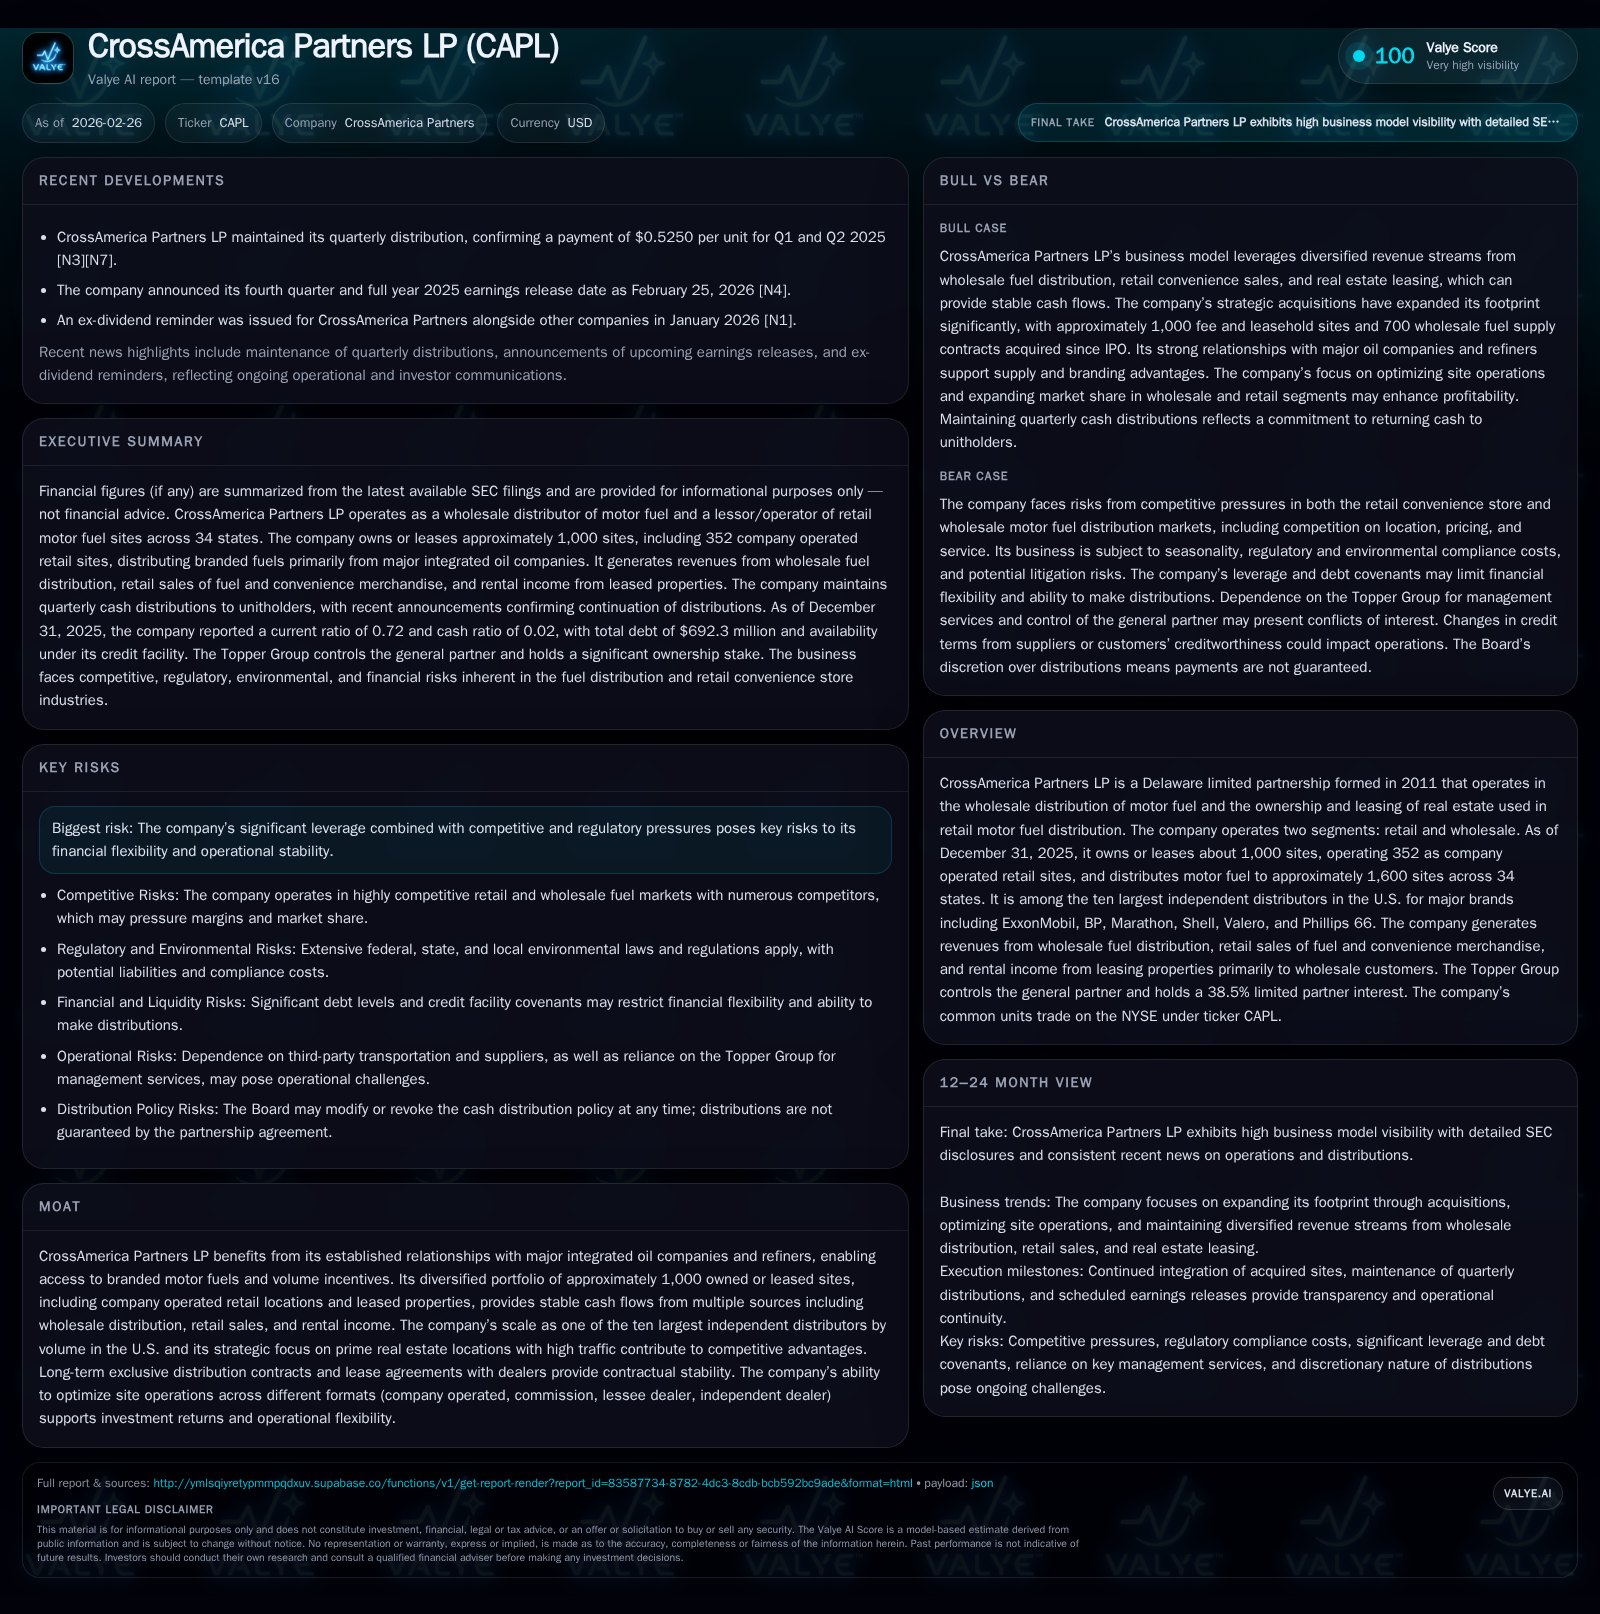
CrossAmerica Partners LP operates a diverse portfolio of fuel distribution and retail sites, balancing wholesale and retail segments while managing significant leverage and regulatory risks.
CrossAmerica Partners LP (CAPL) stands as one of the largest independent motor fuel distributors in the U.S., with a portfolio of about 1,000 owned or leased sites and extensive branded supplier relationships. Its performance over recent years shows moderate revenue growth with volatile operating income fluctuating by competitive market conditions and operational decisions. Future growth hinges largely on strategic acquisitions, optimizing site operations across formats, and maintaining supplier contracts. The company faces headwinds from regulatory compliance costs, competitive fragmentation, and considerable leverage that constrains financial flexibility. Investors should monitor developments in distribution contracts, execution of acquisitions, and any shifts in consumer demand or credit costs.
Company Overview
Founded in 2011 as a Delaware limited partnership, CrossAmerica Partners LP (ticker CAPL) operates primarily as a wholesale distributor of motor fuel alongside owning and leasing retail real estate for motor fuel distribution. It commands one of the top ten positions among U.S. independent distributors by volume.[S1][S7]
The company's business model revolves around two main operating segments: Wholesale distribution to independent and lessee dealers; and Retail operations where it runs company-operated service stations. At the end of December 2025, CrossAmerica controlled approximately 1,000 fuel sites — owning or leasing them — of which it operated 352 directly as retailer locations.[S1][S7]
CrossAmerica’s reach spans about 1,600 total retail sites across 34 states where it distributes fuels under leading brands including ExxonMobil, BP, Marathon, Shell, Valero, and Phillips 66. Notably branded fuels represent some 95% of its distributed volume.[S7]
Its revenue streams stem from wholesale fuel margins (where some contracts are indexed to rack prices plus transportation), direct retail fuel sales coupled with convenience merchandise at company-operated sites, lease income from dealers renting its properties, commissions paid to agents managing certain outlets on its behalf, and other contractual arrangements.
The Topper Group controls CrossAmerica’s General Partner entity as well as holding a substantial limited partner stake (38.5%) — offering centralized management control yet also creating potential conflicts of interest which require close governance oversight.[S1][S18]
Historical Financial Performance
CrossAmerica’s reported revenues were $501 million for fiscal year ending December 31, 2025 — representing an approximate rise of 8% year-over-year compared with prior periods [F1]. Operating income rebounded notably to nearly $98 million (+38%), indicating improved cost management or margin expansion despite ongoing headwinds in the sector.[F1]
Operating cash flows remained solid at $91.5 million for the same period (+4%), while capital expenditures increased substantially (~36%) to $35.7 million reflecting investments into site upgrades or expansions that are essential given the competitive landscape and compliance demands.[F1]
Approximate free cash flow for FY25 stood around $56 million after capex deductions,[F1] supporting steady distributions despite high leverage levels.
Historical performance (annual)
| FY | CFO ($mm) | OpInc ($mm) | Capex ($mm) |
|---|---|---|---|
| 2025 | 91 | 98 | 36 |
| 2024 | 88 | 71 | 26 |
| 2023 | 117 | 88 | 35 |
| 2022 | 161 | 96 | 30 |
Source: SEC companyfacts cache [F1].
Capital returns and efficiency (annual)
| FY | FCF ($mm) |
|---|---|
| 2025 | 56 |
| 2024 | 61 |
| 2023 | 82 |
| 2022 | 131 |
Source: SEC companyfacts cache [F1].
This dataset reveals fluctuations particularly in operating income and cash flow due to market dynamics including fuel price volatility and operational adjustments.
Net income data is less comprehensive post-2020 but showed recovery trends earlier with net earnings nearly doubling from a low base in recent years.[F1]
Business Segments & Operational Details
CrossAmerica's retail segment includes company-operated sites where it holds full inventory ownership and controls pricing strategies directly influencing gross margin capture.[S7][S11] Meanwhile the wholesale segment deals primarily through exclusive supply contracts:
Independent Dealers: Own/lease property; CrossAmerica has exclusive distribution agreements typically lasting between seven to twenty years with average contract duration near six years at present—providing relatively stable long-term volumes.[S7][S22]
Lessee Dealers: Lease property from CrossAmerica under triple net leases concurrently timed with exclusive distribution contracts averaging slightly above two years remaining tenure as of end-2025.[S7][S22]
Distribution contracts are mostly linked to posted rack prices with mechanisms for volume rebates or incentives from supplier majors which bolster margins but can require rebate repayment if branding changes occur within contractual windows.[S7][S17]
Growth Drivers & Future Prospects
Strategic Acquisitions & Market Expansion
CrossAmerica aims to grow through acquiring additional retail sites — approximately $1.5 billion invested since its IPO amounting to about a thousand fee/leasehold interests plus seven hundred wholesale supply contracts.[S22] Such acquisitions allow the company to bolster its footprint quickly within established markets or enter adjacent regions.
Integration success depends on optimizing site operational formats—switching between company operation, lessee dealer leasing models or commission agents depending on localized economics and customer profiles.[S17][S22] This flexible asset management maximizes returns versus fixed operational models common among smaller peers.
Supplier Relationships & Contract Stability
Strong ties to major integrated oil companies underpin access to branded fuels which dominate distribution volumes (95%). The weighted-average contract term remaining (5.6 years) affords visibility yet necessitates renewal diligence given market evolution risks.[S7][S22]
Such relationships also allow favorable volume incentives supporting incremental margin capture unattainable by unbranded operators.
Real Estate Asset Monetization & Rental Income Growth
Owning prime real estate permits rental revenue streams from lessee dealers supplementing fuel margin volatility exposure.[S17] Strategic enhancements on site properties can elevate leasing fees or attract higher quality tenants.
Operational Efficiency & Retail Segment Performance Improvement
Improving retail site profitability involves optimizing store assortment beyond fuel – focusing on convenience merchandise sales which carry higher absolute margins but face intense competition.
Meanwhile controlling credit/debit card transaction fees linked directly to raw fuel prices remains an important cost-management facet impacting net margin outcomes.[S9]
Macroeconomic & Sector Dynamics Influencing Demand Patterns
Fuel demand sensitivity exists vis-à-vis economic cycles affecting travel miles driven along with evolving consumer behavior including adoption rates for electric vehicles or alternative fuels which pose long-term structural challenges.[S23] Seasonality causes revenue spikes during summer quarters related to travel peaks increasing volumes across both retail and wholesale segments.[S10]
Risks & Constraints
Leverage & Liquidity Pressures
With total debt around $692 million at year-end accompanied by credit facility limits subjecting distributions to covenant compliance,[S6][S13] CrossAmerica bears financial constraints limiting flexibility particularly if macroeconomic downturns reduce cash flows. Interest rate variability compounds cost uncertainty despite hedging arrangements.[S6]
Competitive Intensity & Fragmentation
Both wholesale distribution and convenience store operations face considerable competition from numerous regional players along with non-traditional entrants such as supermarkets offering fuel or alternative convenience products that may erode pricing power.[S9][S20]
Regulatory & Compliance Exposure
Environmental laws (including stringent storage tank regulations), labor legislation affecting wages/benefits,[S21][S25] product quality standards impacting brand reputation,[S24] plus evolving ESG expectations introduce compliance costs that may compress margins or force disruptive capital outlays. Moreover, litigation exposure relates to personal injury claims or environmental cleanup liabilities tied historically or presently to acquired properties requiring continual monitoring.[S3][S4][S16][S24]
Supplier & Customer Credit Risk
Dependency on four principal motor fuel suppliers accounting for nearly eighty percent purchased volumes concentrates counterparty risk. Similarly customer payment delays could generate accounts receivable volatility undermining liquidity if bad debts rise unexpectedly.[S12] Trade credit terms crucially influence working capital requirements.
Seasonal Variability & Weather Impacts
Sales fluctuate seasonally aligned with travel patterns which may affect quarterly results unpredictably if unusually severe weather events disrupt traffic or operations at key sites.[S10]
Technological & Behavioral Shifts
Growing electric vehicle adoption poses medium-to-long term reduction risk on volumetric fuel demand if infrastructure adapts faster than current projections suggest. Consumer preferences evolving towards healthier food options at convenience stores may necessitate shifts in retail product offerings impacting commercial mix profitability. [S23]
Capital Allocation & Returns Profile
Capital expenditures have risen notably recently (up ~36% YOY to $35.7 million)[F1], supporting facility upgrades imperative for safety standards adherence and improving customer experience. Operating cash flow remains robust though volatile relative to capex demands; resulting free cash flow around $56 million[F1] supports ongoing distributions although payout policies maintain flexibility per Board discretion without mandatory commitments[S23]. Historical dividend payments appear small relative to operating cash flow generation reflecting conservative payout focus preserving investment capacity[F1]. No recent buybacks have been noted contrasting prior repurchase activity that ceased post-2018[F1]. Information on return metrics like ROE is unavailable though substantial leverage implies sensitivity in credit costs impacting net profitability.
Milestones & What To Watch Next
CrossAmerica’s next earnings announcement scheduled February 25th, 2026 will shed light on actual fiscal Q4/annual results performance amid challenging late-cycle energy pricing environment[N1][S3]. Investors should track:
- Acquisition pipeline progression including integration success metrics,
- Changes in supplier contract terms or renegotiations,
- Leasing activity growth at owned properties,
- Retail segment same-store sales trends especially non-fuel categories,
- Debt covenant compliance status amid rising interest rates,
- Any updates on material litigation or regulatory developments,
- Management commentary on exposure mitigation strategies regarding electric vehicle adoption impact, and overall distribution policy guidance updates following Q4 results.
Conclusion
CrossAmerica Partners LP manages a complex operation bridging wholesale volume distribution underpinned by strong brand supplier ties alongside diversified retail real estate assets generating multiple steady income streams. While recent financial trends show recovered operating profits supported by active capital deployment into upgrades and strategic market expansion via acquisitions totaling nearly $1.5 billion value since IPO,the firm faces tangible risks related primarily to high leverage levels that may restrict agility going forward amid intensifying competition,sensitive commodity pricing,and evolving regulatory norms. Maintaining seamless supplier relationships will remain crucial alongside continuous site operational optimization across company operated vs commissioned dealer formats driving profitability resilience. overall,the company's positioning reflects both structural opportunities inherent in scale/brand affiliation mix,and vulnerabilities linked to sector cyclicality emergent consumer lifestyle transitions,and broader economic variables affecting discretionary travel/spending patterns.
Disclaimer: This analysis is based solely on publicly available data as of February 2026 including SEC filings and news releases referenced herein.It does not constitute investment advice or recommendations.
Disclaimer: This is research-only, informational analysis and not investment advice. It may include AI-generated interpretation and general industry context. Always verify important details using primary sources.
Comments