
Crescent Capital BDC Postures for Steady Income Amid Rising Leverage and Portfolio Risks
Middle-market lending specialization, regulatory discipline, and capital allocation choices define Crescent Capital BDC’s recent trajectory.
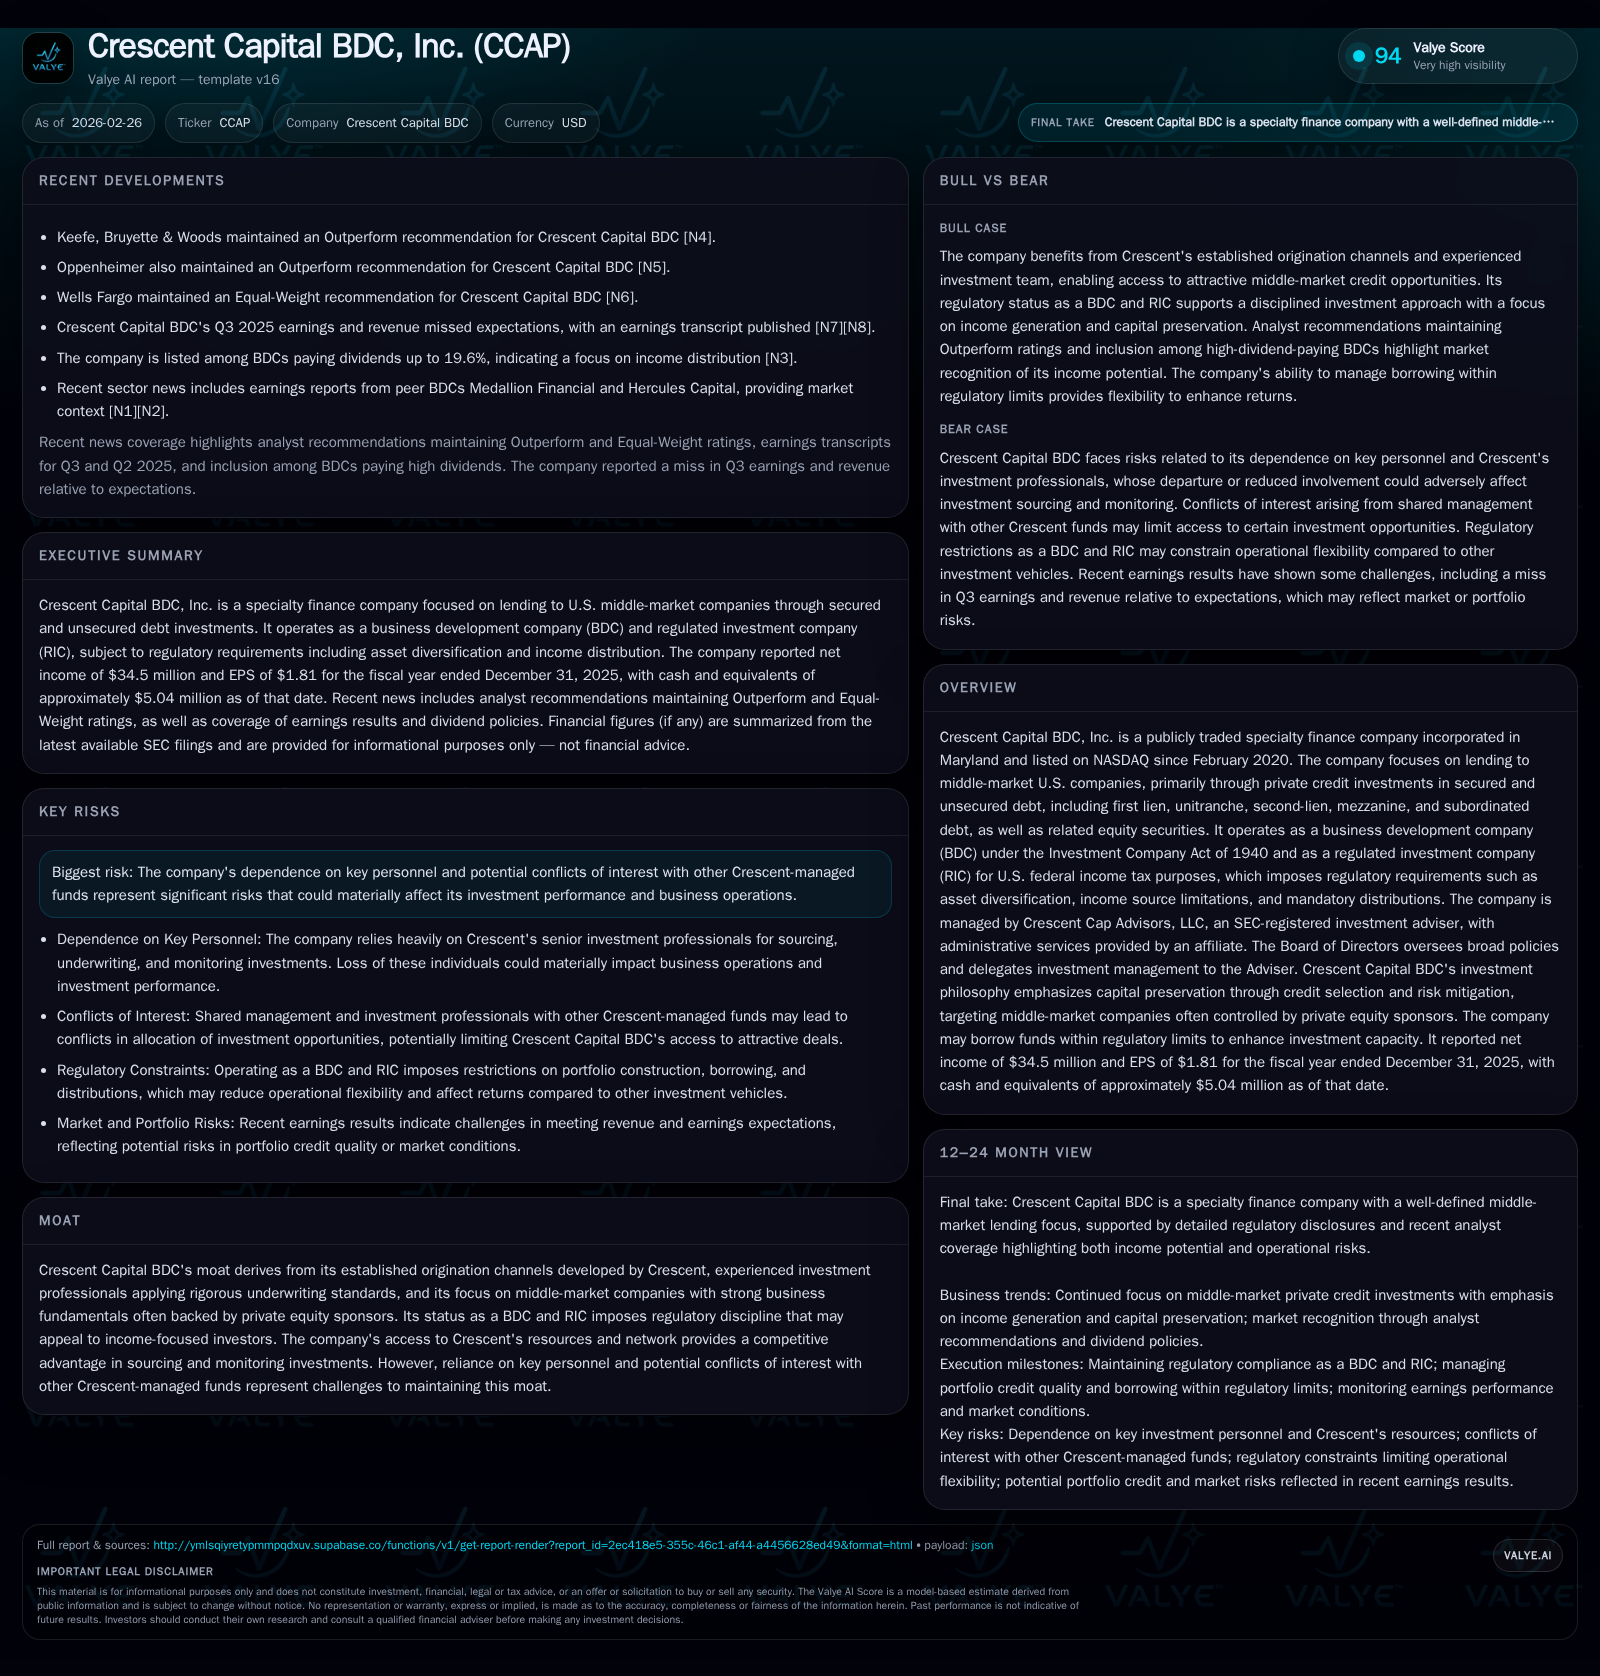
Crescent Capital BDC, Inc. (CCAP), a NASDAQ-listed specialty finance company since 2020, targets middle-market US borrowers with a diversified debt portfolio anchored in private credit investments. The firm’s performance reflects steady net income generation despite ongoing operating losses, underpinned by prudent underwriting and strong origination channels from its advisor Crescent Cap Advisors. Regulatory constraints as a business development company (BDC) and regulated investment company (RIC) shape capital deployment, leverage limits, and dividend policies, while reliance on leverage introduces heightened risks amid macroeconomic uncertainty. Capital returns remain consistent though modest buybacks and payouts are constrained by coverage ratios and market conditions. Monitoring liquidity, asset valuations, and credit quality will be critical to its near-term outlook.
Company Overview
Crescent Capital BDC, Inc. (CCAP) operates as a specialty finance company focusing primarily on lending to middle-market U.S. companies. Publicly traded on NASDAQ since early 2020, it is structured as a business development company under the Investment Company Act of 1940 and elects regulated investment company status for U.S. tax purposes [S1]. This regulatory framework mandates asset diversification, income source restrictions, mandatory annual distributions of taxable income (generally at least 90%), and limits on leverage.
Managed externally by the SEC-registered investment adviser Crescent Cap Advisors LLC, CCAP benefits from access to well-established origination channels within its parent organization Crescent [S1]. The company seeks to maximize total shareholder returns through current income generation supplemented by capital appreciation via investments in secured (first lien, unitranche, second-lien) and unsecured debt instruments (mezzanine, subordinated) across private credit transactions with an occasional complement of liquid broadly syndicated loans [S1]. The target borrowers are typically private equity-backed middle-market entities requiring capital for growth initiatives or leveraged buyouts.
Historical Financial Performance
CCAP’s financial results during the most recent four fiscal years demonstrate notable features of its operating model: consistent negative operating income offset by positive net income outcomes driven primarily through investment gains recognized elsewhere in the income statement. Operating loss narrowed from approximately $106.8 million in fiscal 2024 to $98.7 million in fiscal 2025 — an improvement of roughly 7.6% year over year, which suggests some operational efficiencies or reduced expenses [F1]. Meanwhile, net income fell sharply by about 53% between those years to $34.5 million in FY2025 during volatile realized investment gains [F1].
Operating cash flows improved substantially over this period reflecting stronger collections or reduced working capital needs, moving from $58.9 million in FY2024 to $74.7 million in FY2025 (+26.8%) [F1]. Equity capital declined modestly from $740.6 million to $706 million during the same interval attributable to combined effects of net earnings volatility and portfolio valuation shifts [F1].
Dividend payouts have remained a significant priority with distributions totaling about $67.8 million paid during FY2025—down slightly from the prior year but maintaining robust yield characteristics typical among BDCs [F1]. Share repurchases have been minimal with only about $1.3 million spent in FY2025 indicative of a conservative approach toward buybacks given leverage and liquidity considerations [F1].
Historical performance (annual)
| FY | Net ($mm) | CFO ($mm) | OpInc ($mm) | Net YoY |
|---|---|---|---|---|
| 2025 | 35 | 75 | -99 | -53.1% |
| 2024 | 74 | 59 | -107 | -12.2% |
| 2023 | 84 | 92 | -100 | +439.4% |
| 2022 | 16 | 28 | -57 |
Source: SEC companyfacts cache [F1].
Capital returns and efficiency (annual)
| FY | Div ($mm) | Buybacks ($mm) | ROE% |
|---|---|---|---|
| 2025 | 68 | 1 | 4.9 |
| 2024 | 75 | 9.9 | |
| 2023 | 65 | 11.3 | |
| 2022 | 55 | 2 | 2.5 |
Source: SEC companyfacts cache [F1].
Note: Operating income excludes realized/unrealized gains affecting net income; revenue line not separately reported.
Business Model Features and Investment Strategy
Central to CCAP's moat is its alignment with Crescent’s broader platform expertise in sourcing middle-market credit opportunities with strong underwriting discipline emphasized to preserve capital under stressed conditions [S1]. Its credit focus spans senior secured loans—usually first lien or unitranche arrangements—and selected subordinated or mezzanine tranches deployed carefully with downside protections like sizeable collateral cushions and cash flow covenants [S1].
Furthermore, CCAP’s ability to draw upon Crescent’s established origination channels coupled with seasoned investment professionals positions it well relative to less integrated specialty lenders [S1]. Given its status as a BDC/RIC hybrid entity subjected to stringent diversification rules (minimum 70% qualifying assets), leverage limits (150% asset coverage ratio), and distribution mandates to shareholders (~90% taxable income distributed annually), CCAP must continuously balance growth opportunities against regulatory compliance constraints [S1][S4][S21].
The company invests predominantly through private credit transactions but selectively supplements these with more liquid broadly syndicated loans when attractive opportunities or portfolio composition needs arise [S1]. This dual approach helps stabilize returns while targeting higher yields normally found in private lending spaces lacking public market benchmarks.
Capital Structure and Liquidity Dynamics
CCAP employs leverage as an essential mechanism to amplify returns on equity; however regulatory caps pose binding constraints limiting total borrowings to roughly two-thirds of total assets after deducting liabilities not represented by senior securities [S4][S21]. The firm entered into credit facilities backed by pledging up to all its assets under loan agreements giving lenders security interests facilitating leveraged deployments yet also creating vulnerabilities if loan valuations deteriorate triggering borrowing base deficiencies [S4][S6][S9].
Compliance with financial covenants linked to portfolio yields or delinquency thresholds is critical lest the company face events of default accelerating debt repayment schedules forcing distressed asset sales potentially at unfavorable prices causing erosion of shareholder value [S4][S6][S7][S9]. Management recognizes these leverage-related risks explicitly noting their strategy involves careful assessment of maturity profiles alongside borrowing costs while being prepared for refinancing uncertainties especially during market turbulence [S10][S12][S14].
Liquidity management fashions another key challenge given mandated distributions substantially reduce free cash flow available for reinvestment or debt reduction forcing external capital raises for growth initiatives—offering upside potential but exposing CCAP to macroeconomic and capital market cycles impacting issuance conditions [S14][S19][S20].
Risks: Operational Dependencies & Market Sensitivities
Key personnel dependence is non-trivial due to the externalized management model reliant on Crescent Cap Advisors’ executive team whose intellectual capital drives underwriting quality and portfolio oversight efforts; loss or disruption here could materially impair performance [S13][N2]. Additionally conflict of interest concerns loom given other funds managed by Crescent competing for deal origination or co-investment slots raising governance scrutiny risks potentially hindering transaction execution cadence or economics [S13].
Credit risks remain paramount reflective of exposure concentrated in leveraged companies susceptible to economic downturns where rising interest rates may compress borrower profitability increasing default likelihood thereby eroding asset values forcing reserves or write-downs adversely affecting NAV and distributable earnings production [S26][S30][N1]. Risk factors also emphasize potential lender liability claims if CCAP provides significant managerial assistance in restructuring scenarios complicating recovery rights hierarchy [S16][S17][S18].
Additional structural challenges stem from the requirement that failure to maintain BDC or RIC status would impose heavier regulation reducing operational flexibility while potential shareholder dilution remains an ever-present risk via distribution reinvestment plans altering tax treatment profiles necessitating shareholder vigilance [S23][S24].
Growth Outlook & Near-Term Monitoring Points (Analysis)
Explicit forward guidance has not been provided recently; therefore key metrics warranting ongoing scrutiny include: evolution of portfolio credit quality amid gradual economic headwinds; maintenance of regulatory asset coverage ratios avoiding forced deleveraging; adaptability in accessing debt markets especially lines of credit renewals; pacing of originations balancing yield versus risk within concentration limits; dividend sustainability given non-cash PIK interest accruals; effectiveness managing conflicts across Crescent ecosystem; trajectory of net asset value adjustments reflecting mark-to-market dynamics.
New investments will likely continue emphasizing sponsorship-backed middle-market deals leveraging private credit niche advantages though competitive pressures from other specialty lenders may compress spreads necessitating judicious underwriting calibration [N2] . Potential add-on acquisitions or expanded sector focuses remain possible subject to board approval aligning with strategic long-term positioning.
Returns & Capital Allocation Priorities
Capital returned through dividends totaled nearly $68M in FY2025 reflecting continued commitment to yield-focused shareholders consistent with BDC norms though median yields among peers vary based on risk appetite [F1]; however incremental share repurchases remain minimal indicating limited discretionary capacity given leverage levels constraining free cash flow after distributions servicing debt obligations [F1][S22].
ROE approximated near 4.9% for FY2025 based on net income relative to equity base highlighting moderate profitability margins given the highly leveraged financial structure employed alongside market volatility impacting earnings variability [F1].
Operating cash flow growth signals improving core business operations offsetting recurring operating losses reinforcing cash generation capability crucial for sustaining dividend streams without excessive reliance on external financing currently constrained by regulation-imposed borrowing thresholds [F1][S14].
Overall capital deployment emphasizes balancing growth investments within regulatory framework while cautiously managing liquidity buffers given potential for late-cycle credit deterioration requiring nimble capital responses.
Conclusion
Crescent Capital BDC navigates a complex confluence of strict regulatory constraints inherent in its BDC/RIC status alongside volatile investment outcomes characteristic of middle-market private credit lending. With established Crescent-originated deal sourcing power combined with rigorous risk mitigation protocols geared towards preserving principal value through collateral coverage and priority claim structures it holds appeal for investors seeking current income albeit layered with notable operational dependencies including management continuity risks.
The firm’s financial results over recent years reveal steady net gains amid challenging operating earnings landscapes sustained by effective cash flow metrics enabling consistent dividends though tempered buyback activity underscores prudent capital stewardship amidst leverage ceilings restricting flexibility.
Maintaining asset quality against rising systemic interest rate environments coupled with deft navigation of required borrowing covenants will likely determine CCAP's ability to sustain growth trajectories over coming periods alongside shareholder return potential tightly linked with adept capital markets access.
Potential investors should weigh visible strengths against concentrated risk exposures including legal/regulatory contingencies typical within this specialized finance domain.
This report synthesizes publicly available information as of February 26th, 2026 without offering investment advice.
Disclaimer: This is research-only, informational analysis and not investment advice. It may include AI-generated interpretation and general industry context. Always verify important details using primary sources.
Comments