
Community Banking Scale, Credit Quality, and the Stakes of Diversification at Capital City Bank Group
Capital City Bank Group posts stable profitability, strong capital ratios, and disciplined credit outcomes, but faces a shifting mix between interest and noninterest income as regional competition and macro headwinds test its expansion and diversification strategy.
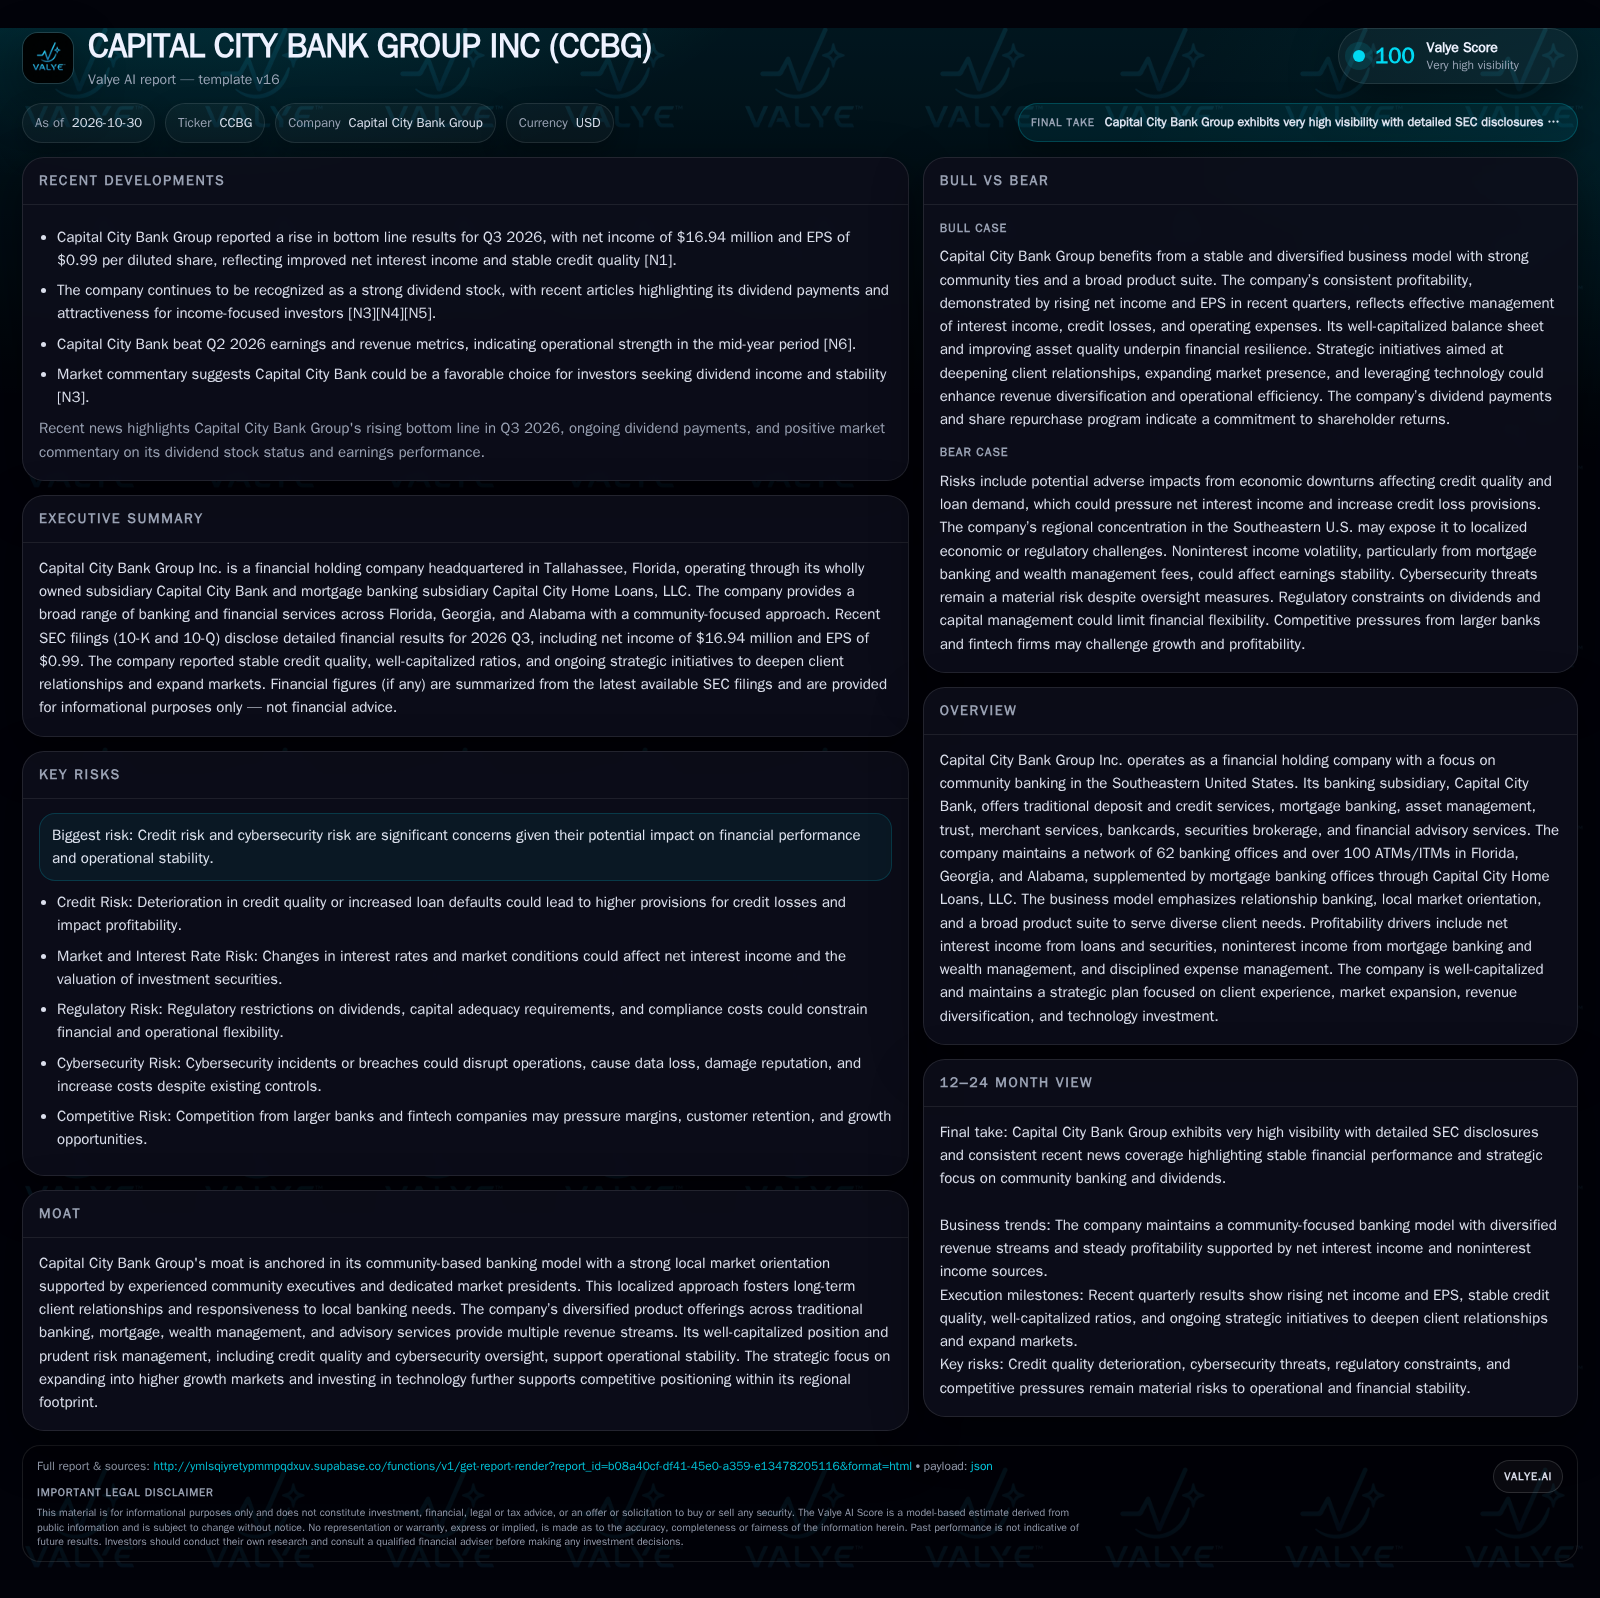
Capital City Bank Group reported net income of $16.94 million in Q3 2026, up sequentially and year-over-year, supported by modestly higher net interest income and lower credit loss provision. However, noninterest income—particularly from mortgage banking—declined meaningfully, offsetting some gains. The bank remains well-capitalized, with a risk-based capital ratio of 22.99% and a tangible common equity ratio of 11.25% at quarter-end. These results underscore the bank’s solid core franchise but highlight the need for successful diversification as traditional revenue streams face cyclical and secular pressure. [S2]
Capital City Bank Group’s latest quarter affirms the resilience of its community banking model, with steady profitability, robust capital levels, and continued credit discipline even as noninterest income declines. While margin management and low credit costs have offset cyclical headwinds in fee-based businesses, the company’s future trajectory hinges on its ability to diversify revenues and compete effectively in a consolidating regional landscape. Attention is shifting from mere stability to the sustainability of growth and returns as interest rate cycles, mortgage activity, and competitive dynamics evolve.
Recent Results Spotlight Profitability, Credit Quality, and Revenue Mix
Capital City Bank Group reported Q3 2026 net income of $16.94 million ($0.99 per diluted share), up from $16.27 million in Q2 2026 and $16.0 million in Q3 2025. Tax-equivalent net interest income reached $45.1 million, growing modestly on both a sequential and year-over-year basis, driven by higher income from loans and investment securities and lower deposit interest expense. The provision for credit losses was a $0.1 million benefit, a notable reversal from prior quarters, and nonperforming assets fell to $9.7 million, suggesting stable credit quality. However, noninterest income declined significantly, falling 5.9% from Q2 and 13.2% from Q3 2025, mainly due to weakness in mortgage banking and deposit fees. The company’s capital position remains robust, with a total risk-based capital ratio of 22.99% and tangible common equity at 11.25% as of September 30, 2026. [S2]
How Community Banking Economics Are Evolving for CCBG
Capital City Bank Group’s earnings model is anchored in net interest income, which is the spread between yield on loans and securities and the cost of deposits and other funding. This core spread business is subject to interest rate cycles: rising rates can boost asset yields but also raise deposit costs, while lower rates compress margins. In Q3 2026, net interest margin (FTE) stood at 4.42%, a healthy figure by regional bank standards, and the efficiency ratio was 65.63%, signaling disciplined expense management but leaving limited room for material margin expansion without revenue growth or further cost control. [S2]
Noninterest income provides diversification, but recent declines—primarily in mortgage banking—reflect both macro headwinds (such as lower home refinancing demand in a higher-rate environment) and structural pressure from digital competitors. The slight decrease in average loans held for investment also limits the ability to drive organic balance sheet growth. With robust capital ratios and a history of quarterly dividends, CCBG has potential financial flexibility, but sustainable profit growth will depend on expanding fee-based businesses, optimizing the branch network, and leveraging technology to deepen client relationships and cross-sell higher-margin services.
Regional Focus, Relationship Banking, and the Challenge from Larger Banks and Fintechs
CCBG’s competitive advantage is rooted in its community orientation, with experienced local executives and market presidents fostering long-term relationships and responsiveness to local needs. This model helps retain clients and supports cross-selling of products like wealth management and insurance. However, the Southeast U.S. banking market is crowded: larger regional and national banks offer broader digital capabilities and scale, while fintech entrants target high-yield deposits and transactional accounts with lower overhead.
The company’s broad product suite and multi-channel approach—including 62 full-service branches and nearly 30 mortgage offices—provide touchpoints across client segments, but physical branch traffic is declining industry-wide. CCBG’s ability to invest in technology and data analytics, while maintaining personal service, will be critical to defending its franchise and growing share in attractive markets. The question is whether its scale and resources are sufficient to keep pace with the technological and marketing investments of larger competitors, or whether selective M&A or partnerships will be needed to accelerate transformation.
If Revenue Diversification and Technology Investment Unlock New Growth
The most favorable trajectory for CCBG would involve successful expansion of fee-based businesses—such as wealth management, trust, and insurance—offsetting cyclical weakness in mortgage and transactional fees. If technology investments yield improved client engagement and cross-sell, CCBG could increase wallet share among existing clients and attract new households and small businesses, particularly in higher-growth Southeastern markets. Expansion into adjacent markets with favorable demographics could also drive incremental loan and deposit growth.
Confirmation would come from sustained growth in noninterest income (especially wealth and advisory fees), stable or rising loan balances despite industry headwinds, and evidence of client acquisition or retention outpacing regional peers. Margin stability or improvement, alongside declining efficiency ratios, would further support the upside case.
Stable Core Franchise, Modest Growth, and Dependence on Rate Cycles
The most plausible scenario is that CCBG maintains its core profitability and credit discipline, but growth remains modest as traditional banking margins and loan demand are pressured by macro and competitive forces. Net interest income is likely to fluctuate with rate cycles, while noninterest income may remain soft unless mortgage and deposit fee trends reverse or new sources of fee income gain traction.
In this scenario, capital ratios remain strong, supporting ongoing dividends and selective share repurchases. Confirmation would come from continued low credit losses, stable net interest margin, and steady (but not accelerating) core earnings. A lack of significant improvement in noninterest income or loan growth would reinforce the base case.
Credit Deterioration or Margin Compression Could Erode Stability
Adverse scenarios could be triggered by a sharp regional economic downturn, leading to rising nonperforming assets, higher credit loss provisions, and pressure on net income. Alternatively, if deposit costs rise faster than asset yields—due to aggressive competition for deposits or further rate volatility—net interest margins could compress, undermining profitability even without a spike in credit costs. Persistent declines in noninterest income, especially if mortgage or deposit fee businesses contract further, would add to the pressure.
Evidence for the downside would include a material increase in nonperforming assets, rising provision expense, sequential declines in net interest margin, and further erosion of fee-based revenues. Deterioration in capital ratios or a pause in dividends or buybacks would also signal stress.
Milestones That Will Determine Whether CCBG Can Sustain and Diversify Its Franchise
Quarterly trends in noninterest income, with particular focus on mortgage banking, wealth management, and deposit fee revenues.
Net interest margin movement relative to peer banks and deposit cost trends across the Southeast region.
Changes in average loans held for investment, especially in commercial and consumer segments, as an indicator of organic growth.
Provision for credit losses and trends in nonperforming assets, as markers of credit quality and risk discipline.
Efficiency ratio improvement or deterioration, indicating the success of expense management and technology investment.
Capital ratios and their trajectory, confirming the company’s capacity to absorb shocks or pursue expansion.
Branch and office network optimization—closings, consolidations, or new market entries—as evidence of strategic adaptation.
Client acquisition or retention rates (if disclosed), especially in new markets or business lines, to gauge competitive traction.
Disclaimer: This is research-only, informational analysis and not investment advice. It may include AI-generated interpretation and general industry context. Always verify important details using primary sources.

Comments