
COPT Defense Properties' Specialized REIT Model Balances Steady Leasing with Capital Deployment Tradeoffs
A focused portfolio serving U.S. defense tenants drives stable occupancy and incremental growth amid capital demands.
COPT Defense Properties (CDP) operates as a self-managed REIT specializing in highly secured real estate proximate to U.S. Government defense installations, predominantly comprising office properties and data center shells. The company’s moat centers on the critical mission-focused nature of its tenants, high-security requirements, and geographic concentration near government hubs. Despite modest revenue growth of 1.4% YoY in 2025, occupancy improvements and tenant retention remain strong headwinds supporting steady cash flows. CDP faces challenges in managing significant near-term debt maturities and capital expenditures related to development projects, balanced by ample liquidity and investment grade ratings. Its returns illustrate conservative profitability metrics consistent with the specialized REIT space, with an approximate 0.9% ROE in 2025 and a sub-50% FFO payout ratio allowing dividend sustainability and reinvestment capacity.
Company Profile and Market Positioning
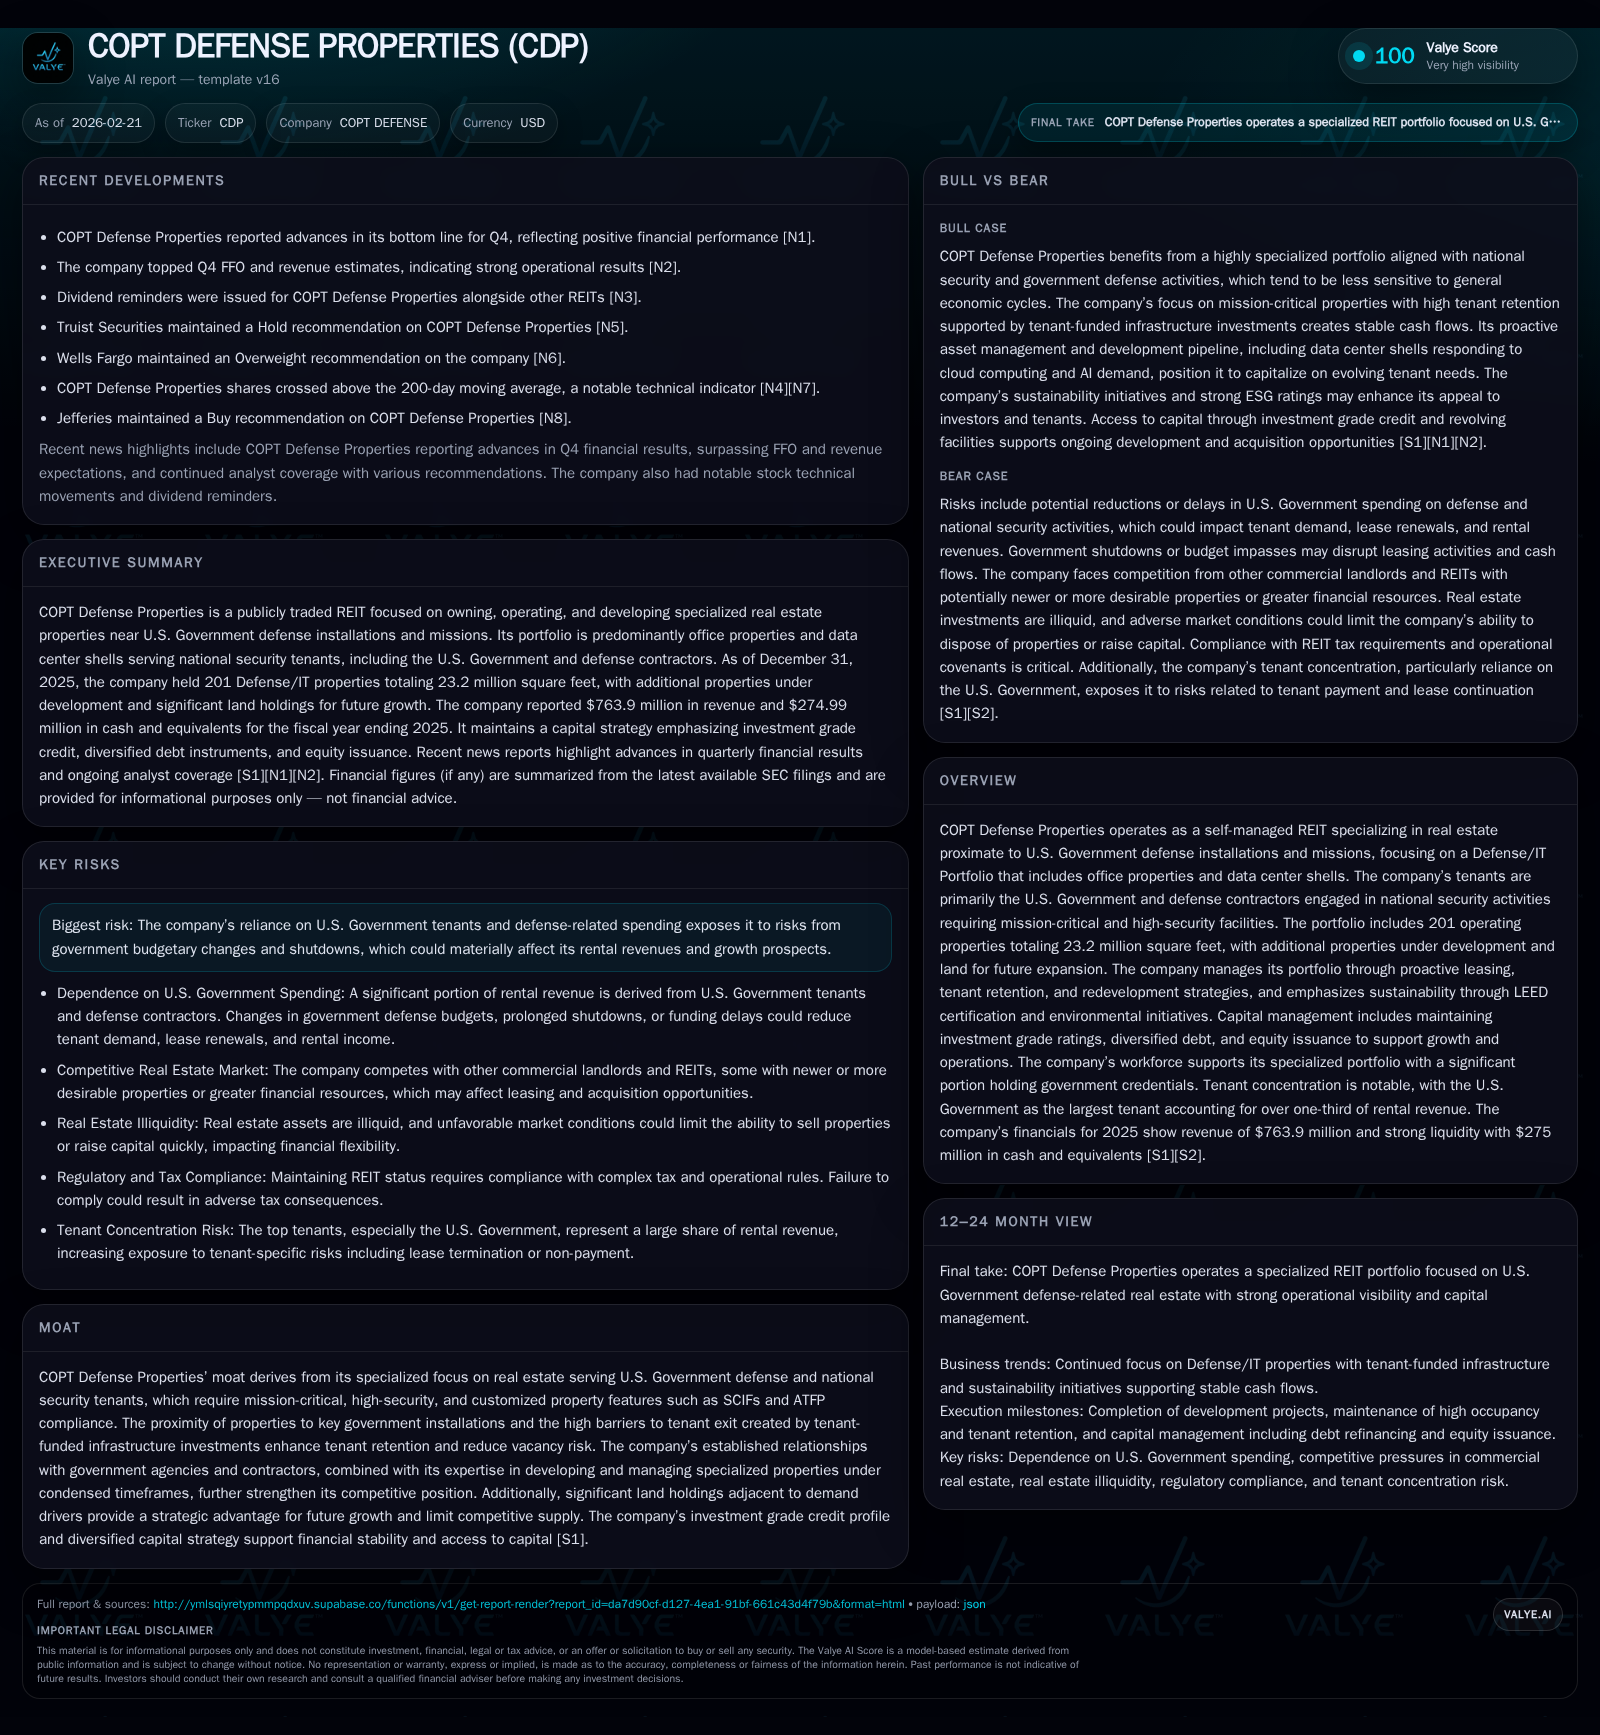
COPT Defense Properties operates as a self-managed real estate investment trust concentrated almost exclusively on servicing the U.S. Government defense sector and associated contractors [S1]. Its portfolio is strategically located proximate to major defense installations and commands high-security property features such as Sensitive Compartmented Information Facilities (SCIFs) and Anti-Terrorism Force Protection (ATFP) compliance [S14]. This specialization creates significant barriers to tenant exit because investments are often tenant-funded and bespoke to mission-critical needs.
As of December 31, 2025, CDP manages a substantial Defense/IT Portfolio comprising about 201 operating properties totaling approximately 23.2 million square feet—92.1% of total square footage—and derives ~90% of its annual rent from this segment [S1]. The remaining portfolio includes six office properties in the Greater Washington DC/Baltimore area, which management intends to divest when market timing is favorable [S1].
Historical Performance and Growth Drivers
Revenue & Occupancy Trends
Over the past four years, CDP’s revenue has shown steady albeit moderate growth: revenue increased from approximately $685 million in FY2023 to $764 million in FY2025—a compound increase aligned closely with inflationary rent escalations within high-quality commercial real estate markets [F1]. Despite some fluctuations in net income due partially to nonrecurring items and timing issues with government payments, the operating cash flow has remained comparatively robust at nearly $310 million in FY2025, although this was down slightly from prior year levels.
Occupancy levels reflect the specialized nature of the tenant base rather than traditional commercial cyclicality: the total portfolio occupancy reached a commendable 94.0%, while the Defense/IT Portfolio—driving nearly all economic performance—stood even higher at approximately 95.5%, both improvements over year-end 2024 [S1]. This continued strength attests to the essential nature of leased assets within national security missions.
Tenant retention rates reinforce portfolio resilience; within the Defense/IT segment retention averaged near 79%, marking ten consecutive years above a minimum threshold of approximately 75%. Furthermore, rental rate increases on renewed leases averaged roughly +2.7% for cash rents annually [S1], underscoring modest but consistent rent momentum despite government budgetary pressures.
Historical performance (annual)
| FY | Rev ($mm) | CFO ($mm) | Rev YoY |
|---|---|---|---|
| 2025 | 764 | 310 | +1.4% |
| 2024 | 753 | 331 | +10.0% |
| 2023 | 685 | 276 | -7.3% |
| 2022 | 739 | 266 |
Note: Omitted columns lack sufficient annual XBRL coverage in the provided tags (need ≥2 annual points): Net, OpInc, Capex, Buybacks, FCF, ROE%. Source: SEC companyfacts cache [F1].
Capital returns and efficiency (annual)
| FY | Div ($mm) |
|---|---|
| 2025 | 137 |
| 2024 | 132 |
| 2023 | 127 |
| 2022 | 124 |
Source: SEC companyfacts cache [F1].
Note: Operating income data not fully available for recent years; Capex figures not tagged.
External Growth Strategy
CDP emphasizes external growth via new developments adjacent to existing demand drivers and selective acquisitions that reinforce their dominant position within key suburban business parks surrounding defense hubs [S15]. For instance, during 2025 they placed into service nearly half a million square feet of fully-leased newly developed space across three properties and committed capital to several additional projects amounting to approximately half a million square feet, mostly pre-leased (three out of four developments were fully pre-leased) [S1].
Data center shells represent a growing sub-segment driven by long-term leases with major Fortune 100 cloud computing tenants who invest heavily in build-out costs post-delivery—a model that improves asset value while maintaining predictable rental streams due to triple-net lease structures [S14]. Northern Virginia remains the central hub for these data center assets due to its fiber connectivity infrastructure and power reliability critical for AI workloads.
Capital Structure and Liquidity
Entering 2026, CDP’s liquidity position remains strong:
- Cash on hand totaled approximately $275 million at year-end 2025,
- An expanded Revolving Credit Facility offers $800 million capacity (with ~$746 million available), maturing October 2029,
- A newly introduced Revolving Development Facility adds another secured $200 million capacity dedicated primarily for ongoing property development [S4][S5][S6][S10].
Despite this liquidity cushion, the company faces substantial debt maturities within calendar year 2026 approximating $445 million—including a notable $400 million bond maturing March 2026—which it plans either to repay using proceeds raised from recent note issuances at improved interest rates or refinance drawing upon existing revolver capacity [S9][S10]. The strategy aims to maintain an investment grade profile while managing interest costs prudently.
CDP’s debt is primarily unsecured fixed-rate with no significant variable-rate exposure post expiration of interest rate swaps earlier in February 2026, further insulating it from rising interest rates [S10]. Approximately only about five percent of debt is encumbered by property-level liens.
The company maintains multiple financial covenants around leverage, interest coverage ratios, net worth minimums, etc., which were all complied with as of the latest reporting period [S4][S12]. Any adverse rating downgrade could increase borrowing costs given spreads tied to credit ratings but current outlooks remain stable or positive across rating agencies.
Returns Profile & Capital Allocation Priorities
Reported net income volatility partly reflects timing variances linked with governmental payment schedules rather than operational weakness alone—evidenced by relatively steady funds from operations (FFO). Diluted FFO per share increased from $2.57 in FY2024 to $2.72 in FY2025 measured as adjusted comparability metrics indicate operational stability alongside controlled expenses [S19][F1].
CDP’s approximate return on equity is estimated near ~0.9%, signifying lower net income generation relative to equity base but consistent with mature specialized REIT models where asset appreciation accrues over longer holding periods rather than short-run earnings spikes [F1].
Dividend payments continue their gradual rise aligning with FFO growth—$136.6 million paid out in FY25 versus $131.8 million prior year—with a FFO payout ratio remaining below ~45% allowing retained cash flow for ongoing capex commitments related largely to tenant improvements and new development placements [F1][S19][S20]. The dividend policy ensures compliance with REIT distribution rules while balancing growth capital needs.
Share repurchase activity has been minimal recently reflecting capital preservation focus amid heavy development spend.
Industry Context & Competitive Moat Considerations
Unlike typical office REITs grappling with secular headwinds such as remote work trends depressing demand, CDP benefits materially from its mission-critical government-related tenancy base where remote work adoption is limited by security protocols requiring onsite presence . This bolsters occupancy durability.
High tenant customization—from SCIF buildouts and hardened infrastructure—alongside proximity requirements near federal hubs create formidable entry barriers dissuading potential competitors from capturing market share or triggering tenant churn [S14][S24]. Moreover, tenants’ substantial investments in fit-out lead to “stickier” leases implying low vacancy turnover risk relative to comparable suburban/submarket office portfolios.
However, dependence on federal defense spending imparts risk: budget volatility or government shutdowns can delay leasing activity or defer rents temporarily; also shifts toward government ownership rather than leasing could impede long-term growth prospects [S17][S26].
Acquisition pipeline opportunities hinge heavily on land availability contiguous to existing holdings—a notable strength thanks to 1,000 acres controlled (10+ million sq ft developable area)—providing scalability unmatched by many peers yet requiring disciplined capital deployment given long development timelines [S1][S15].
Outlook: Catalysts & Monitoring Points
Explicit company guidance centers around maintaining occupancy ratios near historical highs (>93%), advancing development completions especially data center shells suited for cloud expansion demand drivers, and deftly navigating debt maturity schedules without impairment compromises [N1][N2][S1].
Key catalysts include timely lease renewals under increasing pricing power enabled by constricted vacancy levels and effective capital recycling through selective divestitures pairing acquisition/development pipeline fills.
Watch points:
- Successful refinancing or repayment execution of sizable upcoming maturities scheduled for mid-2026,
- Leasing absorption velocity particularly in newly developed spaces,
- Government funding trajectory impacting contract awards or renewals,
- Any regulatory shifts altering secured-space standards requiring additional capex.
In summary, COPT Defense Properties occupies a niche within real estate markets combining defensive revenue characteristics stemming from national security tenancy demands against significant capital intensity driven by bespoke buildouts and ongoing development programs—presenting a balancing act between steady recurring cash flows versus heightened reinvestment necessities.
Disclaimer: This report is prepared solely for informational purposes based on publicly available documents including SEC filings and news sources cited herein; it does not constitute investment advice or recommendations regarding any securities discussed.
Disclaimer: This is research-only, informational analysis and not investment advice. It may include AI-generated interpretation and general industry context. Always verify important details using primary sources.
Comments