
Carlyle Secured Lending's Earnings Slip Reflects Shifts in Credit and Cash Flow Dynamics
Recent earnings decline and cash flow volatility underline material changes in Carlyle Secured Lending’s credit environment and portfolio quality.
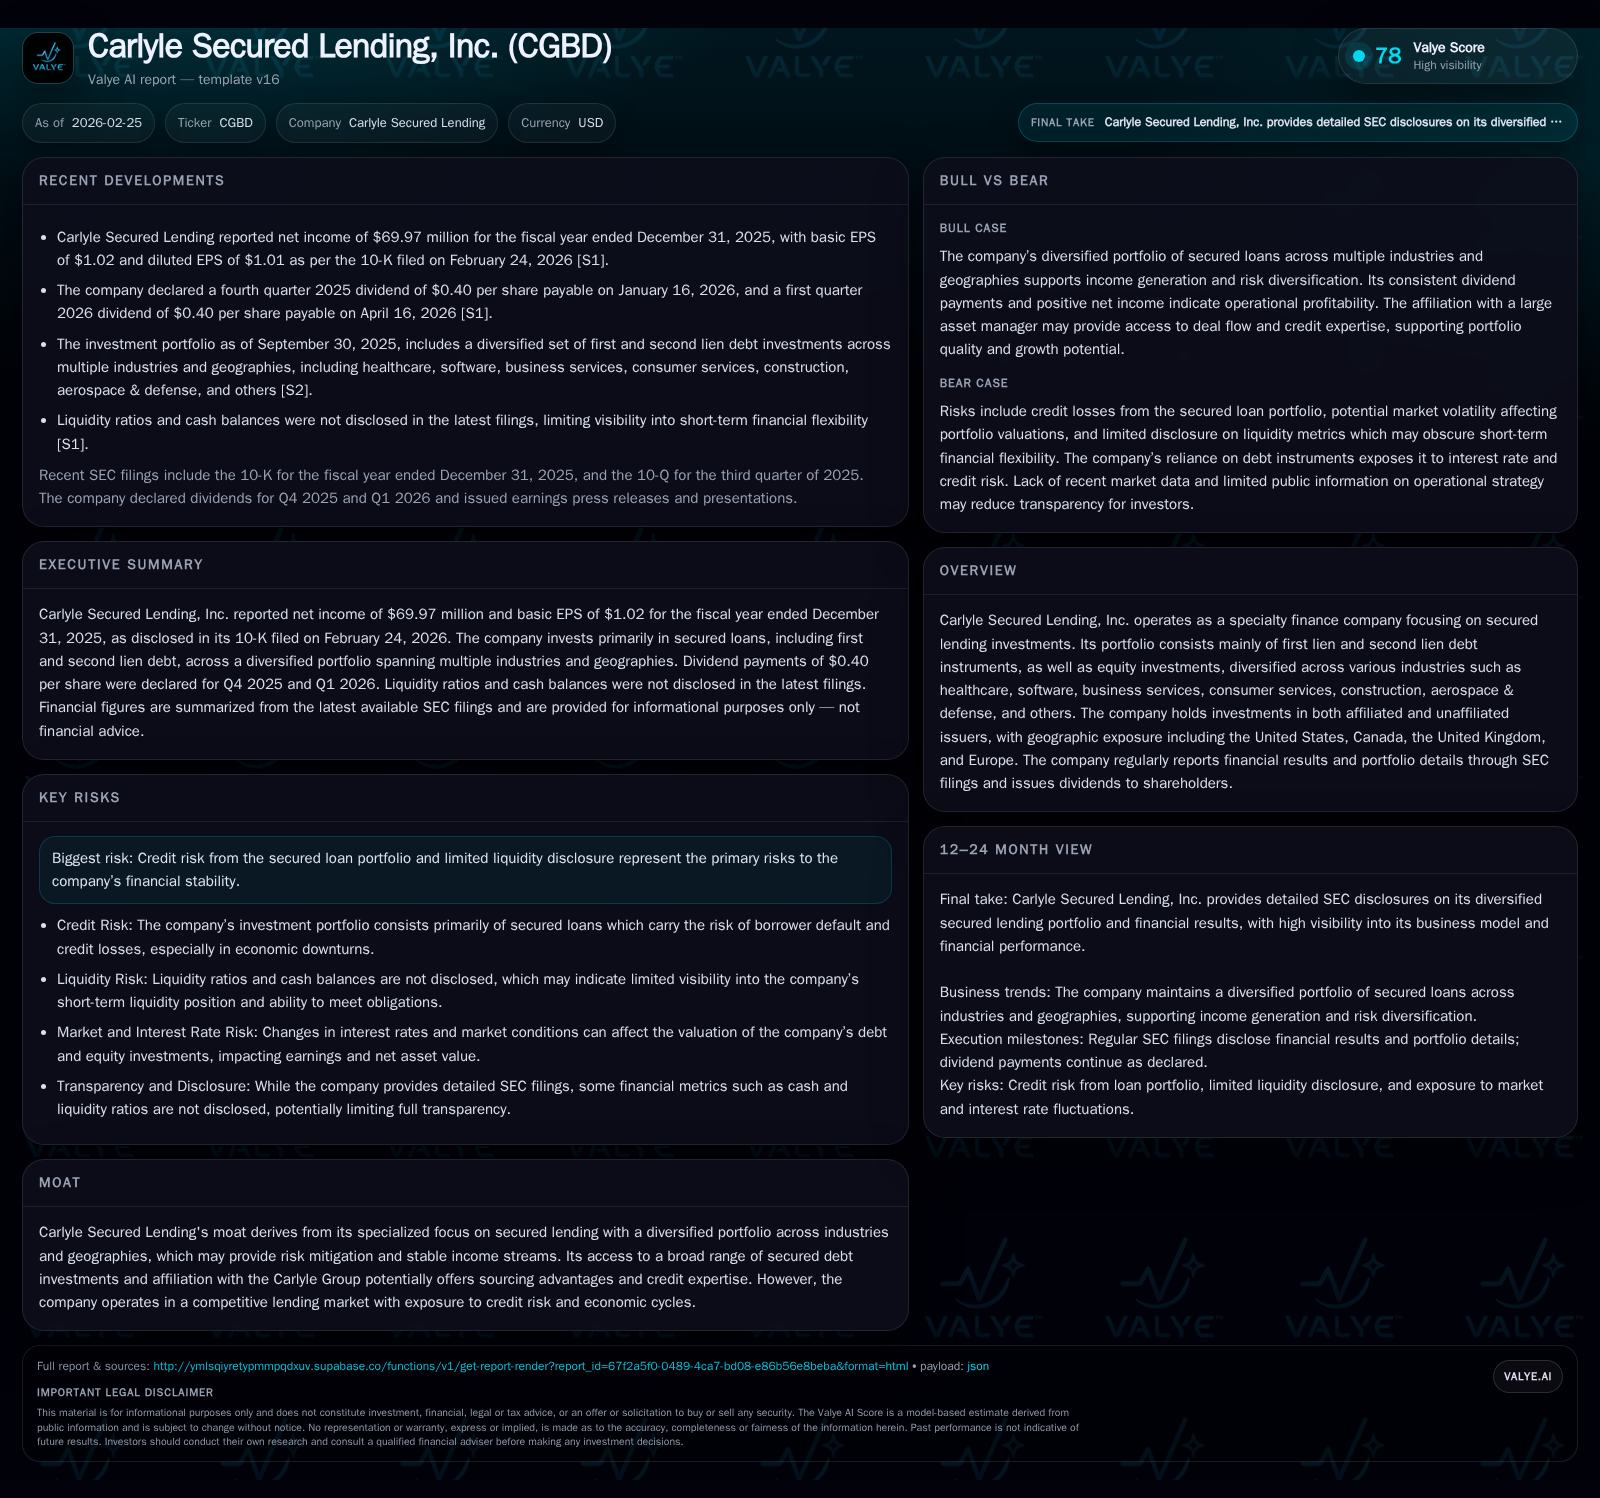
Carlyle Secured Lending, Inc. (CGBD) reported a notable drop in net income over the 2023–2025 period, culminating in a 21.4% year-over-year decline in 2025. This deterioration aligns with deteriorating credit spreads and loan repricing pressures within its secured lending portfolio. Concurrently, operating cash flows swung sharply negative in 2025, reflecting liquidity strains common to revolver- and delayed draw-heavy loan structures amid credit market tightening. The company's diversified portfolio across first and second lien debt sectors including healthcare, software, and aerospace faced mounting credit risk headwinds. While dividends rose steadily, buyback activity was limited and inconsistent, contributing to an approximate 6% ROE that signals constrained capital returns given the risk profile. Looking ahead, growth prospects appear capped by macroeconomic caution and portfolio credit challenges, with quarterly cash flow dynamics and capital structure updates poised as key monitoring points.
Historical Earnings Evolution and Portfolio Drivers
Carlyle Secured Lending has experienced a challenging earnings trajectory over recent years, with net income declining from $92.3 million in fiscal year 2023 to $69.9 million by the end of 2025—a significant 21.4% year-over-year drop for the latest period reported [F1]. Fourth quarter results notably missed consensus estimates on both earnings and revenues, highlighting pressures within its secured lending investment portfolio [N1][N5].
Earnings are primarily derived from interest income generated by a diversified pool of first lien and second lien debt instruments. However, recent widening credit spreads due to macroeconomic volatility and loan repricing challenges have compressed yields on these assets. Such compression directly impacts interest income margins critical for a fund investing predominantly in floating-rate secured loans. Additionally, rising non-accruals or impairments linked to underperforming portfolio companies may further weigh on net income trends.
Competitive tension in specialty finance markets also challenges the sourcing of higher-spread opportunities—a space where Carlyle leverages its affiliation with the broader Carlyle Group credit platform but remains exposed to market rate shifts and borrower stress scenarios.
Historical performance (annual)
| FY | Net ($mm) | CFO ($mm) | Net YoY |
|---|---|---|---|
| 2025 | 70 | -205 | -21.4% |
| 2024 | 89 | 104 | -3.6% |
| 2023 | 92 | 231 | +7.8% |
| 2022 | 86 | 15 |
Note: Omitted columns lack sufficient annual XBRL coverage in the provided tags (need ≥2 annual points): Rev, OpInc, Capex, FCF. Source: SEC companyfacts cache [F1].
Capital returns and efficiency (annual)
| FY | Div ($mm) | Buybacks ($mm) | ROE% |
|---|---|---|---|
| 2025 | 104 | 14 | 6.0 |
| 2024 | 96 | 0 | 9.8 |
| 2023 | 93 | 4 | 10.1 |
| 2022 | 87 | 28 | 9.3 |
Source: SEC companyfacts cache [F1].
Note: Revenue and operating income data are not available from provided tags; figures compiled from company XBRL filings [F1].
Operating Cash Flow Volatility: Causes and Implications
Operating cash flow swung dramatically into negative territory at -$204.6 million in FY2025 compared with a strong positive $230.6 million two years prior—indicative of operational liquidity constraints tied to the loan portfolio servicing model [F1]. This volatility is common among specialty lenders reliant on revolvers and delayed draw facilities embedded within their asset base.
Revolving credit lines extended to borrowers can cause timing mismatches between interest collections and principal repayments—especially when borrower draw patterns differ from expectations or when collections slow amid weak segments [S2]. Negative CFO reflects potential increases in working capital components such as accrued interest receivable or slowed inflows against ongoing expenses.
Managing covenant compliance triggers within revolving agreements alongside maintaining adequate liquidity buffers through undrawn revolvers or alternative capital sources is crucial for navigating episodic funding strain [S4][S8].
Credit Risk and Portfolio Composition Across Industries
The portfolio is strategically weighted toward first lien debt supplemented by second lien positions and selective equity investments diversified across healthcare, software, business services, consumer services, construction & building, aerospace & defense among others [S1][S7]. This multi-sector approach aims to mitigate idiosyncratic shocks while capturing yield premiums across varied credit profiles.
Geographically, exposure extends beyond U.S.-centric credits into Canadian, U.K., and broader European issuers—adding currency risk overlays combined with regulatory complexity impacting credit assessments [S12].
SEC filings emphasize ongoing credit risk concerns driven by issuer performance variability and economic cycle sensitivity inherent to leveraged loan portfolios [S7]. While first lien protections offer seniority benefits, concentrated default risk persists if sector fundamentals weaken or leverage rises unsustainably.
Industry-specific factors include healthcare’s demand resilience albeit sensitive to reimbursement changes; technology/software loans facing valuation pressures amid slower growth; aerospace & defense contending with cyclical budget adjustments—all layering risk gradients within the overall portfolio.
Liquidity, Capital Structure, and Debt Profile
Liquidity management centers on revolving credit facilities with borrower access via delayed draw features—a typical structure allowing flexible funding aligned with operational needs but requiring rigorous monitoring under tightening conditions [S4][S9]. Filings show active revolver utilization across non-affiliated issuer loans spanning healthcare tech firms to consumer services providers.
While detailed leverage metrics are not explicitly disclosed here, standard sector analysis suggests attention to covenant bundles balancing lender protections without constraining opportunistic redeployment—covenant-lite tranches increasingly prevalent yet demanding careful asset quality maintenance to avoid shocks.
Senior unsecured notes also support corporate operations though exact tranche maturities remain unspecified; this layer complements secured lending assets enabling funding diversification fundamental for treasury stability [S8][S10].
Dividend Policy, Share Buybacks, and Shareholder Returns
Dividends steadily increased from $86.8 million (2022) to $104 million (2025), reflecting commitment toward shareholder distributions despite narrowing profitability margins [F1]. Conversely, share repurchase activity was irregular: zero buybacks executed in FY2024 contrasted with modest repurchases of $13.9 million in FY2025 after minimal prior levels.
Return on equity calculated using net income (~$69.97 million) over shareholders' equity ($1.167 billion) yields approximately a 6% ROE—a moderate capital efficiency figure relative to inherent loan book risks [F1]. This indicates dividends form a stable shareholder value component while retained earnings reinvestment or buyback programs remain conservative amid portfolio uncertainty.
Outlook: Growth Prospects Facing Macroeconomic and Market Limitations
Company commentary signals caution around anticipated further pressure on future earnings—as previews forecast declines—and macroeconomic factors constraining secured lending volume expansion [N3][N1]. Persistent credit risk concerns detailed within SEC disclosures suggest underwriting flexibility will remain tempered amidst competitive sector dynamics [S7].
Growth trajectories could stay restrained absent significant cyclical improvements or repositioning toward higher-margin asset classes given slower borrower refinancing activity alongside pricing compression especially within lower middle market credits where many portfolio companies reside.
Key Financial Milestones to Monitor in Upcoming Quarters
Market watchers should focus on forthcoming quarterly earnings releases per Form 8-K filings alongside associated call presentations following fiscal year-end disclosures [N1][S3]. Monitoring quarterly operating cash flow swings remains critical given recent volatility plus updates on capital structure amendments or new deal originations influencing leverage metrics.
Attention should also be paid to any dividend policy shifts or buyback cadence changes reflecting management’s view on free cash flow sustainability amid contested credit environments.
Qualitative disclosures around loan loss reserves adjustments or impairment recognitions tied to volatile industries will serve as early indicators for longer-term earnings stabilization prospects.
This analysis is based solely on publicly available information as of February 2026 without any recommendation expressed or implied regarding securities of Carlyle Secured Lending, Inc.
Disclaimer: This is research-only, informational analysis and not investment advice. It may include AI-generated interpretation and general industry context. Always verify important details using primary sources.
Comments