
Comstock Holding Companies Advances Fee-Based Growth Through Anchor Portfolio
Q1 2026 results highlight expanding recurring fee revenue driven by asset management and property services within the strategically located Anchor Portfolio.
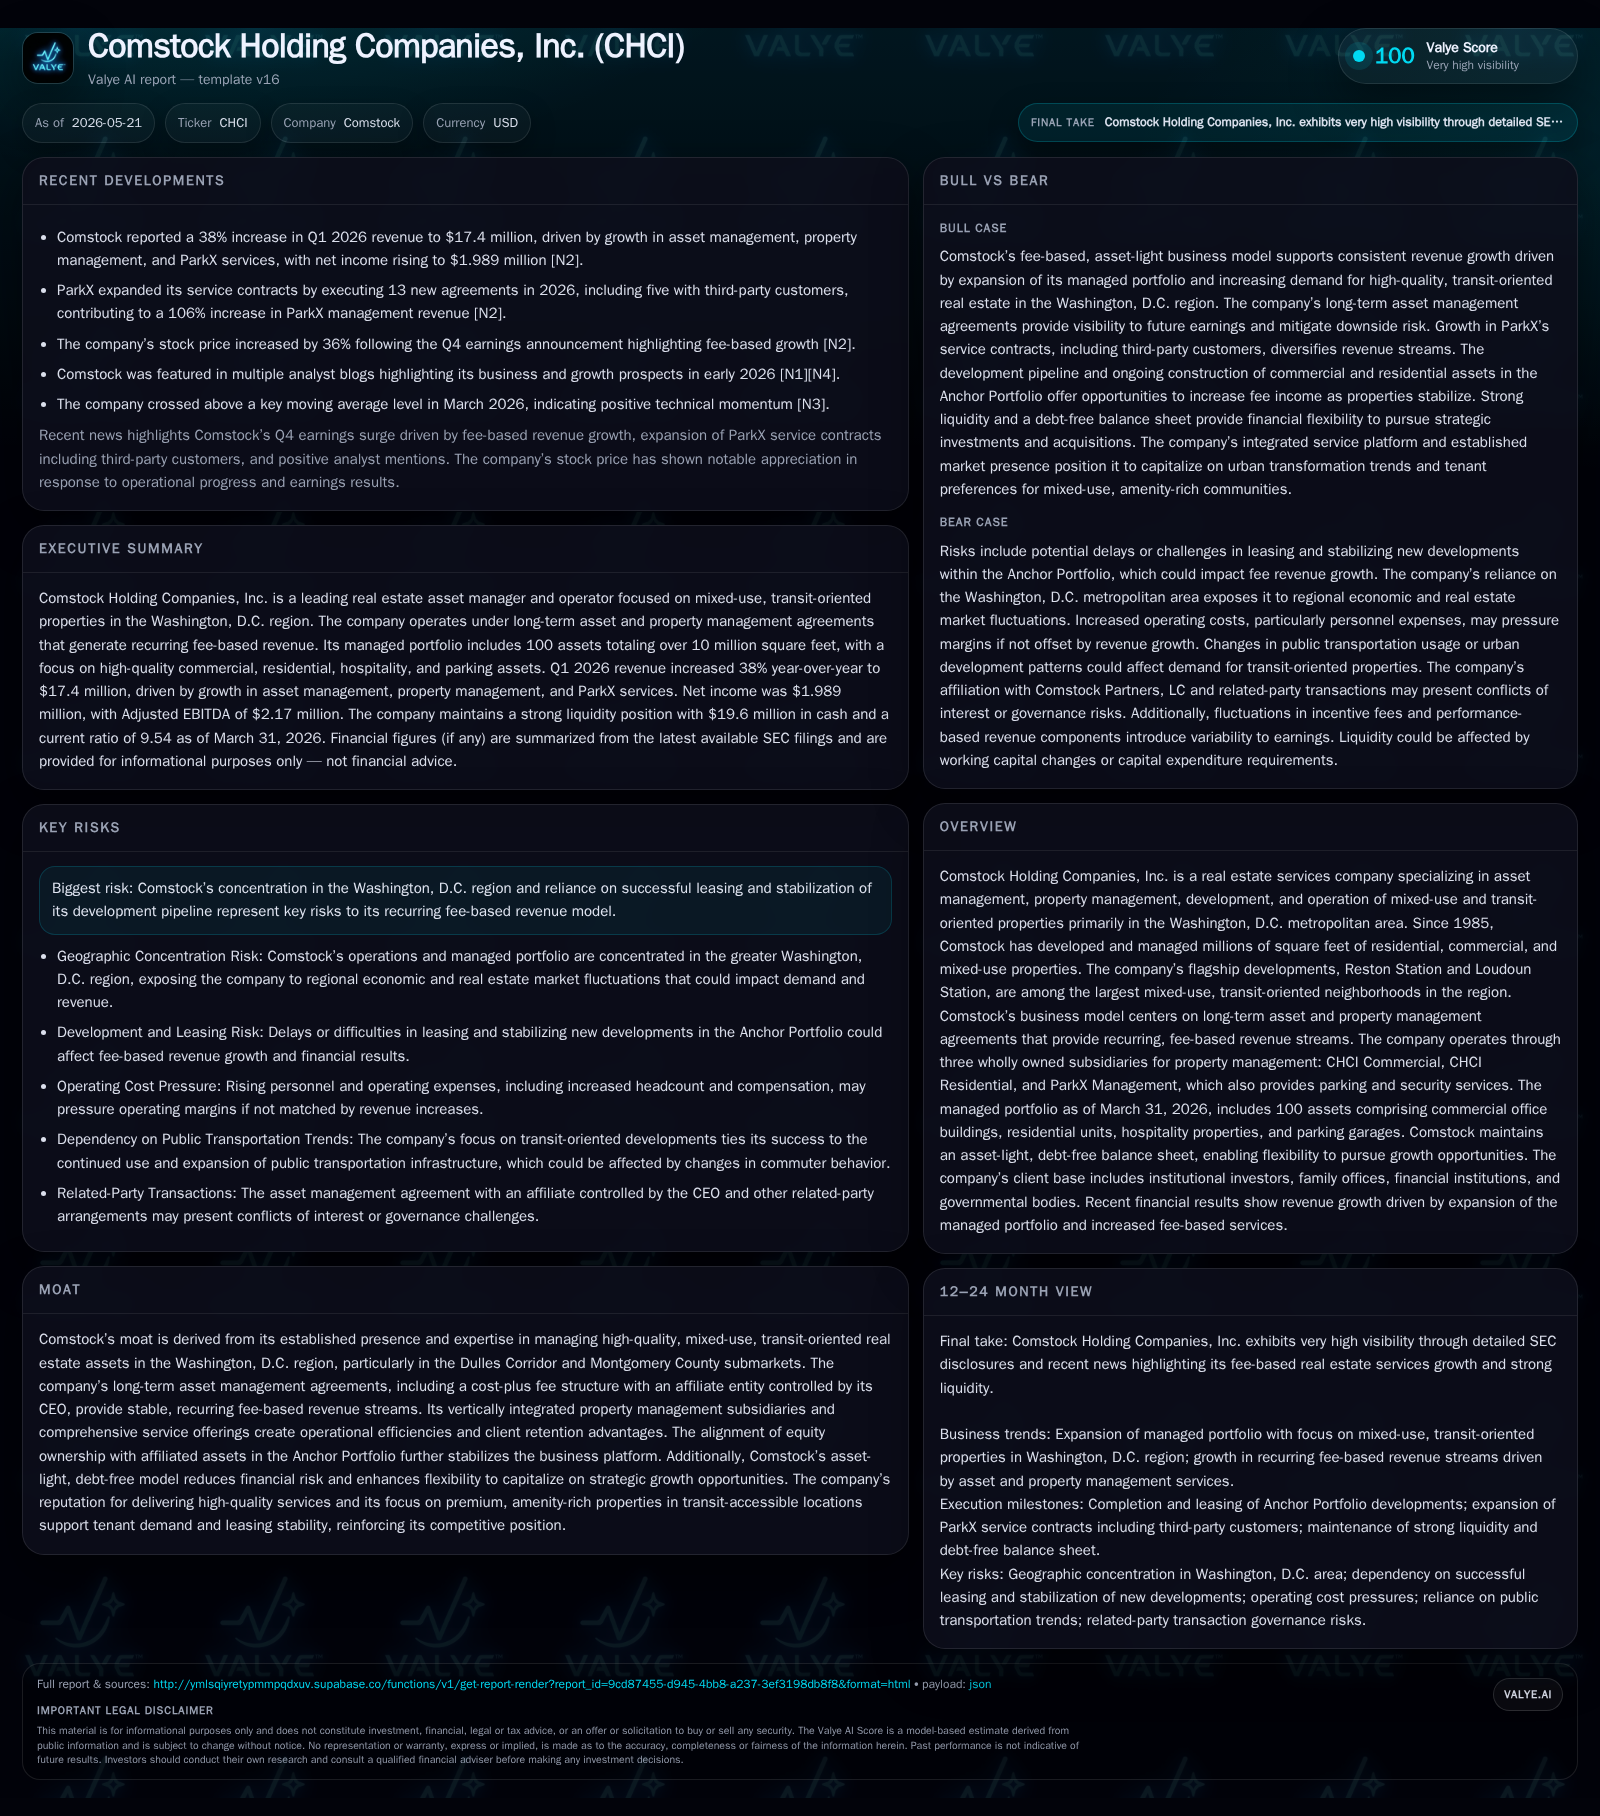
Comstock Holding Companies, Inc. posted a 38% revenue increase in Q1 2026, fueled by growth across its asset management and property management subsidiaries, including ParkX’s rapid contract expansion. The company’s stable, asset-light business model centers on long-term, cost-plus agreements tied to its Anchor Portfolio of transit-oriented mixed-use developments in the Washington, D.C. metro area. Comstock’s vertical integration and focused geographic footprint underpin its competitive moat. Key growth drivers include lease-up progress and supplemental fee opportunities, while geographic concentration and leasing cycles remain principal risks. Liquidity remains strong with a net cash balance and adjusted EBITDA edging higher year-over-year.
Recent Quarterly Operating Trends Bolster Stability
In the first quarter of 2026, Comstock Holding Companies exhibited strong operational momentum marked by a significant revenue increase of 38% over the prior year’s quarter to $17.4 million [S2]. This uptick was largely propelled by substantive gains at ParkX Management, which more than doubled its revenue contribution through the addition of thirteen new service contracts—five with third-party clients—demonstrating an aggressive commercial expansion beyond Comstock’s core portfolio [S2]. Asset management revenues also grew over 22% year-on-year to $8.8 million, while recurring fee-based property management revenues (combining residential and commercial segments) rose nearly 16%, reflecting both organic growth and portfolio expansion.
Adjusted EBITDA improved modestly to $2.17 million but was pressured by elevated personnel costs, notably a $0.9 million increase in bonus accruals and nearly doubling of stock-based compensation expenses indicating a strategic focus on talent retention [S2]. Gains from equity investments totaling $0.44 million further bolstered non-operating income for the period.
Portfolio assets such as The Hartford building adjacent to Clarendon Station (Orange Line) and BLVD Forty Four near Rockville Metro (Red Line) continued operations within joint ventures with affiliated partners, augmenting Comstock’s diversified yet regionally concentrated property mix [S2]. These mixed-use transit-adjacent properties underscore Comstock’s strategy of integrating premium real estate developments anchored around metro infrastructure.
Business Model: Fee-Based Revenue Anchored by Long-Term Agreements
Comstock operates on an asset-light business model that revolves around long-term asset management agreements designed to generate recurring fee income insulated from typical ownership risks [S1]. The keystone of this platform is the 2022 Asset Management Agreement (AMA) with Comstock Partners LC, an affiliate controlled by CEO Christopher Clemente. This agreement employs a cost-plus fee structure supplemented by performance-based incentives tied to property stabilization milestones within the Anchor Portfolio [S1].
This structure aligns interests between Comstock and affiliated owners through direct equity stakes in managed assets while providing a baseline fee that drives stable top-line visibility [S1]. The portfolio-wide AMA streamlines operations across millions of square feet comprising Class A office towers, luxury multi-family units, hospitality components like branded residences, retail outlets, and large-scale parking facilities.
Complementary to asset management are market-rate property management agreements executed via its wholly owned subsidiaries: CHCI Commercial manages office and commercial real estate; CHCI Residential covers multifamily residential properties; ParkX Management handles parking services alongside janitorial/security offerings [S1], [S2]. These vertically integrated services enhance operational control, cost efficiency, and client retention while diversifying fee sources.
Portfolio Composition and Property Management Subsidiaries
As of December 31, 2025, Comstock managed a sizable portfolio featuring approximately 4.6 million square feet combined across commercial (87% leased in stabilized assets) and residential properties (93% leased), complemented by a boutique hospitality asset exceeding 290,000 square feet [S1]. The Anchor Portfolio centers on flagship developments—Reston Station and Loudoun Station—each representing some of the largest transit-oriented mixed-use neighborhoods in Northern Virginia's Dulles Corridor.
The Hartford represents a premier office tower presence within Arlington's Ballston Corridor submarket, whereas BLVD Forty Four offers luxury multifamily housing proximate to Rockville Metro [S1], [S2]. These assets benefit from strategic adjacency to public transit corridors enhancing tenant appeal and leasing velocity.
ParkX complements these holdings with a growing platform managing over 26,000 parking spaces plus ancillary security services across multiple facilities [S1], underscoring Comstock's comprehensive offering spectrum that spans beyond traditional property management into facility logistics.
Competitive Positioning in Washington D.C.'s Transit-Oriented Real Estate Market
Comstock's long-established presence since 1985 within Northern Virginia's critical submarkets such as the Dulles Corridor confers strong competitive moats rooted in deep regional expertise and entrenched relationships [S1]. Its stewardship over transit-oriented developments aligns well with increasingly urbanized commuter preferences benefiting dense metro-adjacent living/work environments.
The cost-plus asset management agreement framework with aligned equity stakes provides significant switching costs for clients given the firm handles both strategic oversight (asset-level financial/operational optimization) and day-to-day property operations through subsidiaries [S1]. This level of vertical integration delivers operational synergies difficult for newer entrants or smaller local competitors lacking scale or comprehensive service offerings.
Regulatory support for transit-oriented development initiatives in the region further anchors demand dynamics favorably for Comstock’s niche specialization.
Growth Drivers: Portfolio Expansion and Supplemental Fee Opportunities
Future growth is predominantly tied to progressing lease-up rates within large newly developed mixed-use projects embedded in the Anchor Portfolio where stabilization phases unlock both base fees and incentive revenues linked to valuation inflection points under the cost-plus AMA [S1], [S2]. Increased occupancy translates into higher recurring fees from both asset management contract provisions and associated market-rate property management agreements.
ParkX’s recent leap reflects successful penetration into third-party markets beyond affiliated portfolios offering potential acceleration via cross-selling bundled services including parking operations coupled with security/maintenance contracts.
Incremental development projects such as affordable housing ventures subject to recent rezoning approvals expand serviceable addressable markets along complementary lines involving construction management transitioning into ongoing property operations [S14], [S17].
KPIs likely to serve as forward indicators encompass occupancy stability percentages reported for commercial/residential blocks alongside renewal rates within ParkX service contracts.
Risk Factors: Geographic Concentration and Leasing Dynamics
Comstock remains geographically concentrated exclusively within the Washington metropolitan area—specifically key transit corridors—which could amplify localized economic downturns or regulatory shifts impacting real estate demand [S1], [S2]. While specialization yields competitive advantages it narrows diversification buffers potentially increasing earnings volatility during sector slowdowns.
Leasing cycles represent another vulnerability; slower-than-expected tenant absorption or unexpected vacancies at newly delivered assets may reduce incentive fees materially given their contingent nature based upon asset valuation milestones being realized without reversal risk [S1]
Dependency on key affiliated joint venture entities underpins much of its recurring revenue base; hence any disruptions or conflicts there could threaten contract continuity or margin structures.
Nonetheless, Comstock's debt-free balance sheet mitigates financial leverage risks allowing swift adjustments should adverse conditions emerge [F1], [S2].
What Investors Should Monitor Next
Market participants should watch quarterly lease-up progress tracking occupancy improvements at large-scale Anchor Portfolio developments along with milestone completions triggering incentive fees under established AMA terms [S2], [S3]. Further contract wins or expansions at ParkX provide early signals regarding successful external market penetration beyond captive assets causing sustainable revenue diversification.
Updates regarding additional third-party property management engagements or joint ventures paralleling affordable housing construction projects will indicate expansion trajectories into adjacent growth verticals within metropolitan real estate services sectors [S14], [S17]. Personnel cost trends observed through selling general & administrative expenses linked to bonus accruals may also temper profitability outlooks if unmanaged.
Lastly, shifts in local land use policy or public transit enhancements influencing underlying demand patterns warrant close monitoring given foundations of Comstock's value proposition rest upon transit-proximate mixed-use development attractiveness.
Concise Financial Synopsis
The company ended Q1 2026 with net income of approximately $2.0 million compared with $1.6 million the prior year quarter reflecting healthy operating gains amid rising compensation costs [S2]. Adjusted EBITDA showed modest improvement to $2.17 million attributable mainly to expanded fee-generating activities despite increased stock-based compensation outlays rising from $0.25 million last year to $0.55 million currently underscoring investments in workforce capabilities
Cash and equivalents stood at about $19.6 million against current liabilities near $4.6 million delivering an exceptional current ratio exceeding 9x signaling robust liquidity positioning able to absorb working capital fluctuations without recourse to borrowing facilities which remain undrawn up to $10 million availability per recent disclosures [F1], [S2]. Total debt carries a small balance last reported at $5.5 million back in late 2021 indicating a largely net cash posture supportive of strategic flexibility.
Overall financial health complements an asset-light platform designed for resilience while empowering measured growth through recurring revenue expansion rather than capital-intensive ownership risk exposures.
This analysis is based solely on publicly available filings as referenced without offering investment advice or forecasts concerning future performance outcomes.
Disclaimer: This is research-only, informational analysis and not investment advice. It may include AI-generated interpretation and general industry context. Always verify important details using primary sources.

Comments