
Comcast's Multi-Segment Connectivity and Content Strategy Faces Subscriber Pressures and Capital Demands
Second-quarter 2026 results show growth in wireless lines, declines in broadband and video customers, and sustained capital investment across Comcast’s diversified media and technology portfolio.
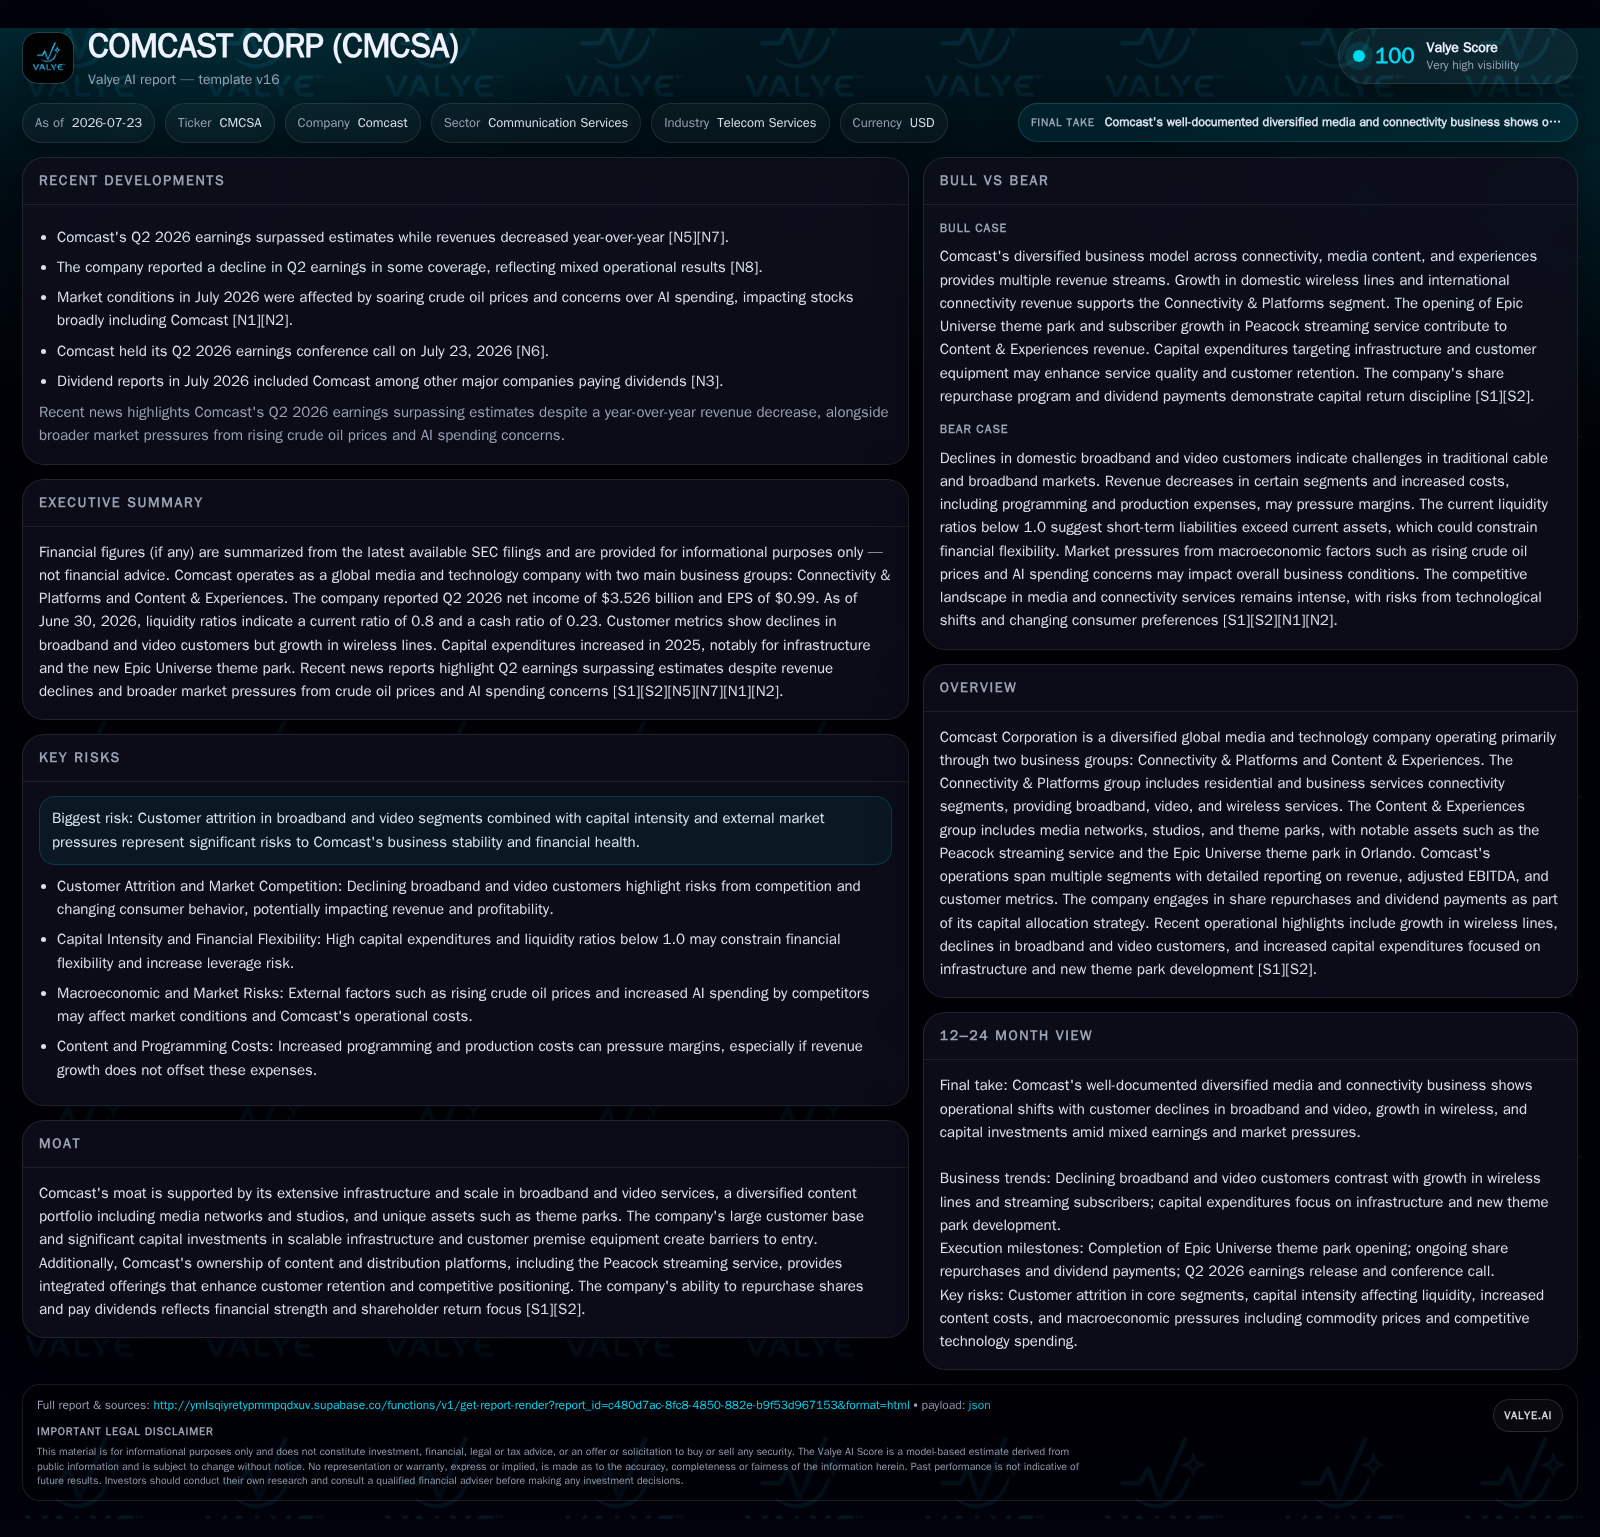
Comcast reported mixed operational trends in Q2 2026, with wireless subscriber growth offset by broadband and video customer declines [S2]. The company’s broad business model spans connectivity services and content experiences including streaming and theme parks, leveraging scale and integrated offerings [S1][S2]. However, subscriber attrition and high capital intensity continue to challenge margin expansion [S2][S1]. Growth drivers include expansion of wireless lines, network infrastructure investments, and content monetization via studios and Peacock. Key risks remain related to competitive pressures in broadband and video, regulatory environments, and the high fixed cost structure of infrastructure and content production. Financially, Comcast maintains a leveraged balance sheet with over $84 billion in debt against $7.7 billion cash on hand as of mid-2026 [F1][S2].
Recent Operating Update
Comcast's second quarter of 2026 revealed a nuanced operational landscape reflecting the complexity of its integrated telecommunications and media business model amid competitive pressures. The company reported a net increase of 1.5 million domestic wireless lines, underscoring momentum in its wireless connectivity segment driven by bundled offerings and network expansion [S1][S2]. However, this growth was offset by declines in broadband and video subscribers, with domestic broadband customers falling by approximately 711,000 and video customers decreasing by about 1.3 million during the quarter [S1]. These subscriber trends highlight ongoing challenges in legacy connectivity services that remain core to Comcast’s Residential Connectivity & Platforms segment.
On the content front, Comcast’s Content & Experiences segment, which includes media networks, studios, streaming services like Peacock, and theme parks such as Universal’s Epic Universe, continues to invest heavily in programming and production. Although specific Peacock subscriber metrics were not disclosed this quarter, prior filings indicate significant content-related expenditures, including costs associated with major events like the Olympics, which have now passed [S1][S2][N2]. The spin-off of Versant Media Group in early 2026 removed approximately $12.5 billion in cable network assets from Comcast’s consolidation, sharpening the company’s strategic focus on integrated broadband, wireless connectivity, and premium content experiences [S21].
Capital expenditures remain a critical operational lever, with Connectivity & Platforms CapEx rising 5.3% year-over-year to $8.7 billion [S1][S2]. This increase reflects investments in customer premise equipment upgrades to support higher broadband speeds and scalable network infrastructure enhancements essential for sustaining service quality and expanding homes and businesses passed
Business Model Analysis
Comcast operates a vertically integrated telecommunications and media business combining subscription-based connectivity services—broadband internet, video distribution, and wireless telephony—with content creation and distribution assets. The Connectivity & Platforms segment generates revenue primarily from residential and business broadband subscribers, video customers, and wireless lines, with monetization driven by monthly subscription fees, bundled service packages, and enterprise solutions. The Content & Experiences segment derives revenue from advertising sales, content licensing, streaming subscriptions via Peacock, and experiential revenues from theme parks.
Subscriber volumes and average revenue per user (ARPU) are key operating metrics influencing revenue growth. Comcast’s pricing strategies, including promotional offers such as free wireless lines bundled with broadband subscriptions, aim to enhance customer retention and acquisition but can pressure ARPU in the short term [S1][S2]. Programming and production costs, including sports rights and licensed content, represent significant fixed expenses that compress margins when subscriber counts decline or revenue growth slows [S2].
Capital expenditures focus on upgrading network infrastructure and customer premise equipment to support next-generation broadband speeds and wireless technologies, which are essential for maintaining competitive service offerings and reducing churn. Meanwhile, content investments in studios and streaming platforms seek to diversify revenue streams and enhance customer engagement beyond traditional connectivity services.
Industry Structure & Competitive Position
The telecommunications services industry is characterized by intense competition and rapid technological change. Comcast competes with integrated telecom operators such as AT&T and Verizon, which offer converged wireless and broadband services, and cable/broadband providers like Charter Communications. On the content side, Disney’s combination of studios and theme parks provides a parallel to Comcast’s diversified media and experiential assets, while Netflix represents a leading pure-play streaming competitor focused exclusively on digital content distribution.
Comcast’s competitive advantage lies in its extensive last-mile network infrastructure combined with proprietary content assets, enabling bundled offerings that increase customer stickiness and create higher switching costs. However, the company faces ongoing risks from cord-cutting trends, pricing pressures from wireless and streaming competitors, and the capital-intensive nature of maintaining and expanding both network and content capabilities.
Growth Drivers
Key growth drivers for Comcast include:
- Expansion of high-speed broadband penetration driven by consumer demand for bandwidth-intensive applications such as streaming, gaming, and remote work.
- Growth in domestic wireless lines supported by promotional bundling with broadband services, enhancing customer lifetime value and reducing churn.
- Monetization of proprietary content through NBCUniversal’s studios and Peacock’s hybrid ad-supported and subscription streaming model, aiming to increase digital audience engagement.
- Capital investments in fiber network build-outs and scalable infrastructure to increase homes and businesses passed, expanding the addressable market.
- Recovery and growth in theme park attendance and revenues, providing diversified experiential income streams beyond subscription services [S1]
Risks & Growth Constraints
Challenges constraining growth include:
- Continued subscriber attrition in broadband and video segments due to competitive pressures from wireless carriers, streaming platforms, and alternative broadband providers.
- Pricing sensitivity among consumers amid inflationary pressures, limiting ARPU growth without exacerbating churn.
- High fixed programming and content production costs that compress margins when subscriber bases decline or revenue growth slows.
- Elevated capital expenditure requirements to maintain and upgrade network infrastructure, increasing leverage risk if cash flow generation weakens.
- Regulatory uncertainties related to spectrum allocation, net neutrality, and privacy regulations that could impact wireless deployment and service offerings [S1][S24]
What To Watch Next
Key indicators to monitor include:
- Trends in broadband ARPU relative to promotional pricing and churn rates, which will signal retention effectiveness and pricing power.
- Pace of wireless subscriber net additions and uptake of bundled service offerings.
- Adjusted EBITDA margin trajectory reflecting the balance between revenue growth, programming cost volatility, and capital expenditure efficiency.
- Peacock streaming service engagement and subscriber metrics as a gauge of content monetization success relative to peers.
- Progress on network infrastructure projects expanding homes passed and fiber deployment, which underpin future connectivity growth.
- Regulatory developments affecting spectrum auctions, antitrust scrutiny, and content licensing frameworks.
Financial Profile Discussion
As of June 30, 2026, Comcast reported cash and cash equivalents of approximately $7.7 billion against total debt of about $84.3 billion, resulting in net debt near $76.6 billion and a current ratio of approximately 0.8, reflecting working capital pressures typical of capital-intensive telecom and media operations [F1][S2]
Adjusted EBITDA declined materially in Q2 2026, primarily due to margin compression from broadband and video subscriber losses combined with higher programming and production costs following the normalization of event-related expenses such as the Olympics [S2][S10]. This volatility underscores the sensitivity of Comcast’s profitability to subscriber dynamics and content cost fluctuations.
Going forward, effective cash flow management balancing reinvestment in network and content assets with leverage reduction will be critical to sustaining financial flexibility and supporting strategic initiatives.
Disclaimer
This analysis is based solely on publicly available information including SEC filings dated up to July 23, 2026, supplemented by credible news sources through July 2026. It does not constitute investment advice nor forecasts future financial performance beyond documented data points.
Disclaimer: This is research-only, informational analysis and not investment advice. It may include AI-generated interpretation and general industry context. Always verify important details using primary sources.

Comments