
Tesla’s Q2 2026 Profit Pressure Tests Vertical Integration and Innovation Edge
Tesla’s latest quarterly results show revenue growth tempered by net income decline, underscoring operational challenges amid elevated R&D spending and production scaling.
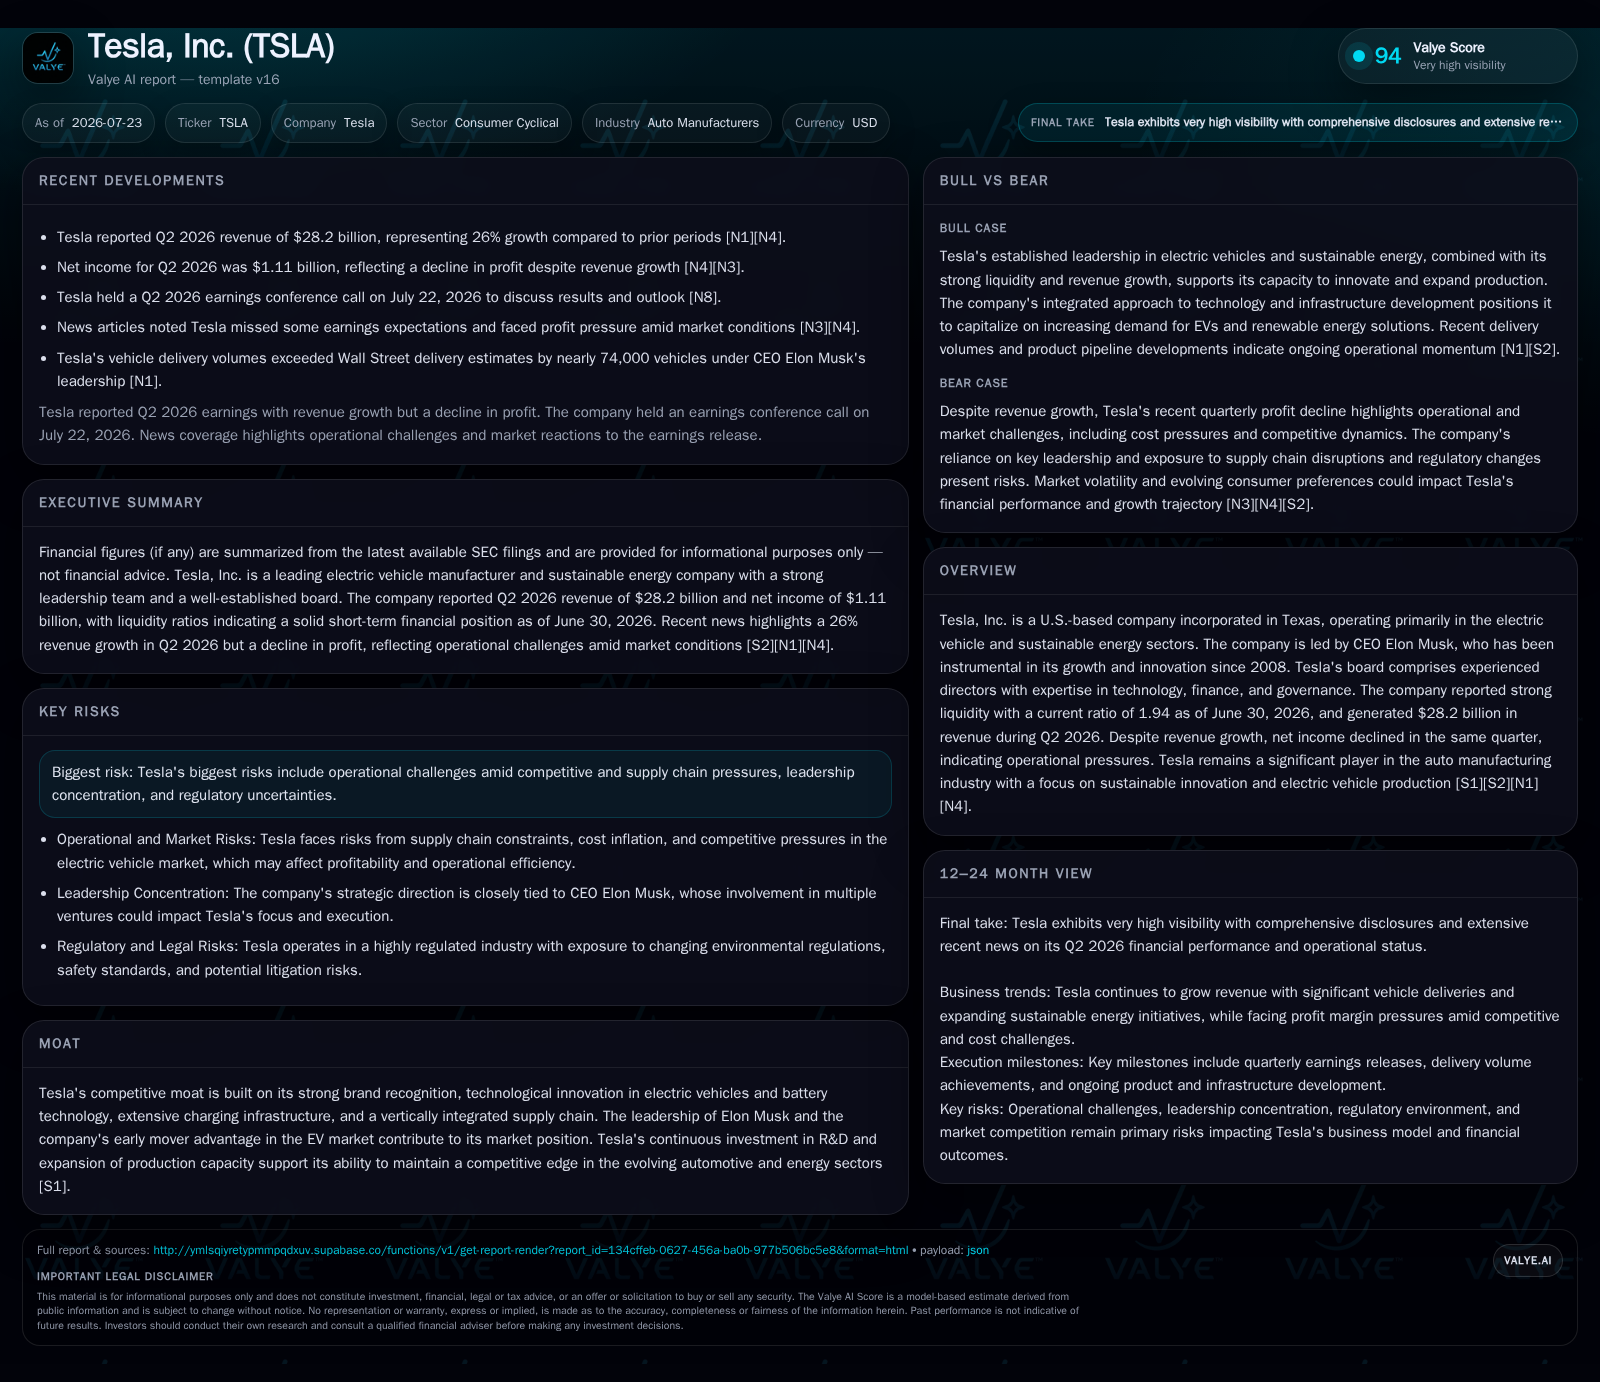
In Q2 2026, Tesla posted revenue of $28.2 billion, marking year-over-year top-line growth driven by expanded electric vehicle deliveries. However, net income declined due to rising costs, notably elevated R&D expenses linked to ambitious innovation projects. This dynamic pressures Tesla’s margins even as its vertical integration strategy offers resilience in supply chain management and cost control. The interplay of ramping production capacity, sustained technology investment, and growing competitive pressures frame the company’s near-term operating outlook.
Tesla’s Q2 2026 Profit Pressure Tests Vertical Integration and Innovation Edge
Tesla’s second-quarter 2026 results reveal a complex operating environment where revenue growth contrasts with declining net income, highlighting challenges in cost management amid aggressive innovation investments and production scaling efforts. The company reported revenue of $28.2 billion for Q2 2026, reflecting year-over-year growth driven primarily by increased electric vehicle (EV) deliveries and expanded software monetization streams [S2][N1]. However, net income contracted due to elevated research and development (R&D) expenses and higher fixed operational costs, compressing margins despite the top-line expansion [S2][N1]. This dynamic underscores the tension between Tesla’s vertical integration strategy and the capital intensity of scaling production capacity while maintaining technology leadership.
Vertical Integration: Supply Chain Control Versus Margin Pressure
Tesla’s vertically integrated business model encompasses battery cell manufacturing, vehicle assembly, proprietary software development, and an expanding charging infrastructure network [S1]. This integration provides Tesla with enhanced control over critical raw materials procurement—such as lithium and nickel essential for battery production—and supply chain timing, offering resilience against some industry-wide semiconductor and component shortages [S2]. Compared to legacy automakers like General Motors and Toyota, which often source battery cells externally, Tesla’s approach entails higher upfront capital expenditures and fixed costs that weigh on gross margins when production volumes and average selling prices (ASP) do not sufficiently offset these expenses [S2].
In Q2 2026, Tesla’s gross margin faced pressure as fixed costs related to manufacturing facilities and R&D investments increased, while competitive pricing dynamics in the EV market limited the company’s ability to fully pass on these costs to customers [S2]. The company’s supply chain agility remains a competitive advantage, but global raw material price volatility and semiconductor supply constraints continue to introduce execution risks that could affect unit cost trends and margin expansion [S2].
Innovation Investment Elevates R&D Spending Amid Intensifying Competition
Tesla increased its R&D expenditure as a percentage of revenue in Q2 2026, reflecting strategic prioritization of autonomous driving software enhancements, AI development for its Robotaxi service, and battery technology advancements aimed at reducing pack costs per kilowatt-hour and extending vehicle range [S1][N1]. These investments are critical to sustaining Tesla’s technology leadership in a market where both established automakers and pure EV manufacturers such as Rivian and NIO aggressively pursue software differentiation and electrification.
While the higher R&D spend weighs on near-term profitability, it supports Tesla’s long-term competitive positioning by enabling product quality improvements and expanding monetizable software and service offerings. The company’s Full Self-Driving (FSD) software, offered as a subscription, continues to generate incremental high-margin revenue beyond vehicle sales, contributing to diversified revenue streams [S1]
Production Capacity Scaling: Volume Growth and Execution Risks
Tesla’s vehicle production volume increased in Q2 2026, supported by ongoing capacity ramp-ups at its Gigafactories in Texas and Berlin [S2][S3]. Improved production capacity utilization is essential for diluting fixed manufacturing costs and driving margin improvement. However, scaling manufacturing amid persistent supply chain constraints—particularly in semiconductors and battery raw materials—introduces execution risks that could temporarily elevate unit costs or delay throughput gains [S2].
Legacy automakers face similar challenges but often benefit from more diversified manufacturing footprints, which can mitigate risks associated with single-site disruptions. Tesla’s concentrated production sites require precise operational execution to meet delivery targets and maintain cost efficiencies [S3]. Monitoring production volume growth relative to capacity utilization will be key to assessing Tesla’s ability to leverage scale for margin expansion.
Pricing Power Supported by Brand Equity Amid Market Competition
Tesla’s strong brand recognition and direct-to-consumer sales model support relatively high ASPs compared to many EV competitors, including traditional automakers expanding their electric vehicle lineups [S1][N4]. By selling vehicles directly, Tesla avoids dealer markups, enabling more flexible pricing strategies that help preserve margins in a competitive market.
Nonetheless, intensifying competition from legacy automakers and new entrants offering lower-priced EV models exerts downward pressure on ASPs across the industry. Government incentives and subsidies further fuel competition by making EVs more accessible, potentially challenging Tesla’s pricing power over time. Tracking changes in Tesla’s ASP and product mix will provide insight into the durability of its premium pricing strategy.
Expanding Software and Charging Infrastructure as Growth Engines
Beyond vehicle sales, Tesla’s monetization of software features such as the FSD package and its expanding Supercharger network represent meaningful growth levers [S1]. The subscription-based FSD offering contributes recurring, high-margin revenue, enhancing overall profitability
The Supercharger network expansion improves customer convenience and strengthens Tesla’s ecosystem, fostering brand loyalty and supporting resale values. Although the charging infrastructure remains small relative to the total vehicle fleet globally, its growth is a strategic complement to vehicle sales and positions Tesla to capture additional value in the evolving EV ecosystem.
Key Risks: Supply Chain Volatility, Regulatory Compliance, and Leadership Concentration
Tesla faces ongoing risks from semiconductor supply volatility and raw material price fluctuations, which can disrupt production schedules and increase manufacturing costs [S2]. Additionally, evolving regulatory requirements related to emissions, safety, and data privacy impose compliance costs that may affect operational flexibility and profitability.
Leadership concentration risk is notable given CEO Elon Musk’s central role in strategic decision-making and innovation direction. Continuity planning and governance considerations remain important given the company’s reliance on key executives.
Upcoming Catalysts and Monitoring Points
Key near-term milestones include quarterly vehicle delivery figures, which serve as demand indicators amid inventory fluctuations reported previously [S3]. The successful execution of new product launches, such as refreshed Model S and Model X variants and Cybertruck volume scaling, will be critical to sustaining growth and operational momentum.
Tesla’s initiatives to improve profit margins through supply chain optimization and manufacturing innovations, including advanced casting technologies, warrant close observation. Future earnings reports will provide concrete data on the effectiveness of these margin restoration efforts.
Financial Position Provides Cushion Amid Profitability Pressures
Tesla’s balance sheet remains robust as of June 30, 2026, with cash and equivalents totaling approximately $15.2 billion and total debt of about $9.08 billion, resulting in a net cash position near $6.14 billion [F1]. The company’s current assets of $68.8 billion exceed current liabilities of $35.4 billion, yielding a current ratio of approximately 1.94, indicating solid short-term liquidity coverage [F1].
This financial flexibility supports Tesla’s capital-intensive R&D programs and production scaling efforts, providing a buffer against cyclical demand fluctuations and margin pressures identified in the quarter.
Disclaimer: This analysis is based exclusively on publicly available data as of July 23, 2026. It does not constitute investment advice or research views.
Financial snapshot context
As of 2026-06-30, Tesla’s cash and equivalents stood at $15.2 billion with total debt at $9.08 billion, implying a net cash position of roughly $6.14 billion and a current ratio near 1.94x, reflecting a strong liquidity profile to support ongoing operations and investments [F1]
Disclaimer: This is research-only, informational analysis and not investment advice. It may include AI-generated interpretation and general industry context. Always verify important details using primary sources.

Comments