
Honeywell’s Post-Spin Aerospace Focus Tests Industrial Automation and Technology Growth Amid Macroeconomic Uncertainties
Following its June 2026 Aerospace spin-off, Honeywell International narrows on industrial technologies while managing macro risks and portfolio realignment.
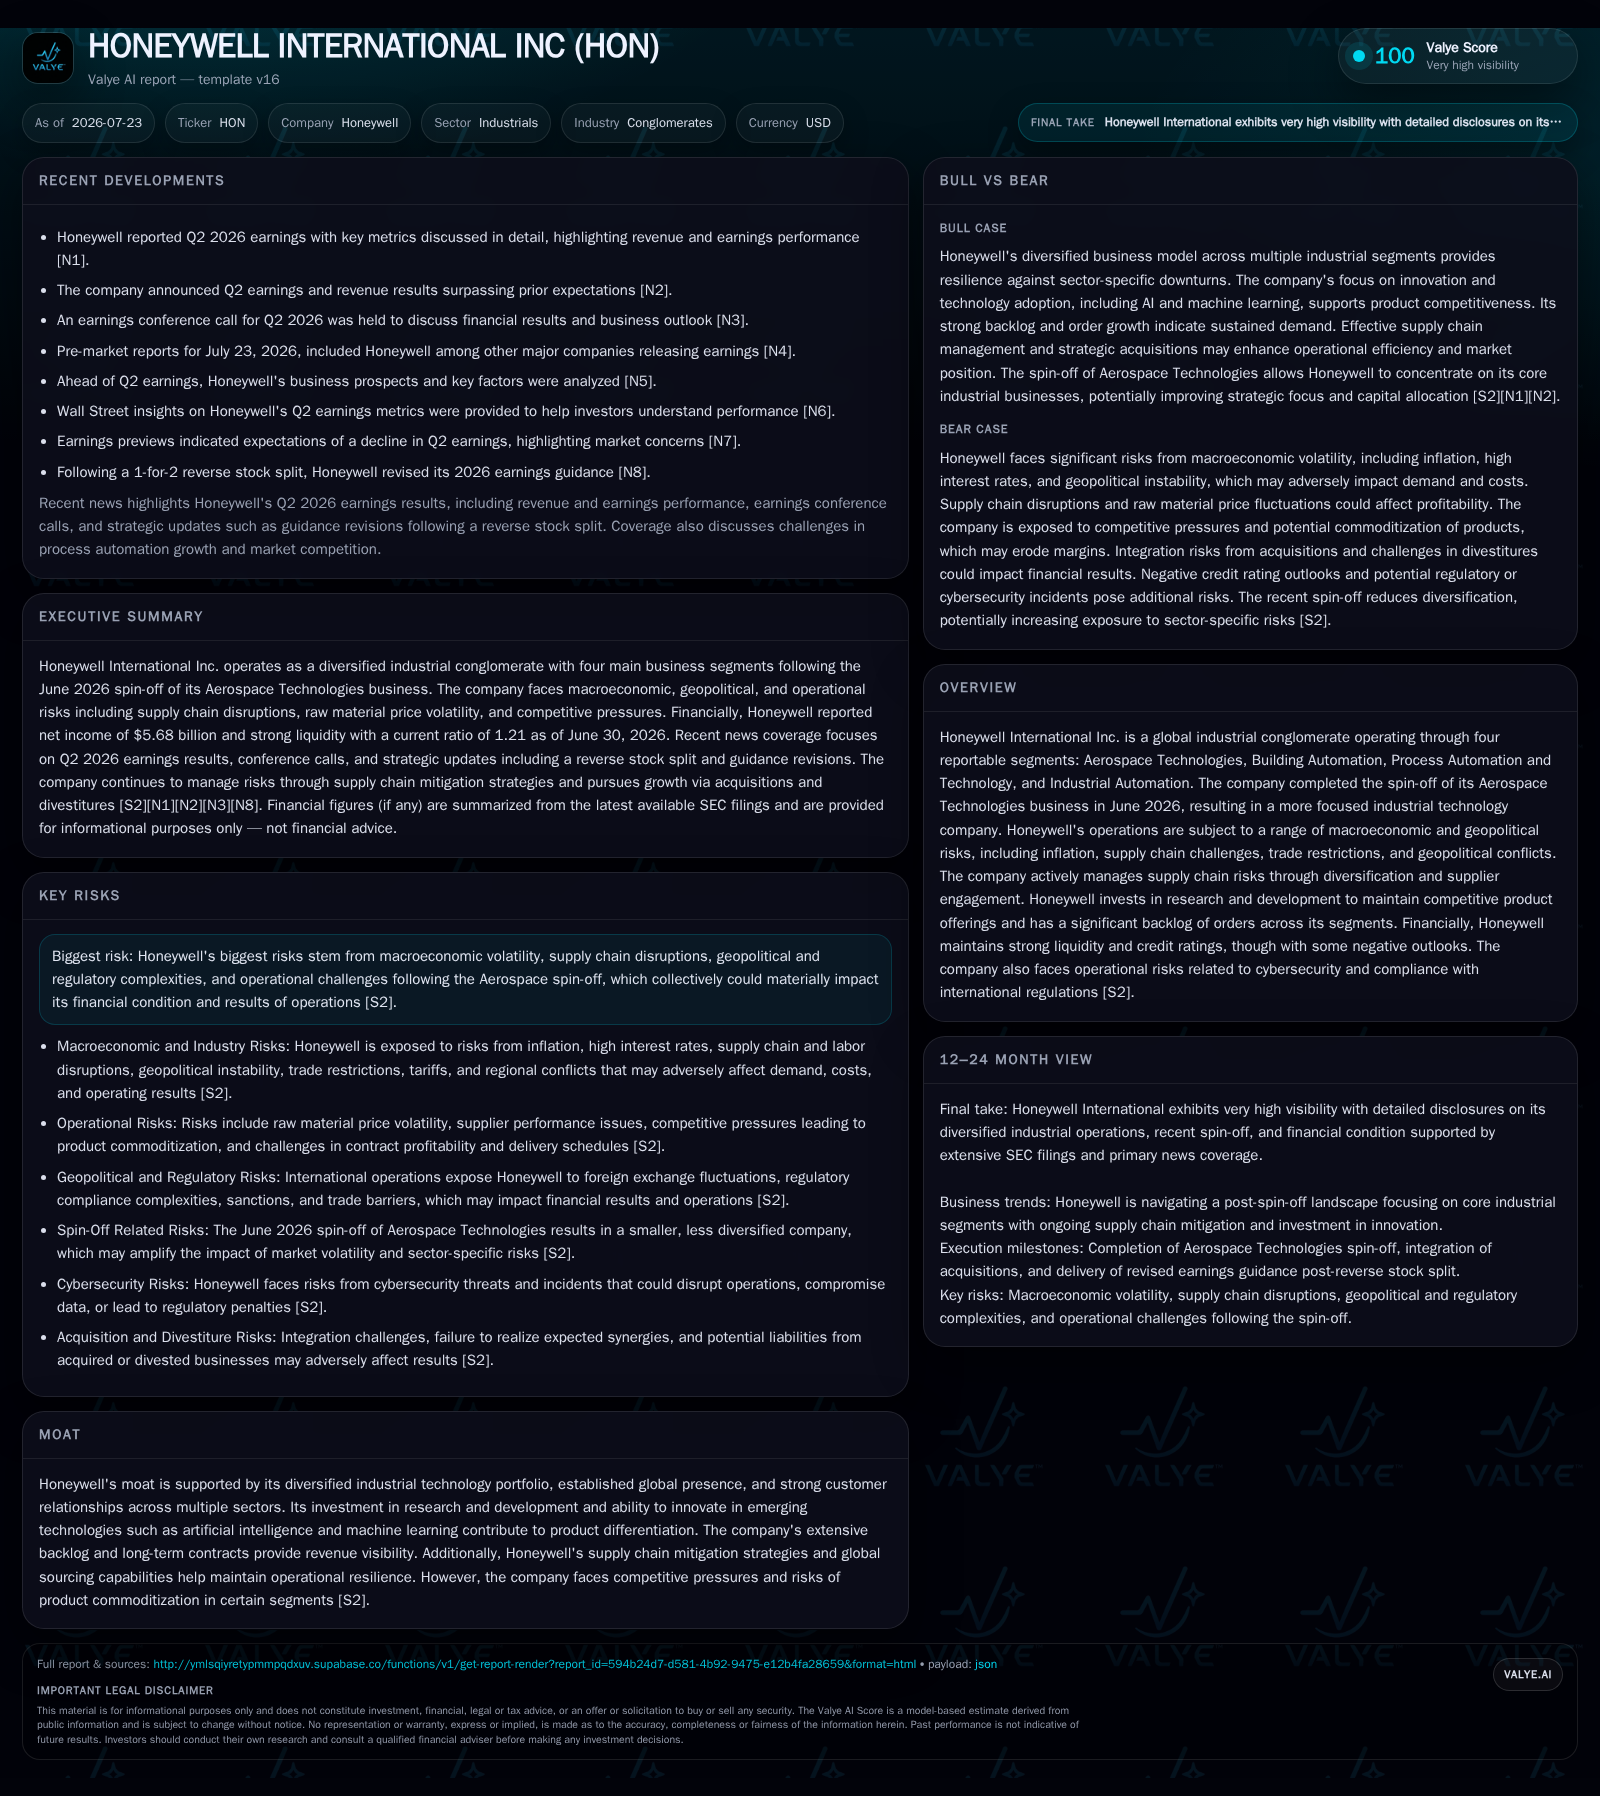
Honeywell International completed a major portfolio transformation with the spin-off of its Aerospace Technologies business in June 2026, marking a pivot to a more focused industrial automation and technology company. The latest quarterly results show resilience supported by backlog growth and pricing power, offset by volume softness amid inflationary pressures and supply chain constraints. Honeywell’s diversified segments—Building Automation, Process Automation and Technology, and Industrial Automation—face distinct cyclical challenges linked to capital spending and industrial demand. Ongoing strategic divestitures and acquisitions aim to sharpen the company’s competitive positioning, though macroeconomic headwinds and regulatory complexities pose material risks going forward. Financially, the company maintains strong liquidity but carries elevated net debt post-spin.
Recent Operating Update: Strategic Spin-off Reshapes Honeywell's Portfolio
On June 29, 2026, Honeywell finalized the spin-off of its Aerospace Technologies segment, severing its historically large aerospace exposure and repositioning itself primarily as an industrial technology conglomerate focusing on Building Automation, Process Automation and Technology, and Industrial Automation segments [S2], [S3]. This corporate reorganization not only alters revenue composition but shifts market dynamics by concentrating Honeywell's resources on automation software, sensors, controls, process solutions, and building management systems that serve industrial customers across sectors such as chemicals, refining, infrastructure construction, manufacturing plants, and energy utilities.
Business Model Specifics: Industrial OEM and Technology Provider with Services Attachment
Honeywell operates primarily as an original equipment manufacturer (OEM) producing complex hardware integrated with software solutions tailored for automation of buildings, industrial facilities, chemical plants, and related infrastructure. Its monetization model combines upfront product sales—capital-intensive devices such as sensors or control systems—with recurring revenue streams from long-term service contracts including aftermarket services for maintenance and software updates.
Post-spin-off segmentation reflects this strategic repositioning: Building Automation delivers smart building management systems; Process Automation and Technology integrates core refinery catalysts through acquisitions like Johnson Matthey's Catalyst Technologies pending Q3 completion ([S18]); Industrial Automation comprises safety monitoring systems and workflow optimization tools within manufacturing contexts ([S25]). Revenue drivers are thus tied closely to customer capital expenditure cycles in construction retrofits, energy sector facility upgrades, chemical processing expansions, or production efficiency improvements.
Pricing power appears well-maintained through cost pass-through mechanisms addressing raw material inflation; however, volume growth faces cyclicality tied to industrial CAPEX trends ([S2]). Operationally, working capital turnover measures alongside backlog size will be critical metrics going forward given the elongated project execution timelines typical for industrial OEM contracts.
Industry Structure and Competitive Position
Honeywell sits firmly within diversified industrial conglomerates that leverage cross-segment technological synergies while confronting end-market cyclical sensitivities characteristic of capital goods producers. Peers such as Siemens AG (industrial automation), Emerson Electric (process control), and Johnson Controls (building management) similarly balance broad product portfolios serving overlapping but technically specialized markets.
The recent separation of aerospace trims Honeywell's exposure relative to peers like General Electric with retained diversified industrial footprint emphasizing AI-enabled automation distinguishes it from more narrowly focused firms like Rockwell Automation ().
Honeywell’s moat rests on global scale advantages enhancing supply chain resilience amid geopolitical fragmentation—including trade restrictions—and augmented R&D capabilities fostering product differentiation especially in emerging AI/machine learning-enabled IoT systems ([S9]). Nevertheless, segments like Process Automation face commoditization pressures evidenced by intensified competition driving margin compression risks ([N13]). The company's ability to sustain operating margins amidst these factors will be a key performance barometer.
Growth Drivers: Backlog Expansion and Innovation Amid Macro Constraints
Backlog growth exceeding 15% pre-spin signifies structural demand underpinning for Honeywell’s core segments; solid backlog-to-bill ratios typically signal robust near-term revenue conversion pipelines ([S12]). This is reinforced by customer commitments in long-term contracts across multiple verticals including refineries investing selectively after oil-price volatility moderation and infrastructure projects fueling Building Automation demand.
Investment in research & development remains pivotal—a $758 million spend in Q1 alone underscores commitment toward next-generation products integrating cybersecurity features mandated by evolving global regulations (e.g., EU Cyber Resilience Act) as well as AI-driven analytics enhancing operational efficiency ([S28], [S19]). Such innovation is vital given industry-wide tendencies toward product commoditization which undermines pricing power absent technological leadership.
Additionally, strategic acquisitions such as Johnson Matthey's Catalyst Technologies augment material science capabilities essential for sustainable energy transitions within refining processes ([S18]). Concurrent divestitures including Productivity Solutions streamline portfolio focus enhancing margin profiles.
Risks and Watchpoints: Cyclicality Meets Regulatory Complexities
Honeywell’s performance remains sensitive to macroeconomic volatility impacting capital spending across end markets:
- Building Automation weakness if construction cycles falter or retrofit budgets shrink,
- Process Automation exposed to raw material price swings influencing refinery investment decisions,
- Industrial Automation vulnerable to plant utilization downturns across manufacturing sectors ([S2]).
Supply chain disruptions persist due to geopolitical tensions alongside labor shortages elevating input costs ([S8]). Emerging regulatory regimes around data privacy and cybersecurity impose compliance costs that could delay product launches or necessitate redesigns potentially affecting competitiveness ([S19]).
The post-spin balance sheet carries significant leverage with net debt near $17.5 billion against cash reserves of $8.75 billion as of June 30, 2026 ([F1]), requiring prudent liquidity management especially if credit rating outlooks remain pressured due to negative outlook revisions earlier this year.
Integration risks related to acquisitions or disposals add uncertainty together with litigation exposures highlighted periodically including Flexjet litigation payments noted earlier this year impacting operating cash flows ([S10], [S13]). ESG-driven regulatory shifts could augment capital expenditure requirements or operational constraints unattractive to some customers ([S17]).
What To Watch Next
Key indicators include:
- Quarterly backlog updates for all reportable segments tracking demand momentum,
- Book-to-bill ratios signaling whether order intake surpasses revenue shipments,
- Segment operating margin trends reflecting pricing versus cost absorption capabilities,
- Progress on acquisition closure (e.g., Johnson Matthey deal) shaping Process Automation scale,
- Updates on strategic divestiture completions confirming portfolio focus enhancements,
- Developments regarding regulatory compliance efforts especially cybersecurity standards,
- External macro indicators particularly U.S./global infrastructure spending legislation impact,
- Refinery capex announcements bearing directly on Process Automation demand trajectory.
Guidance revisions will be telling in the context of ongoing inflationary pressures combined with potential concessionary pricing or volume deflation from cyclical downturns ([N3]). Monitoring free cash flow generation relative to debt maturities sheds light on balance sheet flexibility during integration periods.
Financial Profile Discussion
As of June 30, 2026, Honeywell holds $8.75 billion in cash and equivalents compared with total debt of approximately $26.2 billion, resulting in net debt near $17.5 billion [F1]. Current assets of $28.1 billion exceed current liabilities of $23.2 billion, yielding a current ratio of approximately 1.21x, indicating reasonable short-term liquidity coverage at face value [F1]. The company expects operating cash flows alongside committed credit facilities to suffice for operational needs over the next twelve months [S10].
Interest expense has increased following pre-separation financing activities but remains manageable within operating income levels considering margin improvement initiatives [S23]. Capital expenditure intensity remains moderate given industrial scale but requires scrutiny given increased investment toward technology upgrades driven by regulatory mandates [S28].
Overall financial positioning illustrates typical transitional leverage spikes associated with large spin-offs among conglomerates; maintaining disciplined cash flow conversion rates coupled with margin management will be essential for risk mitigation going forward.
This analysis is based exclusively on publicly filed SEC documents as of July 23, 2026, supported by contemporaneous news reports where applicable; it does not incorporate proprietary information or provide investment research views.
Disclaimer: This is research-only, informational analysis and not investment advice. It may include AI-generated interpretation and general industry context. Always verify important details using primary sources.

Comments