
Snap-on’s Q2 2026 Growth Supported by Operational Gains and Strategic Acquisitions
Snap-on’s integrated product, information systems, and financial services model underpins modest organic growth and margin resilience amid macroeconomic pressures.
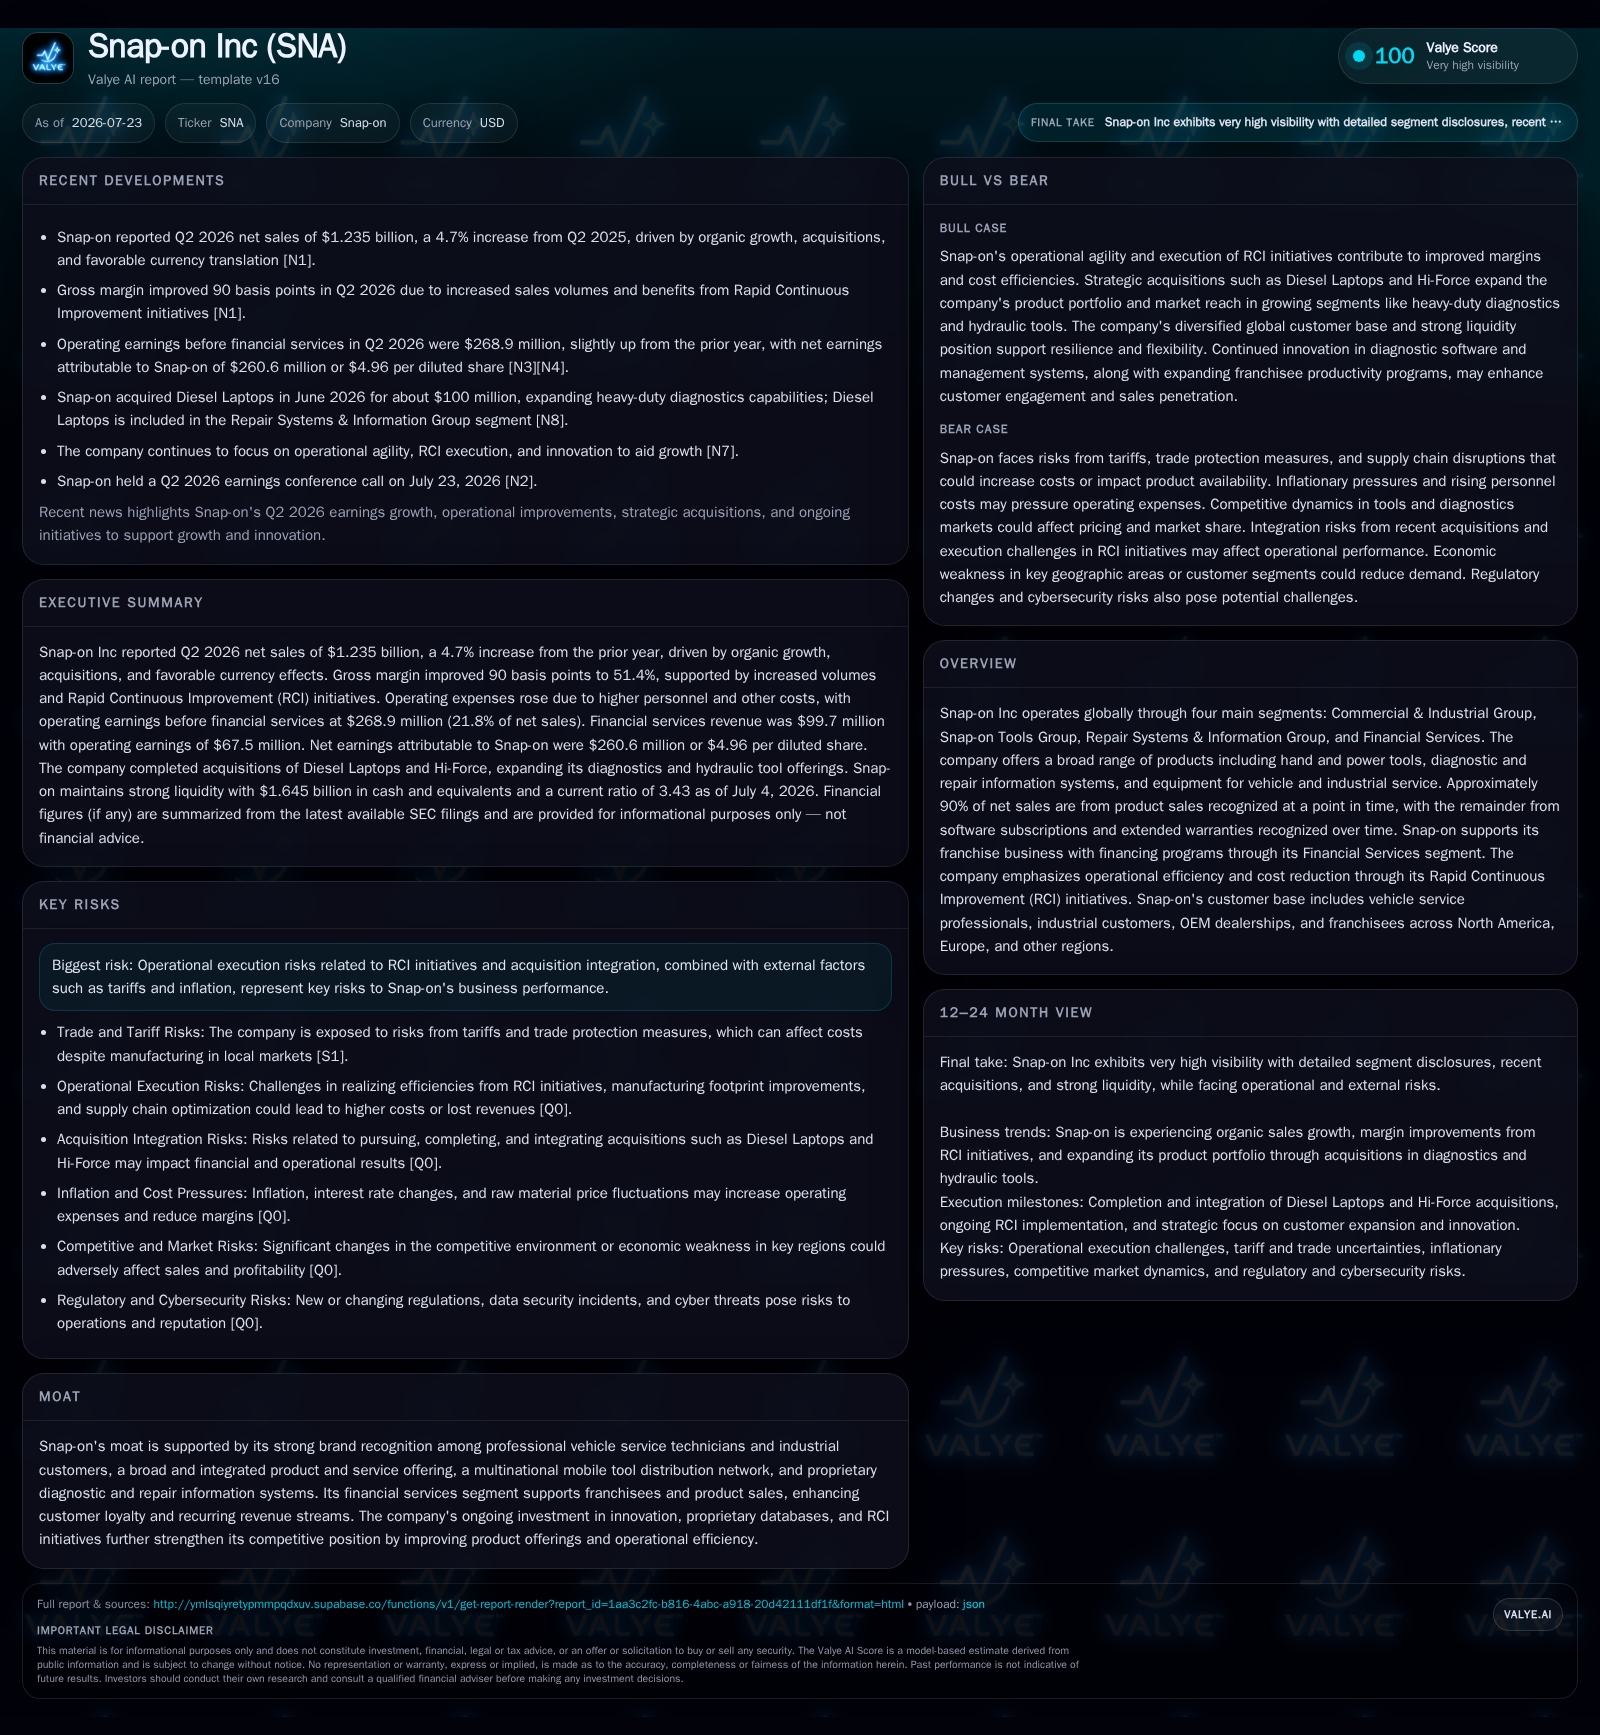
Snap-on Inc reported solid second-quarter 2026 results with a 5.2% increase in net sales driven by organic growth, favorable currency impacts, and acquisitions. The company’s Rapid Continuous Improvement (RCI) initiatives sustain margin expansion despite inflationary headwinds. Strategic acquisitions in diagnostic and repair information systems enhance Snap-on’s competitive position in heavy-duty and off-highway vehicle markets. While integrated financial services revenues dipped slightly, they continue to support franchisees and reinforce customer loyalty. Snap-on maintains a strong liquidity and capital position, positioning it well for ongoing investments and operational agility.
Recent Operating Update: Q2 2026 Results
Gross profit improved by nearly $70 million year-over-year to $1.24 billion in H1 2026 with a gross margin expansion of about 30 basis points to roughly 50.9%, driven predominantly by volume leverage benefits combined with efficiencies from Snap-on’s Rapid Continuous Improvement (RCI) program which targets process waste reduction and cost containment across manufacturing and supply chains [S16]. However, higher raw material prices and inflationary pressures partially offset these gains. Operating expenses rose by approximately $52 million reflecting increased personnel costs and investments in technology but were managed tightly enough for operating earnings before financial services to increase modestly by $17.5 million or 3.5% [S16].
Financial Services segment revenues showed a slight dip of 1.5% in H1 to $200.8 million primarily on a reduced receivables portfolio size but maintained steady yields near prior year levels [S16]. Operating earnings from Financial Services decreased marginally by around $3 million to $135.5 million, underscoring its role as a stable revenue contributor that underpins customer franchising activities [S16]. Overall operating earnings grew to $655 million while reported net income rose by over $16 million compared to the prior year period [S16][S19].
Business Model Specifics
Snap-on operates through four principal segments: Commercial & Industrial Group; Snap-on Tools Group; Repair Systems & Information Group; and Financial Services [S1]. Its core value proposition centers on supplying professional vehicle service technicians, industrial customers, OEM dealerships, and franchisees worldwide with an integrated suite of hand tools, power tools, diagnostic equipment, repair information systems—augmented by software subscriptions—and financing support.
Approximately 90% of revenue comes from point-in-time product sales while the balance derives from recurring streams like software subscriptions and extended warranties recognized over contract durations [S1]. The company’s differentiated approach lies in combining proprietary diagnostic data platforms—strengthened recently through acquisitions—with robust physical hardware product lines distributed via a multinational mobile tool network that visits customers directly at their workplaces [S1]. This model bolsters customer loyalty through convenience and integrated solutions tailored for complex industrial applications.
The Financial Services segment supports franchisees’ working capital needs through receivables financing programs enabling flexible purchases while generating steady interest income for Snap-on [S1][S16]. Cross-selling opportunities between product sales and these financing solutions create sticky customer relationships that help mitigate competitive pressures seen among peers like Stanley Black & Decker or Illinois Tool Works.
Industry Structure & Competitive Positioning
The industrial tools and equipment sector serves diverse markets including automotive repair shops, aerospace components servicing, natural resources extraction equipment maintenance, transportation fleets, government/military contracts, power generation facilities, and technical education institutions [S1]. Demand drivers are largely cyclical but also exhibit structural growth trends tied to technological complexity in vehicle diagnostics as well as aging vehicle fleets globally that require sophisticated repair tools.
Compared with industry peers such as Stanley Black & Decker—which competes mainly on scale in hand tools—and Illinois Tool Works offering broader industrial equipment portfolios—Snap-on distinguishes itself through its unique integration of diagnostic information technology combined with an extensive mobile tool distribution network that commands brand loyalty among professional technicians.
The acquisition of Diesel Laptops extends Snap-on’s moat into commercial trucks and off-highway vehicles where advanced diagnostics are increasingly essential due to regulatory emissions requirements and system complexity [S20]. This strategic move solidifies its presence beyond light vehicle aftermarket tooling into specialized heavy-duty service verticals.
Operational excellence through RCI initiatives further strengthens its competitive position by driving cost reductions without compromising quality or customer service – critical given persistent raw material inflation (steel/plastics/electronics) influenced partially by tariffs imposed since early 2025 [S1][S22]
Growth Drivers
Key growth catalysts include:
- Innovation in diagnostic software platforms leveraging proprietary data acquired through Diesel Laptops.
- Expanding penetration into emerging geographic markets where industrialization drives maintenance demand.
- Scaling specialty torque solutions within commercial & industrial segments.
- Enhancing the breadth of integrated product-service offerings for OEM dealerships transitioning toward digital repair workflows.
- Strengthening franchise networks supported by compelling value propositions enabled via financial services.
- Continued realization of RCI savings improving gross margin resilience amid inflationary pressures.
- Leveraging acquisitions strategically aligned with diagnostic information synergies to create multi-product cross-sell opportunities.
Risks & Constraints
Snap-on faces several execution risks notably: successful implementation of RCI initiatives at scale without disrupting production flow or customer delivery timeliness; integration complexities from recent acquisitions; susceptibility to tariff-related cost volatility; labor availability impacting manufacturing capacity; inflation affecting manufacturing inputs; currency fluctuations influencing international results; retention challenges among franchise operators whose performance materially affects end-customer demand; and intensifying competition from peers aggressively investing in digital tool ecosystems [S2][S1]
Moreover, regulatory dynamics concerning trade policies remain uncertain given U.S.-China relations and reciprocal tariffs introduced since early 2025 that could elevate costs despite Snap-on’s strategy to localize manufacturing closer to end markets [S1][S2]. Maintaining technological relevance via continuous product innovation is also critical to stay ahead of obsolescence risks.
What To Watch Next
Immediate milestones include monitoring organic growth trends—especially within Commercial & Industrial Group geographies experiencing softer conditions such as Asia Pacific—and observing incremental contribution trajectories from recent acquisitions (Diesel Laptops integration outcomes). Tracking margins excluding financial services will indicate the effectiveness of ongoing RCI efforts against inflation headwinds. Franchisee count dynamics alongside financial services originations will validate sustained customer engagement levels.
Additionally, inventory turnover stability will reflect supply chain health as well as demand consistency amid fluctuating raw material costs [S22]. Snap-on’s capital allocation plans including share repurchases noted through early Q3 warrant attention for insights on management confidence amid prevailing market conditions [S18]. Macro factors such as tariff developments or currency shifts will influence near-term operational costs requiring close surveillance.
Financial Profile Discussion
Snap-on maintains a robust liquidity profile evidenced by cash and equivalents totaling approximately $1.64 billion at July 4, 2026 coupled with low current liabilities near $1.32 billion yielding a strong current ratio of about 3.43—signaling ample short-term coverage capacity [F1][S22][S25]. Total debt was around $1.2 billion at the last reported point but net debt is effectively negative due to high cash balances providing de facto leverage flexibility [F1].
The company benefits from strong credit ratings (A2/P-1 Moody's; A-/A-2 S&P; A/Fitch) facilitating access to capital markets for opportunistic funding though no commercial paper was outstanding at quarter-end [S25]. Scheduled maturities appear manageable with available liquidity positioned to repay near-term notes amounting to roughly $300 million maturing March 2027 using cash reserves if deemed optimal [S22].
Share repurchases conducted under board authorizations continue selectively to offset dilution linked to equity plan issuances reinforcing shareholder return discipline amidst reinvestment needs [S18]. Capital expenditures are balanced against ongoing RCI investments anchoring future efficiency gains.
Overall, the financial strength supports Snap-on’s strategic flexibility enabling sustained investment into innovation pipelines alongside disciplined capital returns while navigating macroeconomic uncertainties.
This analysis synthesizes Snap-on Inc's latest quarterly disclosures augmented with industry context relevant to its integrated tools, diagnostics, software subscription model supplemented by financial services supporting franchisees. No investment advice is provided herein; analysis is based solely on cited public records within regulatory filings dated up to July 23, 2026.
Disclaimer: This is research-only, informational analysis and not investment advice. It may include AI-generated interpretation and general industry context. Always verify important details using primary sources.

Comments