
Union Pacific’s Freight Volume Growth and Operational Efficiency Sustain Competitive Edge
Union Pacific’s latest quarterly results reveal resilient execution amid complex demand dynamics and strategic network positioning.
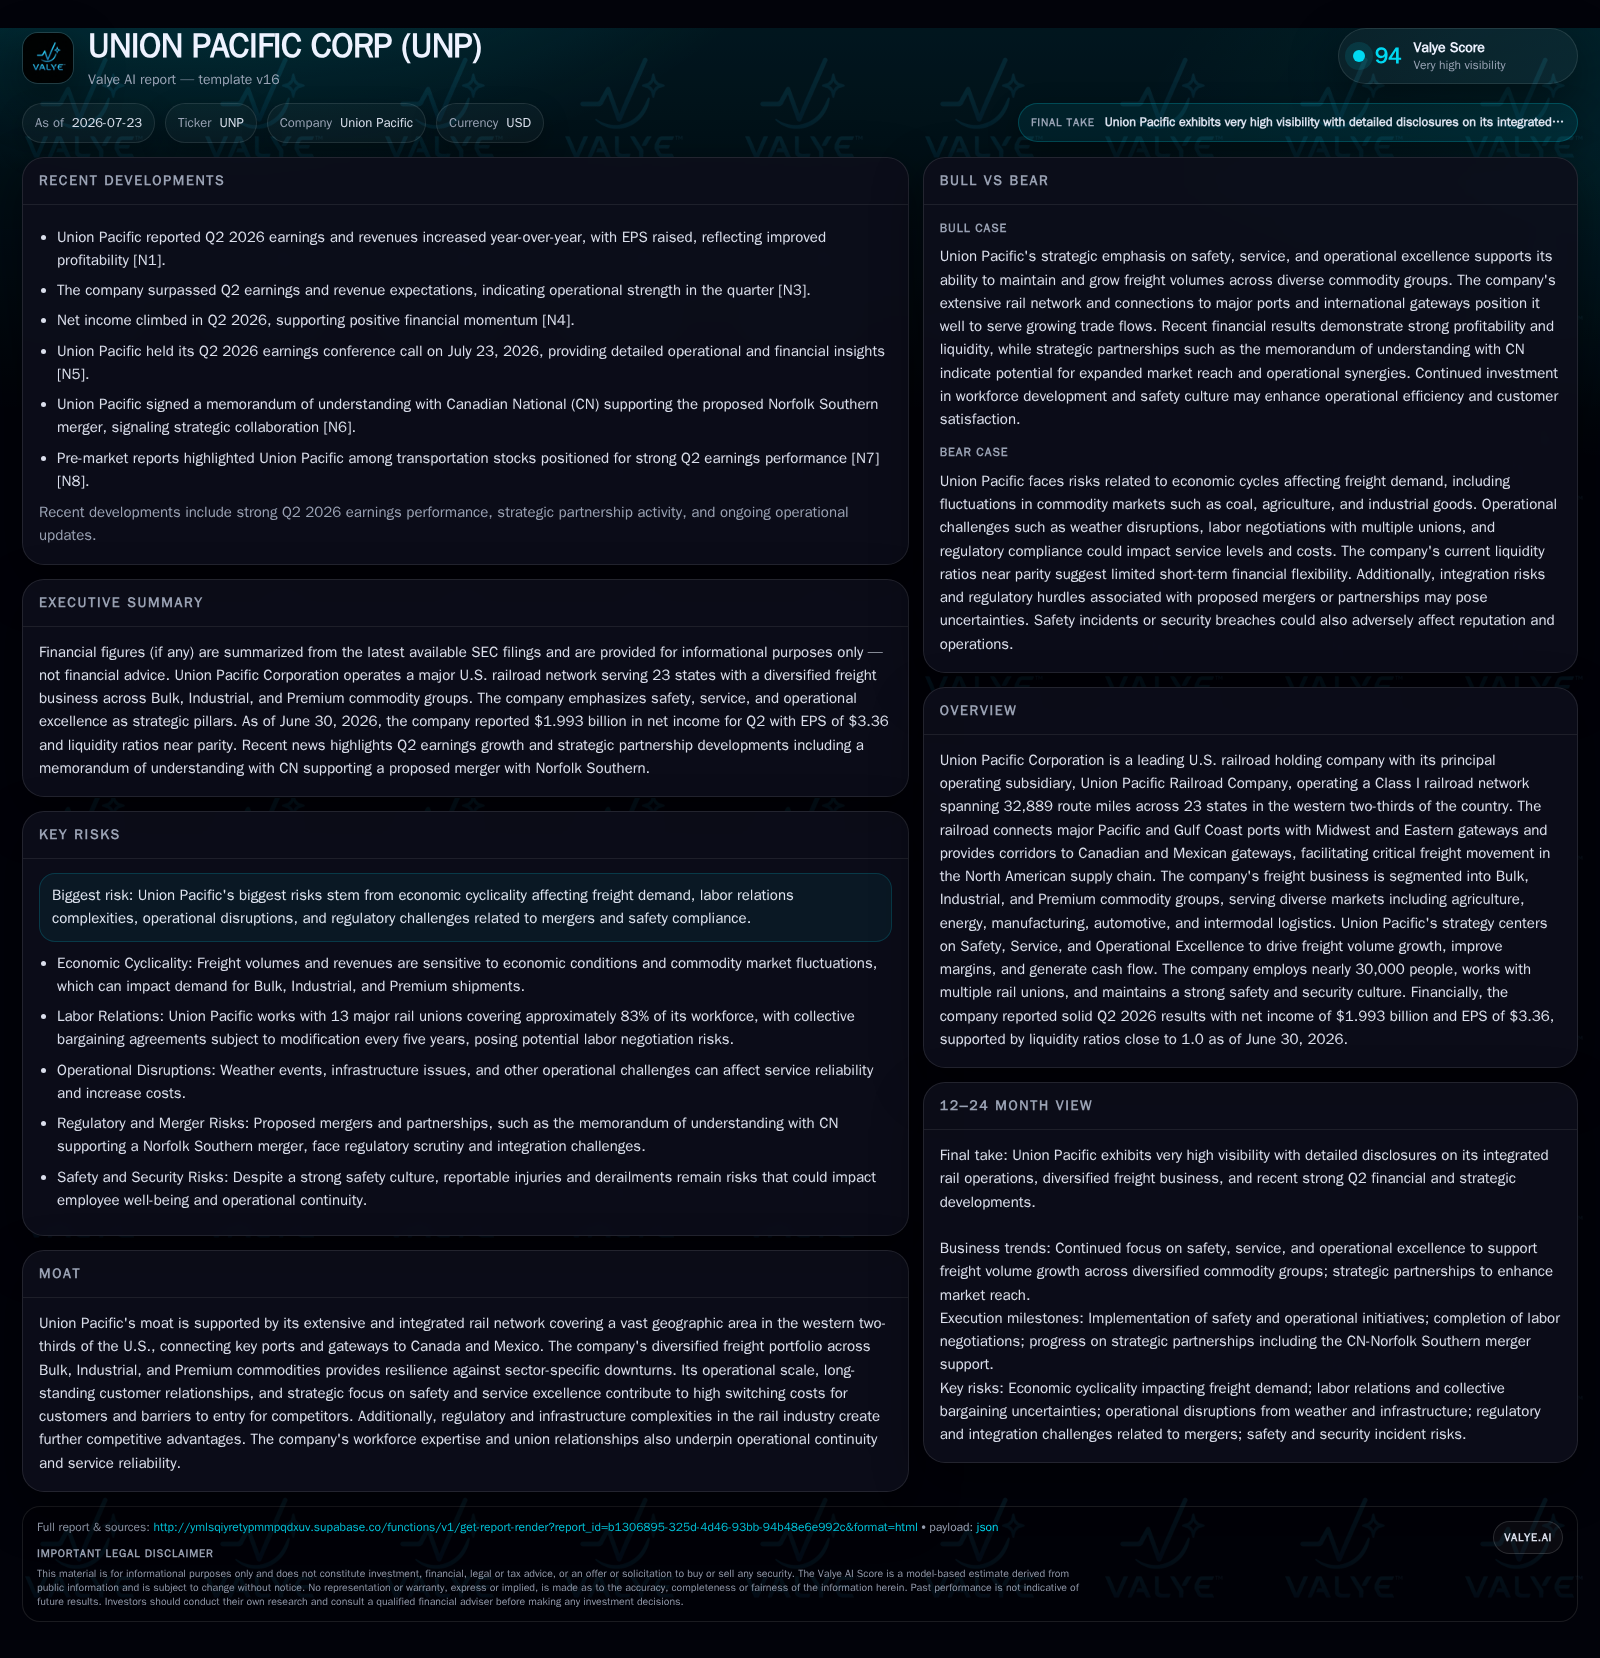
Union Pacific Corporation reported solid second-quarter results anchored in freight volume growth across diversified commodity groups, driven by its extensive U.S. rail network connecting key ports and gateways. The company’s strategic focus on safety, service, and operational excellence supports sustained margin improvement despite capacity constraints and regulatory complexities. Growth is underpinned by strong intermodal logistics expansion and increasing demand for bulk and industrial freight transport, balanced against risks including economic cyclicality, labor relations, and environmental compliance.
Recent Operating Update: Q2 2026 Performance Highlights
Union Pacific Corporation reported solid second-quarter results for 2026, driven by freight volume growth across its diversified commodity segments. The company experienced increased carloads shipped in Bulk, Industrial, and Premium categories, reflecting strong demand for agricultural products, automotive parts, and intermodal containers [S2][N1]. This volume expansion contributed to revenue growth and underscored Union Pacific’s strategic focus on enhancing service reliability and operational excellence.
Despite facing network capacity constraints amid surging shipment demand, Union Pacific implemented operational improvements such as enhanced yard management and maintaining resource buffers to preserve train velocity and on-time delivery performance—key service metrics for customer satisfaction [S2][S1]. The railroad’s Class I network spans 32,889 route miles across 23 states, connecting major West Coast and Gulf Coast ports to Midwest and Eastern U.S. markets, as well as providing exclusive access to all six major Mexico gateways [S1]. This extensive geographic coverage supports diversified freight flows and underpins the company’s competitive positioning.
Business Model Specifics: Freight Revenue Mechanics
Union Pacific generates revenue primarily by transporting freight commodities over its rail network, charging customers based on volume metrics such as carloads and freight ton-miles, distance hauled, commodity classification, and service level, including premium expedited handling for time-sensitive shipments [S1]
The Bulk segment, accounting for roughly one-third of freight revenues, includes agricultural products like grain, coal, and renewable energy commodities. This segment exhibits seasonal volume patterns aligned with crop cycles but is sensitive to energy market fluctuations affecting coal demand [S14][S25]. The Industrial segment, representing approximately 37% of revenues, encompasses chemicals, plastics, metals, and construction materials, blending cyclical industrial demand with infrastructure-related shipments. Premium commodities include finished automobiles and international containerized cargo, supporting growth in intermodal logistics centered on West Coast port connectivity [S16][S19].
Revenue variability is influenced by freight volume fluctuations tied to macroeconomic factors such as construction activity and agricultural harvests [S1][S27]. Pricing power derives from long-term customer contracts and high switching costs embedded in supply chains reliant on Union Pacific’s unique network access, particularly cross-border corridors into Mexico. Cost structure drivers include fixed investments in track infrastructure and rolling stock maintenance, alongside variable expenses such as labor—where union agreements affect operational flexibility—and fuel costs sensitive to market volatility.
Industry Structure and Competitive Position
As a leading Class I railroad, Union Pacific competes primarily with other major U.S. freight railroads such as BNSF Railway, CSX Corporation, and Norfolk Southern (pending merger), as well as regional and short-line railroads and trucking companies serving as modal alternatives. Its competitive advantage stems from unmatched network scale and geographic coverage across the western two-thirds of the U.S., combined with extensive intermodal hubs facilitating domestic and international freight flows.
The company’s diversified commodity mix across Bulk, Industrial, and Premium segments reduces exposure to sector-specific downturns. High customer retention is supported by significant switching costs and contractual commitments, reinforcing stable revenue streams [S2]. Key operational KPIs such as operating ratio—a measure of cost efficiency calculated as operating expenses divided by operating revenue—train velocity, and network utilization rates are central benchmarks. Union Pacific aims to maintain an industry-leading operating ratio through disciplined cost control and service quality enhancements that minimize delays and safety incidents
Growth Drivers
Growth prospects are anchored in expanding freight ton-miles driven by increased North American trade volumes, particularly underpinned by Mexico-U.S.-Canada trade agreements that enhance cross-border freight flows via Union Pacific’s exclusive gateway access [N10]. The modal shift favoring rail over trucking, motivated by rail’s lower greenhouse gas emissions per ton-mile and rising road congestion costs, supports intermodal logistics expansion.
Capital investments targeting capacity enhancements—such as yard expansions, signal system upgrades, and locomotive fleet modernization—are designed to improve network velocity and throughput without proportionally increasing fixed costs [S1]. Technological advancements in precision scheduling and predictive maintenance further contribute to operational excellence by reducing downtime and improving asset utilization.
Union Pacific’s position as the largest car carrier west of the Mississippi River also supports growth in automotive logistics amid reshoring trends, which increase domestic vehicle transport demand [S19]. Seasonal commodity peaks and evolving consumer supply chain requirements inform targeted marketing and operational strategies to capture incremental volume gains.
Risks and Watchpoints
Union Pacific faces risks typical of the railroad industry, including economic cyclicality that affects freight demand and volume, potentially increasing unit operating costs due to less efficient asset utilization during downturns [S1][S28]. Labor relations remain a critical factor, as collective bargaining agreements constrain workforce flexibility necessary to respond to sudden volume changes; labor disruptions could materially impact shipment continuity.
The company’s transportation of hazardous materials, including crude oil and toxic inhalation hazards, exposes it to potential liabilities exceeding insurance coverage in the event of accidents, with reputational and financial consequences [S1]. Regulatory risks include uncertainties around merger approvals (notably the proposed Norfolk Southern merger), evolving safety compliance mandates, and tariff policies that could affect cross-border trade volumes [S21][S23].
Operational challenges such as weather-related disruptions (e.g., floods, wildfires) pose risks to network fluidity and delivery reliability. Capacity constraints and congestion may pressure average train velocities if capital projects do not keep pace with demand surges.
Key Metrics and Monitoring Points
Monitoring freight volume trends by commodity segment will provide insight into sustained market demand or emerging softness. Operating ratio trends will indicate the company’s ability to manage inflationary pressures and maintain margin resilience. Progress on capital expenditure projects will be critical to alleviating capacity bottlenecks and preserving service levels.
Regulatory developments, particularly regarding merger approvals, will influence future network scale and integration risks. Labor negotiations outcomes will be pivotal for workforce stability and operational continuity. Safety performance metrics, including accident and incident rates, will reflect the effectiveness of risk mitigation efforts.
Financial Profile Discussion
As of June 30, 2026, Union Pacific held $1.61 billion in cash and cash equivalents against current liabilities of $5.61 billion and current assets of $5.53 billion, resulting in a current ratio of approximately 0.99, indicating tight but adequate short-term liquidity management [F1]. The company’s total debt stood near $33.5 billion as of year-end 2025, with net debt around $31.9 billion after accounting for cash reserves, reflecting the capital-intensive nature of the railroad industry and ongoing investments in infrastructure and rolling stock [F1].
Financial covenants tied to credit ratings require maintaining leverage ratios within prescribed limits, making operating performance—particularly return on invested capital (ROIC) and operating ratio—key metrics influencing financing flexibility and cost of capital [S15][S22].
This analysis is based on publicly available information as of July 23, 2026, primarily sourced from Union Pacific’s latest SEC filings including the Form 10-Q and Form 8-K, supplemented by third-party industry insights. It is intended for informational purposes and does not constitute investment advice or research views.
Disclaimer: This is research-only, informational analysis and not investment advice. It may include AI-generated interpretation and general industry context. Always verify important details using primary sources.

Comments