
Wyndham Hotels & Resorts Leverages Asset-Light Franchise Model Amid Modest Liquidity Constraints
Q2 2026 results show Wyndham's steady franchise growth and disciplined capital allocation amid sector cyclicality and elevated leverage.
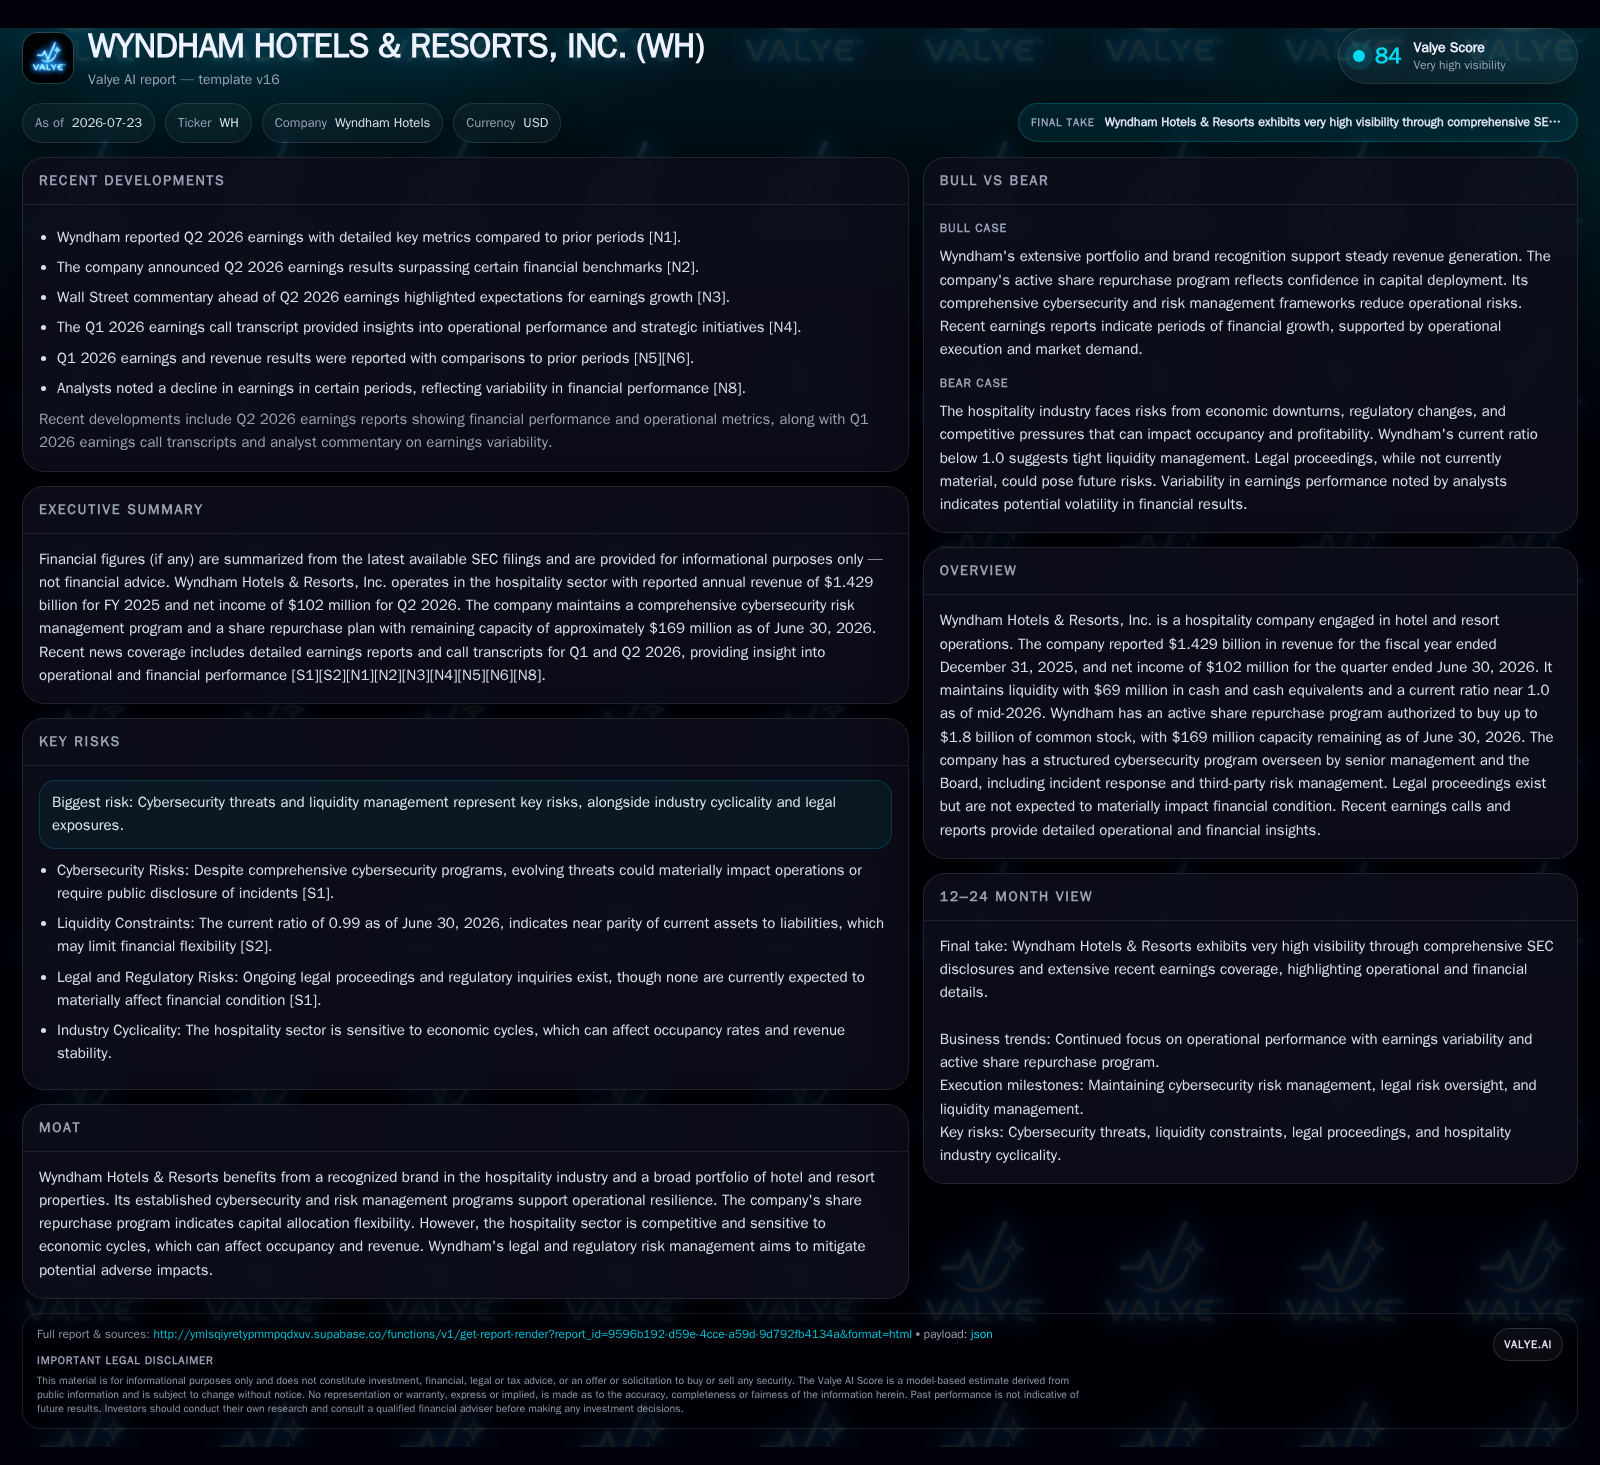
Wyndham Hotels & Resorts reported solid operational resilience in Q2 2026 with net income of $102 million, supported by stable franchise and management fee revenues amid ongoing economic headwinds in the hospitality sector. Its asset-light franchising model underpins recurring fee streams and efficient capital deployment, evidenced by an active share repurchase program with $169 million remaining capacity. However, liquidity metrics remain tight with a current ratio near 1.0 and net debt around $2.6 billion, reflecting a significant leverage profile relative to cash on hand. The company’s robust cybersecurity oversight further mitigates operational risks, but cyclical demand fluctuations and elevated debt require monitoring as travel patterns evolve.
Q2 2026 Earnings Highlight Stable Franchise Revenue amid Cyclical Hospitality Pressures
Wyndham Hotels & Resorts reported net income of $102 million for Q2 2026, reflecting operational resilience despite ongoing economic headwinds in the hospitality sector [S2], [N1], [N2]. The company’s revenue streams remained anchored by stable franchise and management fees, which are primarily driven by occupancy rates and average daily rates (ADR) across its portfolio of franchised and managed properties. This steady performance underscores the durability of Wyndham’s asset-light business model in a cyclical environment.
Asset-Light Franchise Model Underpins Recurring Fee Revenue and Capital Efficiency
Wyndham operates predominantly under an asset-light franchising and management contract model, similar to peers such as Marriott International and Hilton Worldwide [S1]. Instead of owning hotel properties, Wyndham licenses its brand to third-party hotel owners who pay franchise fees based on room revenues and occupancy levels. Additionally, Wyndham earns management fees from contracts where it oversees hotel operations on behalf of property owners.
This model generates recurring, royalty-like fee income that scales with system-wide occupancy and ADR without the capital intensity and operating risks associated with property ownership. By leveraging its brand portfolio, reservation systems, and operational support infrastructure, Wyndham achieves higher operating margins relative to asset-heavy hotel operators or real estate investment trusts (REITs). However, this structure also exposes Wyndham to reputational risks tied to the service quality delivered by third-party operators.
Brand Loyalty and Distribution Strategy Enhance Competitive Positioning
Wyndham’s diversified brand portfolio targets multiple customer segments, ranging from economy travelers to upscale resort guests, positioning it competitively against peers like Choice Hotels International, which focuses more on economy and midscale segments [S1]. The company’s brand loyalty programs are critical in driving repeat visitation and increasing average length of stay by rewarding frequent customers with points redeemable across its network.
The company actively manages its distribution channel mix, balancing direct bookings through its corporate websites against third-party online travel agencies (OTAs). Direct bookings typically yield higher margins by avoiding OTA commission fees, making channel optimization a key lever for improving average daily rate (ADR) and revenue per available room (RevPAR). Geographic diversification across regions also helps mitigate seasonality and localized travel disruptions, smoothing revenue volatility.
Capital Allocation Balances Share Repurchases with Elevated Leverage
As of June 30, 2026, Wyndham held $69 million in cash and cash equivalents against total debt of approximately $2.675 billion, resulting in a net debt position near $2.606 billion and a current ratio of 0.99, indicating modest liquidity tightness [F1]
The company’s share repurchase program remains active, with approximately $169 million of authorized capacity remaining as of Q2 2026. During the quarter, Wyndham repurchased over 650,000 shares at an average price of about $82 per share, reflecting disciplined capital deployment within its leverage constraints [S2], [S3]. Compared to peers such as Marriott, which often maintain stronger liquidity buffers, Wyndham’s approach appears cautious but committed to shareholder returns.
This capital management strategy reflects the tradeoff between maintaining liquidity to navigate the hospitality sector’s cyclicality and deploying excess cash toward buybacks or strategic investments, including technology upgrades and loyalty program enhancements.
Risk Factors: Economic Cyclicality, Cybersecurity Oversight, and Liquidity Management
Wyndham’s financial results remain sensitive to macroeconomic factors influencing travel demand, including recessions, geopolitical events, and competition from alternative lodging platforms such as Airbnb [S1], [S2]. Occupancy rates and ADR are key operating metrics that directly affect franchise and management fee revenues.
Operationally, Wyndham maintains a robust cybersecurity governance framework led by a Chief Information Security Officer (CISO) with over 20 years of industry experience. The Information Risk Committee, chaired by the CISO and including senior executives from legal, finance, and compliance, oversees cybersecurity policies, incident response planning, and risk mitigation efforts. The company conducts biannual access management audits and annual tabletop exercises with external consultants to test its Cybersecurity Incident Response Plan, with quarterly reporting to the Board’s Audit Committee [S1]. No material cybersecurity incidents have been reported recently.
Legal proceedings are typical for the industry and are not expected to materially impact Wyndham’s financial condition [S1]. However, the company’s elevated net debt and near-unity current ratio necessitate vigilant liquidity and refinancing risk management, especially in a rising interest rate environment or tightening credit markets [F1].
Growth Drivers: Expanding Franchise Base, Loyalty Program Enhancements, and Technology Investments
Wyndham’s growth prospects are supported by secular trends in global leisure and business travel recovery, alongside strategic expansion of its franchised and managed property base [S1], [N3]. Increasing the number of properties under management directly scales recurring fee revenues tied to occupancy and ADR.
Enhancements to the company’s loyalty programs aim to deepen customer engagement and increase repeat stays, which can improve occupancy and RevPAR metrics. Concurrently, investments in technology, including upgrades to booking platforms and property management systems, seek to improve conversion rates across digital channels and enhance the guest experience.
Selective geographic expansion, particularly into emerging markets with growing tourism demand, and potential strategic partnerships or acquisitions could further diversify Wyndham’s revenue streams and reduce dependence on mature, highly competitive markets.
Key Operating Metrics and Monitoring Points
Critical near-term indicators include sustained improvements in occupancy rates and ADR, which together drive RevPAR growth and, consequently, franchise and management fee revenues [S2]. Monitoring the distribution channel mix is also essential, as shifts toward higher-margin direct bookings can enhance profitability.
Additionally, margin maintenance amid seasonal fluctuations and effective leverage management remain important to preserve financial flexibility. Given the company’s asset-light model, controlling operating expenses and capital expenditures while supporting system growth will be key to sustaining profitability.
Financial Position and Liquidity Overview
As of June 30, 2026, Wyndham’s balance sheet reflects $69 million in cash and equivalents against $2.675 billion in total debt, yielding a net debt position of approximately $2.606 billion [F1]. Current assets totaled $497 million versus current liabilities of $503 million, resulting in a current ratio of 0.99, indicating a tight but manageable liquidity position [F1].
This financial profile underscores the importance of stable recurring fee income streams derived from franchise and management contracts to service debt obligations and fund ongoing capital allocation initiatives. The company’s ability to sustain occupancy-driven royalties and manage working capital efficiently will be critical to mitigating liquidity risks.
Disclaimer: This is research-only, informational analysis and not investment advice. It may include AI-generated interpretation and general industry context. Always verify important details using primary sources.

Comments