
Cimpress Q3 2026 Update Highlights Revenue Resilience Amid Margin Pressures and Leverage Considerations
Recent quarterly results show Cimpress sustaining top-line demand while managing operational challenges and financial leverage.
Cimpress plc's latest quarterly filing for Q3 fiscal 2026 reveals a business navigating stable demand in mass customization with margin pressures from cost inflation and supply chain dynamics. The company’s proprietary technology platform and global production network underpin its market position, yet near-term growth faces constraints from rising costs and leverage levels. Key growth drivers include expansion in web-to-print solutions and personalized product offerings, but watch for liquidity and efficiency metrics as management balances reinvestment and capital structure.
Recent Operating Update
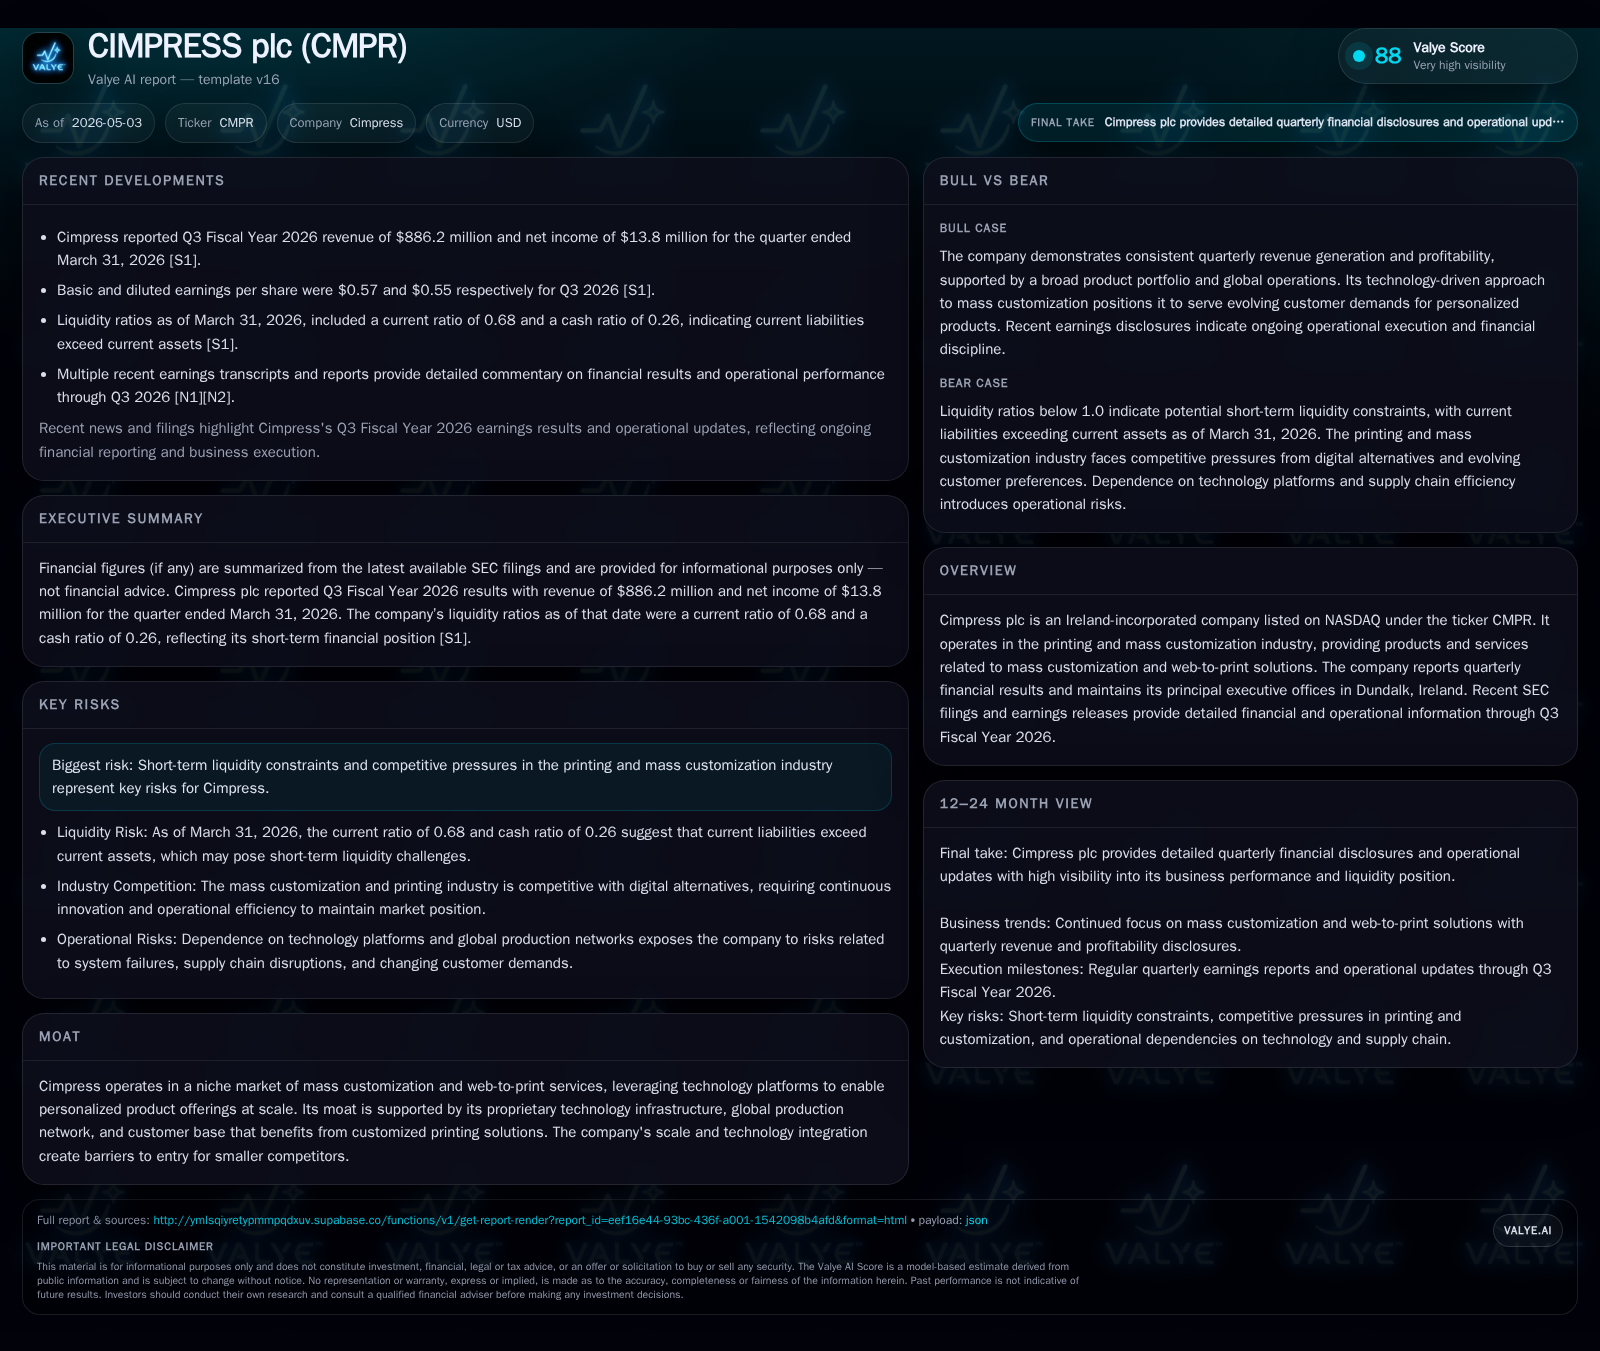
Cimpress plc disclosed its Q3 Fiscal Year 2026 results on April 29, 2026, through an official earnings document filed as Exhibit 99.1 in its Form 8-K on the same date [S3][S13]. The filing underscores sustained revenue performance driven by ongoing demand for customized printing products accessed via Cimpress’s proprietary web-to-print platforms. However, operating income faced headwinds largely attributable to cost increases in raw materials and supply chain logistics that weighed on margins.
Despite these pressures, Cimpress maintained robust operational throughput across its global manufacturing sites. Management highlighted active initiatives aimed at efficiency gains within fulfillment operations alongside selective investment in technology enhancements that improve customer experience and order processing speed [S2].
Liquidity metrics reveal a current ratio of approximately 0.68, underpinned by cash and equivalents near $189 million against current liabilities of around $730 million as of quarter-end March 31, 2026 [F1]. Total debt sits at about $1.6 billion resulting in net debt roughly $1.42 billion post-cash—all signaling notable leverage that requires careful monitoring when assessing financial flexibility.
A significant development includes the Board’s authorization of up to $200 million in share repurchases without expiration, subject to satisfying leverage thresholds as outlined in earlier communications—reflecting management's intent to return capital prudently while balancing balance sheet constraints [S12].
Business Model Overview
Cimpress primarily generates revenue by facilitating the mass production of customized printed products using an integrated web-to-print e-commerce model. Customers engage online to design or personalize products ranging from marketing materials like business cards and banners to consumer-facing items such as photo gifts.
The company commands strategic strengths through its proprietary technology stack that automates customization workflows combined with a distributed network of production facilities globally positioned to optimize delivery timelines and costs. This vertically integrated approach differentiates Cimpress versus traditional print providers reliant solely on local print shops.
Revenue is driven by customer order volume as well as average selling price influenced by product mix variations—higher-margin personalized goods contribute positively while commoditized categories pressure blended margins. Repeat customer retention is supported by a user-friendly online interface and brand recognition in niche markets for customization.
Margins hinge on efficient utilization of complex manufacturing assets, supply chain cost controls, pricing power to offset inflation, and technological innovation reducing unit costs per customized order.
Industry Structure and Competitive Position
Within the mass customization printing sector, Cimpress occupies a unique position as one of the few large-scale consolidators integrating tech-enabled marketplaces with global manufacturing infrastructures. This confers scale economies prohibitive for smaller entrants attempting broad geographic coverage or product breadth.
Competition arises from several fronts: smaller specialized web-to-print platforms exploit niche categories with agile technology; large traditional printers attempt digital upgrades; and new entrants explore AI-driven design services.
Cimpress’s moat is fortified by its long-standing investments in platform technology coupled with logistical assets that enable rapid fulfillment across multiple countries—a capability not easily replicated given capital intensity.
Nonetheless, competitive risks persist, including potential erosion of pricing due to commoditization effects in standard printing segments, plus pressure to continually innovate technical aspects of customer customization tools.
Growth Drivers
The company’s path to growth centers on several facets:
- Expanding Product Offerings: Broadening beyond traditional print into higher-margin personalized merchandise categories taps consumer willingness for bespoke goods.
- Technology Enhancement: Improving AI-assisted design interfaces reduces friction for customers creating complex customizations and potentially increases order frequency.
- Global Fulfillment Network Scaling: Increasing automation and capacity utilization within facilities drives operating leverage benefits amid fluctuating demand cycles.
- International Market Penetration: Localization efforts including language support and regional marketing bolster new customer acquisition.
These drivers are fundamentally supported by measurable KPIs such as active customer counts, average order value shifts, repeat purchase rates, facility throughput levels, and cost per order metrics monitored internally though not disclosed explicitly this quarter.
Risks and Watchpoints
Key risks largely revolve around financial health and operational efficiency:
- Leverage Constraints: Elevated net debt relative to cash flow generation narrows financial flexibility for opportunistic investments or downturn resilience [F1].
- Margin Pressures: Rising input prices challenge profitability unless offset by price increases or productivity improvements—a delicate balance given competitor pricing dynamics [S2].
- Demand Cyclicality vs Structural Growth: While customization demand appears structurally growing due to consumer trends toward personalization, macroeconomic slowdowns can induce cyclical volume softness.
- Technological Competition: Accelerating innovation from nimble startups could threaten Cimpress’s technology leadership without continuous investment.
- Capacity Bottlenecks: Manufacturing throughput limits could constrain ability to capitalize fully on increased order volumes until further capital deployment occurs.
Monitoring these factors is central to understanding Cimpress’s near-term execution risks.
What to Watch Next
Subsequent reporting cycles should clarify how effectively Cimpress manages inflationary pressures and leverages its fulfillment network expansion plans. Particular attention should be paid to:
- Quarterly updates on gross margin trends adjusting for cost pass-throughs.
- Customer acquisition velocity and retention statistics indicative of platform stickiness.
- Capital expenditure announcements related to capacity expansion or technology rollouts.
- Liquidity improvements or deleveraging progress driven by cash flow raise or asset optimization.
- Management commentary on competitive positioning amid evolving industry tech shifts.
These milestones will form crucial data points for evaluating sustainable growth prospects versus tactical headwinds.
Financial Profile (Latest Quarter Snapshot)
Latest financial snapshot
| Metric | Value | Period |
|---|---|---|
| Cash & equivalents | $189mm | |
| 2026-03-31 | ||
| Total debt | $1605mm | |
| 2026-03-31 | ||
| Net debt | $1416mm | |
| 2026-03-31 | ||
| Current assets | $496mm | |
| 2026-03-31 | ||
| Current liabilities | $730mm | |
| 2026-03-31 | ||
| Current ratio | 0.68x | |
| 2026-03-31 |
Source: SEC companyfacts cache [F1].
This snapshot reflects a leveraged balance sheet with suboptimal short-term liquidity metrics requiring vigilant capital structure management going forward [F1].
Disclaimer: This analysis is based solely on publicly available information including SEC filings up to May 1, 2026, market news through early May 2026, and validated company facts. It does not constitute investment advice or recommendations.
Disclaimer: This is research-only, informational analysis and not investment advice. It may include AI-generated interpretation and general industry context. Always verify important details using primary sources.
Comments