
Cooper Companies' Strategic Response to Litigation and Pricing Pressures in Q2 2026
Cooper Companies reported a Q2 earnings beat driven by resilient demand amid legal costs and margin pressures.
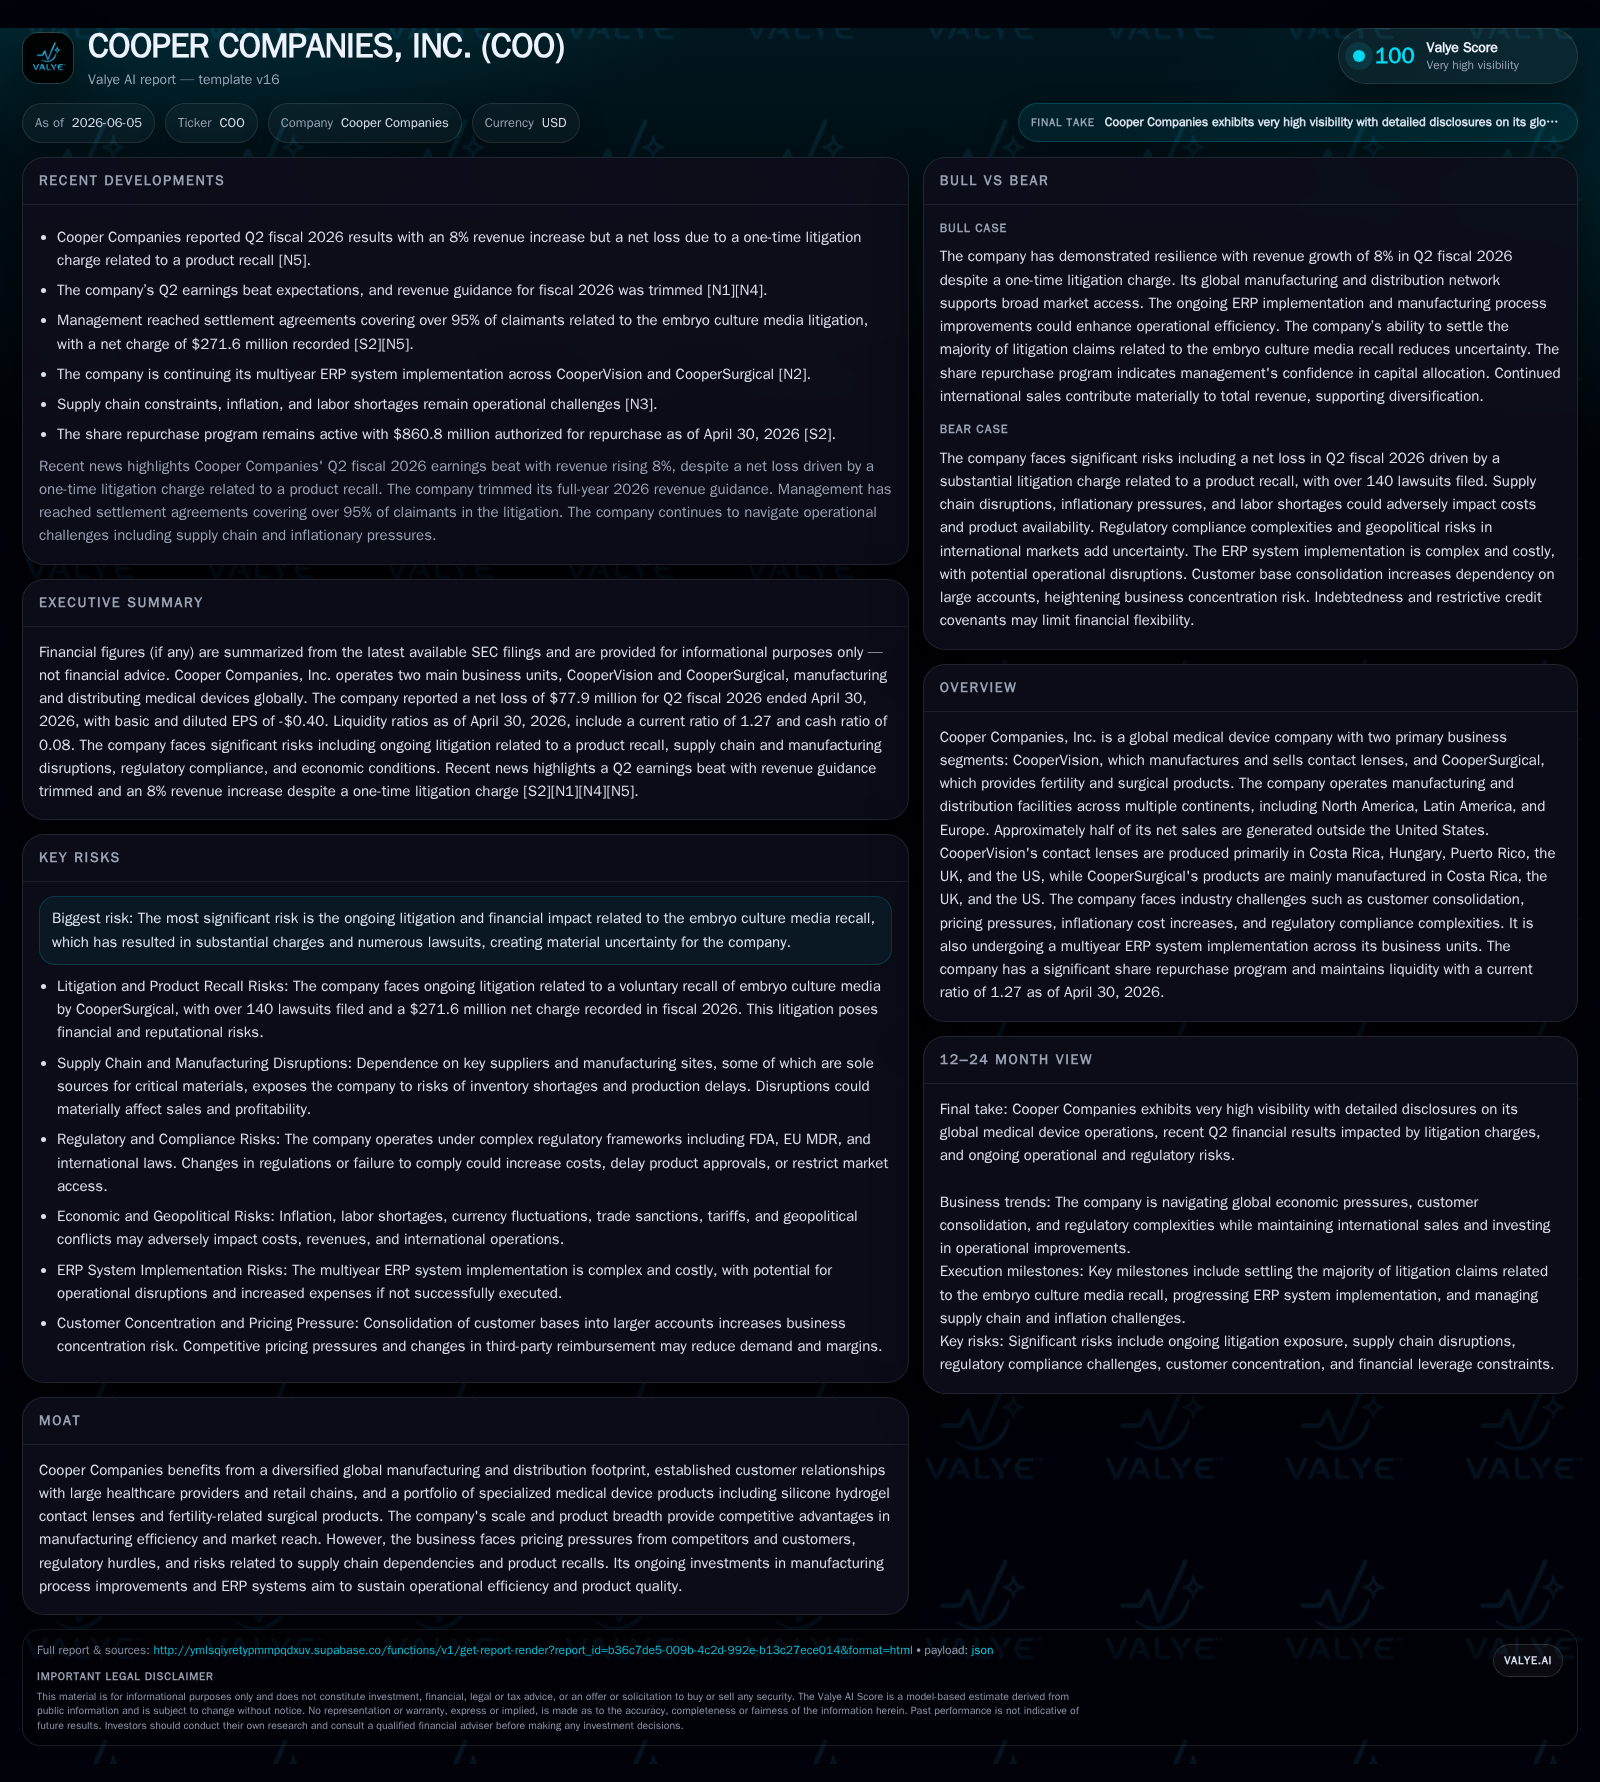
In its 2026 Q2 report, Cooper Companies demonstrated operational resilience with an 8% revenue increase, surpassing expectations despite significant headwinds from one-time litigation charges tied to an embryo culture media recall. The company faces persistent pricing pressures amid customer consolidation and inflationary cost increases, compounded by regulatory complexities and ongoing ERP system implementation risks. Cooper's dual-segment model—contact lenses via CooperVision and fertility/surgical products via CooperSurgical—benefits from global manufacturing scale and diverse customer bases but must navigate cost absorption challenges and concentrated buyer power. While scaled manufacturing operations and product innovation support growth, high leverage and legal uncertainties weigh on near-term financial flexibility.
Second Quarter Operating Highlights: Profit Beat Counters Challenges
Cooper Companies posted an 8% revenue increase in the second quarter ended April 30, 2026 [S2]. This top-line growth exceeded analyst expectations despite substantial margin pressure resulting primarily from a one-time litigation charge connected to the ongoing embryo culture media recall lawsuits [N6][S2]. Reported net income contracted due to these non-recurring expenses; however, adjusted earnings per share topped consensus forecasts, signaling underlying operational strength amid headwinds [N1][N5]. Management subsequently trimmed full-year revenue guidance to reflect uncertainties around pricing pressures and cost absorption challenges while maintaining cautious optimism about demand resilience [N1][S2].
Business Model Breakdown: Dual Divisions Serving Distinct Markets
The company’s revenue stream bifurcates across two core segments: CooperVision supplies a wide range of contact lenses focusing heavily on silicone hydrogel technology; CooperSurgical provides fertility-related surgical devices alongside diagnostic and cryostorage services [S1]. CooperVision products are predominantly manufactured in facilities located across Costa Rica, Hungary, Puerto Rico, the UK, and the US—reflecting a distributed footprint optimizing production costs and mitigating regional risk exposure [S1]. CooperSurgical's manufacturing centers are similarly spread among Costa Rica, the UK, and the US.
Approximately half of total sales originate outside the US [S1], subjecting the business to currency volatility and diverse regulatory environments. The contact lens business operates with high-volume consumables characterized by lower switching costs but stable repeat purchase behavior. Conversely, CooperSurgical offers higher-priced specialized products with greater clinical switching friction due to their role in fertility treatments conducted by hospitals and clinics [S1]. This dual division structure enables diversification yet requires distinct go-to-market strategies reflective of different customer bases: retail chains and eye care providers for CooperVision versus healthcare institutions for CooperSurgical.
Industry Structure: Customer Consolidation and Pricing Pressures
A notable theme affecting both segments is increasing consolidation among customers—large retail chains in eyewear and centralized hospital purchasing groups in fertility care—which intensifies negotiating leverage against suppliers like Cooper [S1][S16]. This concentration leads to tightening pricing power as these major accounts demand fixed price contracts or capitated pricing models aimed at cost containment [S14]. Inflationary pressures across raw materials, labor, logistics, and regulatory compliance further compress gross margins since the company cannot uniformly pass these increased costs onto end customers given competitive dynamics [S14][S16].
Peers within medtech face similar margin headwinds as reimbursement evolves alongside rising scrutiny on healthcare expenditures. This pushes Cooper toward operational improvements when product pricing flexibility remains constrained.
Sector Insights: Manufacturing Complexity and Regulatory Costs
Operating multiple manufacturing sites globally is a double-edged sword. Economies of scale exist but managing quality control standards across jurisdictions with varying regulatory scrutiny introduces complexity [S1][S25][S29]. For medical devices particularly in fertility treatments requiring stringent certifications (FDA clearances, EU MDR compliance), any manufacturing disruption can lead to costly recalls or lost market authorization.
Regulatory environment tightening—especially post-Roe reversal impacting access legislation for reproductive technologies—and EU medical device regulations raise compliance costs that elevate fixed overheads [S10][S23]. Moreover, ongoing geopolitical trade frictions add import/export uncertainty affecting raw material access.
The current multi-year ERP system implementation across Cooper’s divisions aims to streamline IT infrastructure supporting supply chain management, data integrity, and internal controls; however, such rollouts often trigger temporary disruption risks impacting production scheduling or order fulfillment [S1][N3]
Growth Drivers: Penetration, Innovation, and Operational Efficiencies
Despite short-term challenges, Cooper’s growth potential arises from several vectors: continued adoption of advanced silicone hydrogel lenses which command higher prices due to comfort benefits; expansion of global fertility procedures underpinned by demographic trends driving demand for assisted reproduction therapies; and scaling production efficacy through process improvements post-ERP stabilization [N2][N3][S1]
Unit growth metrics tracked in Q2 reflect steady procedure volume increases globally offsetting some pricing pressures. The company’s salesforce productivity gains target more effective engagement with large healthcare systems leveraging specialized knowledge of fertility protocols—a higher friction sales cycle demanding clinically differentiated solutions [N3]. International markets remain a vital frontier given roughly half of revenues stem abroad but require navigating diverse reimbursement landscapes.
Risks and Constraints: Litigation Fallout, Inflation, and System Upgrades
The preeminent risk remains the ongoing embryo culture media recall litigation producing substantial provisions that materially reduce quarterly earnings [S4][N6]. This legacy issue injects uncertainty over ultimate financial impact and demands considerable management attention.
Coupled with persistent inflationary cost burdens eroding margins where price increases lag cost trends poses structural pressure on profitability. The consolidated buyer landscape limits immediate pass-through capability leaving operating leverage vulnerable.
ERP implementation introduces execution risk during transition phases; disruptions here could compound operational issues already stressed by supply-chain challenges. Workforce retention also remains pressured amid high inflation environments exerting wage demands within specialized manufacturing personnel pools [S6]
Financially, significant leverage levels near $1.86 billion total debt against cash balances around $139 million constrain nimbleness in capital deployment for new investments or acquisitions during this turbulent period [F1]
Outlook & What Investors Should Monitor Next
Looking forward into H2 2026, investors should focus on sequential performance indicators notably margin trajectories signaling successful inflation absorption or further compression. Monitoring resolutions or progress regarding litigation settlements will be crucial for clarity on pro forma earnings power.
Equally important are milestones marking completion phases or operational stability advances related to the ERP rollout—a key enabler for future cost rationalization initiatives.
Finally, changes in competitive dynamics including competitor pricing responses within contact lens markets or shifts in fertility treatment protocols affecting device utilization rates represent external variables influencing medium-term growth viability [N1][N3]
Financial Profile Snapshot: Leveraging Scale Amid Disruption
At quarter-end April 30, 2026, Cooper Companies held cash and equivalents totaling approximately $139 million juxtaposed with about $1.86 billion total debt indicating a net leverage position exceeding $1.7 billion [F1]. The current ratio stood at a moderate 1.27x evidencing sufficient short-term liquidity though not ample cushion given inherent business risks [F1].
While scale advantages persist supporting manufacturing efficiencies across global sites plus diversified customer reach undergird core resilience factors, financial flexibility is somewhat constrained until legal matters resolve allowing normalized earnings retention.
This analysis incorporates publicly filed SEC documents through June 5, 2026 ([S1], [S2], [S3]) alongside recent market commentary ([N1], [N3], [N6]) aiming to present an informed view devoid of speculative assumptions or investment research views.
Financial position in context
As of 2026-04-30, companyfacts shows $139mm in cash and equivalents and $1861mm of total debt [F1]. The same snapshot implies net debt of roughly $1723mm, keeping balance-sheet context relevant but secondary to the operating story [F1]. Current assets of $2.3bn and current liabilities of $1805mm imply a current ratio near 1.27x for 2026-04-30 [F1].
Disclaimer: This is research-only, informational analysis and not investment advice. It may include AI-generated interpretation and general industry context. Always verify important details using primary sources.
Comments