
ConocoPhillips’ Resilient Growth and Capital Strategy Amid Market Fluctuations
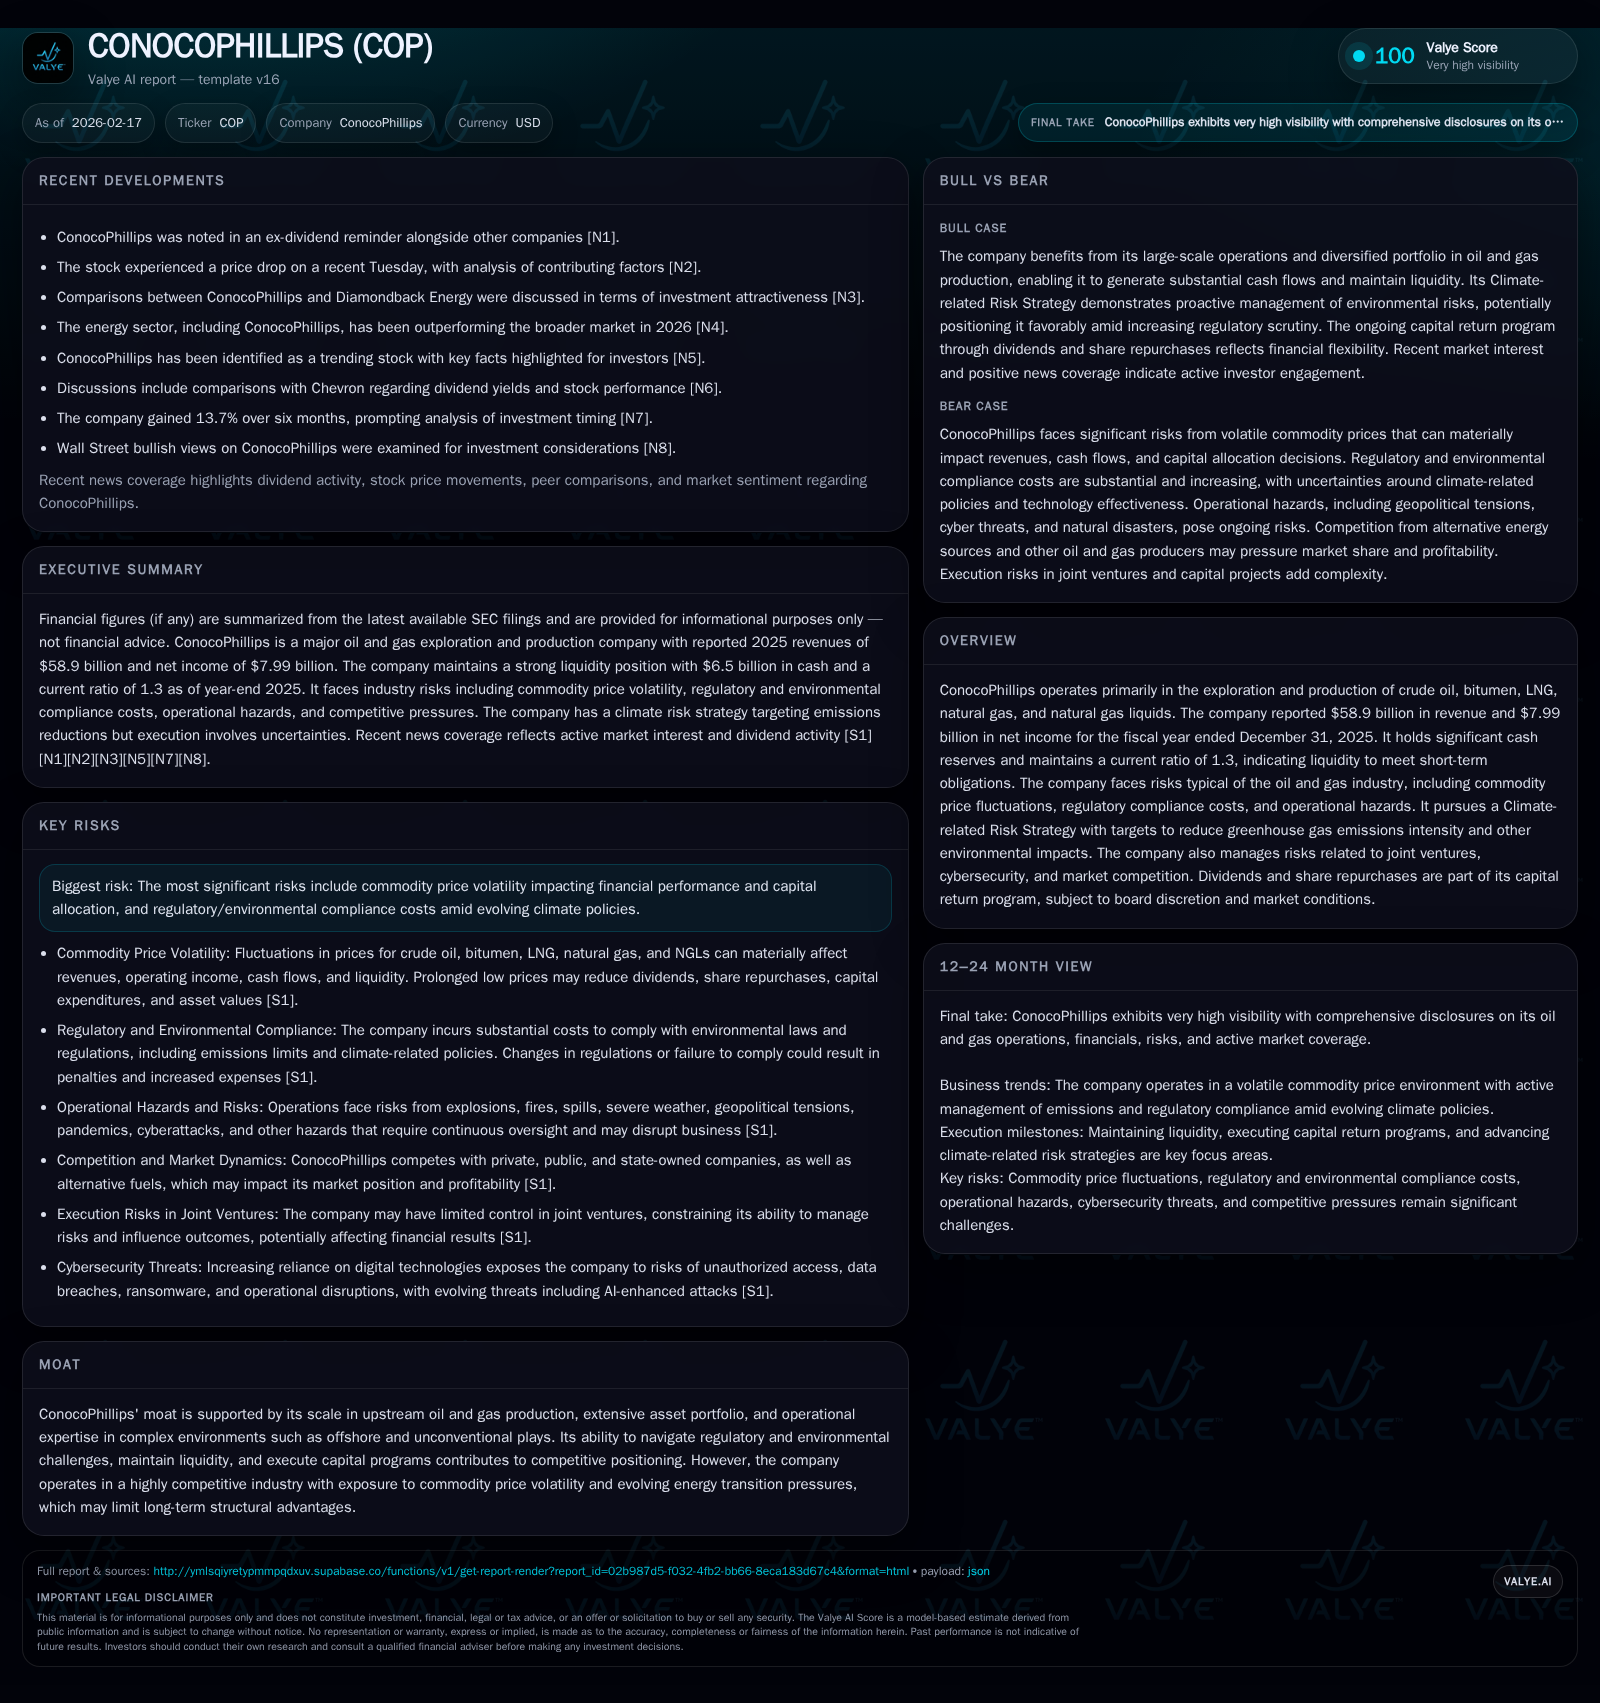
ConocoPhillips demonstrated revenue growth in 2025 despite profit margin pressures from volatile commodity prices and increased capital expenditures.
In fiscal year 2025, ConocoPhillips posted $58.9 billion in revenue, a 7.7% increase year-over-year, reflecting robust operational scale amid fluctuating oil and gas prices. Net income declined by 13.6%, pressured by lower realized commodity prices and a substantial 90.8% surge in capital spending to advance long-term projects. The company's liquidity remains solid with a current ratio of 1.3 and operating cash flow steady at nearly $20 billion. It sustained disciplined capital allocation, paying nearly $4 billion in dividends and repurchasing over $5 billion in shares, balancing shareholder returns with reinvestment in its diverse upstream portfolio. Regulatory headwinds and climate-related compliance costs pose ongoing challenges, while the firm’s extensive offshore and unconventional assets underpin its competitive moat. Future growth hinges on reserve replacement success, market price stability, and execution of emissions reduction initiatives.
Revenue and Earnings Trajectory: Drivers Behind Recent Performance
During fiscal year 2025, ConocoPhillips reported revenues of approximately $58.9 billion, marking a solid 7.7% increase compared to the prior year’s $54.7 billion [F1]. This growth underscores the company's capacity to sustain production volumes despite pronounced commodity price swings; notably, WTI crude prices oscillated between $80 per barrel at the beginning of the year to a low near $55 by December [S1]. Nevertheless, net income contracted by 13.6%, declining from $9.25 billion in 2024 to roughly $8 billion in 2025 [F1]. This reflects margin compression as lower realized prices outpaced gains from volume resilience.
Operating cash flows remained relatively steady around $19.8 billion (down marginally by 1.6% YoY), indicating consistent underlying cash generation even during these headwinds [F1]. The divergent trajectory between top-line expansion and bottom-line contraction suggests increased costs or non-price related operational pressures influencing profitability.
Historical performance (annual)
| FY | Rev ($bn) | Net ($bn) | CFO ($bn) | Rev YoY | Net YoY |
|---|---|---|---|---|---|
| 2025 | 58.9 | 8.0 | 19.8 | +7.7% | -13.6% |
| 2024 | 54.7 | 9.2 | 20.1 | -2.5% | -15.6% |
| 2023 | 56.1 | 11.0 | 20.0 | -28.5% | -41.3% |
| 2022 | 78.5 | 18.7 | 28.3 |
Note: Omitted columns lack sufficient annual XBRL coverage in the provided tags (need ≥2 annual points): OpInc, Capex, FCF. Source: SEC companyfacts cache [F1].
Capital returns and efficiency (annual)
| FY | Div ($bn) | Buybacks ($bn) | ROE% |
|---|---|---|---|
| 2025 | 4.0 | 5.0 | 12.4 |
| 2024 | 3.6 | 5.5 | 14.3 |
| 2023 | 5.6 | 5.4 | 22.2 |
| 2022 | 5.7 | 9.3 |
Source: SEC companyfacts cache [F1].
Note: While detailed capex figures for FY23-FY25 are not fully tagged, narrative evidence confirms a sharp +90.8% increase in capex for FY25 compared to FY22 levels [F1].
Commodity Market Volatility: Impact on Production and Profits
ConocoPhillips' performance is tightly correlated with the volatile commodity landscape seen in calendar year 2025, where WTI crude oil prices fluctuated between a high of approximately $80 per barrel early in the year down to about $55 per barrel by December [S1]. This volatility pressured realized pricing across its portfolio including crude oil, bitumen, LNG, natural gas, and NGLs.
Price-driven constraints influenced unit-of-production metrics; reduced economic thresholds for reserves led to cautious revisions in proved reserves classification and negatively impacted reserve replacement ratios [S23]. Midstream limitations on gathering or transportation infrastructure further constrained operators’ ability to maintain full production rates without incurring additional costs or forced curtailments [S22].
These pricing dynamics also amplified exposure to downstream margin compression as LNG export curtailments faced lingering effects from previous policy pauses [S26]. The interplay of geopolitical risks—emerging from conflicts in key oil producing regions—and shifting regulatory outlooks compounded uncertainty around demand forecasting.
Strategic Capital Deployment: Dividends, Buybacks, and Investment Decisions
In managing capital allocation through turbulent markets, ConocoPhillips maintained payout discipline balancing shareholder returns with reinvestment imperatives [S5],[F1]. In FY25 it paid out nearly $4 billion in dividends ($3.995B), increasing modestly over prior years as earnings softened but cash flow remained robust [F1]. Concurrently, share repurchases totaled approximately $5 billion ($5.018B), slightly down from previous levels but demonstrating sustained board commitment to capital return programs.
Capital expenditures ramped dramatically with a near doubling (+90.8%) relative to prior comparable periods (noting capex figures available for FY22 at ~$10B), underscoring an investment push into long-lead offshore projects and unconventional plays requiring significant upfront outlays [F1]. This surge reflects strategic intent to bolster future production volumes despite near-term profitability pressures.
The board continues to exercise discretion shaped by liquidity levels—supported by a current ratio of approximately 1.3—and prevailing market conditions when deciding on dividend declarations or share repurchase pacing [S4],[S5]. Such flexibility remains crucial given lingering commodity price uncertainty.
Operational Footprint: Scale, Asset Complexity, and Competitive Advantage
ConocoPhillips operates one of the broadest upstream portfolios in the sector encompassing offshore deepwater fields alongside unconventional shale plays—typified by complex geotechnical challenges requiring advanced reservoir optimization techniques [N1],[S24]. The company’s expertise in managing these heterogeneous assets contributes materially to its competitive moat.
Operational risk is heightened by joint venture structures where control may be limited; navigating minority positions demands robustness in partnership governance frameworks to align economic interests effectively [S22]. Offshore environments exhibit elevated exposure due to technical complexities such as high reservoir pressures and demanding metocean conditions which escalate both capex intensity and operational hazards [S10].
Expertise cultivated through these ventures—coupled with integrated technologies improving recovery factors—positions ConocoPhillips well within an increasingly competitive milieu dominated by private equity-backed independents alongside national oil companies [S24],[S26].
Navigating Regulatory and Climate-Related Challenges
Environmental regulations impose notable cost burdens as ConocoPhillips advances its Climate-related Risk Strategy targeting reductions in Scope 1 and Scope 2 greenhouse gas (GHG) emission intensities as well as methane leakage mitigations [S6],[S24]. Multiple jurisdictions introduce evolving carbon tax regimes alongside more stringent emission standards affecting both capital planning cycles and operating expense profiles.
The EPA’s shifting rules—evidenced by delayed methane standards enforcement juxtaposed against tightened reporting requirements—increase planning complexity given uncertain policy trajectories through upcoming U.S administrations [S6],[S11]. Beyond federal mandates, state-level litigation risks related to climate change adaptation funding obligations amplify contingent liabilities exposure [S16],[S21].
Investment into low-carbon technologies such as carbon capture faces hurdles due to uncertain market acceptance or permitting delays, heightening execution risk on these fronts [S24],[S25]. Moreover, broader ESG-driven capital market dynamics influence credit ratings evaluations which incorporate environmental criteria increasingly affecting cost of capital considerations [S4],[S16].
Looking Ahead: Growth Prospects and Constraints
ConocoPhillips’ growth prospects hinge primarily upon organic resource development within its existing portfolio supplemented by selective acquisitions aligned with operational strength areas [N1],[S26]. The company benefits from liquidity adequacy enabling resilience against cyclical downturns while tactically increasing capex allocations toward high-return projects.
Nonetheless, downside risks persist stemming from unpredictable commodity price fluctuations—as illustrated during late-2025 declines—and geopolitical tensions that can disrupt supply chains or impose export restrictions limiting market access particularly for LNG exports [N2],[S20],[S26]. Regulatory hurdles around hydraulic fracturing or Arctic developments could delay sanctioned projects such as the Willow initiative impacting medium-term reserve replacement efforts [S19],[N1].
Evolving climate policies represent both potential operational cost pressures and opportunities for first-mover advantage if carbon management technologies mature effectively; however success here remains uncertain [S24],[S25]. The company must balance advancing growth with prudent capital stewardship to sustain credit profile integrity.
Key Metrics to Watch for Future Milestones
Absent explicit forward guidance on precise financial forecasts or milestone timelines within publicly disclosed documentation [N1],[N2],[S4], careful monitoring of several key performance indicators is critical:
- Reserve replacement ratio trends will reveal organic growth sustainability amid depletion pressures.
- Capex execution efficiency relative to projected project break-evens will indicate discipline amidst inflationary cost environments.
- Progress against stated emissions reduction targets reported via ESG disclosures will provide insight into climate strategy effectiveness.
- Cash flow stability vis-à-vis fluctuating commodity prices will determine capacity for ongoing dividend payments or share repurchases.
- Board announcements regarding adjustments in capital return policies may serve as barometers for management confidence in cyclical conditions.
Collectively these data points will offer nuanced understanding of ConocoPhillips’ ability to maintain growth momentum while addressing evolving structural challenges inherent within the upstream energy sector.
Disclaimer: This analysis is intended solely for informational purposes based on publicly available data as of February 17, 2026; it does not constitute investment advice or recommendations regarding securities transactions.
Disclaimer: This is research-only, informational analysis and not investment advice. It may include AI-generated interpretation and general industry context. Always verify important details using primary sources.
Comments