
DuPont’s Strategic Refocus and Capital Moves Reflect Transition Constraints and Growth Ambitions
A major reshaping of DuPont’s portfolio in 2025 set the stage for its current growth and financial profile.
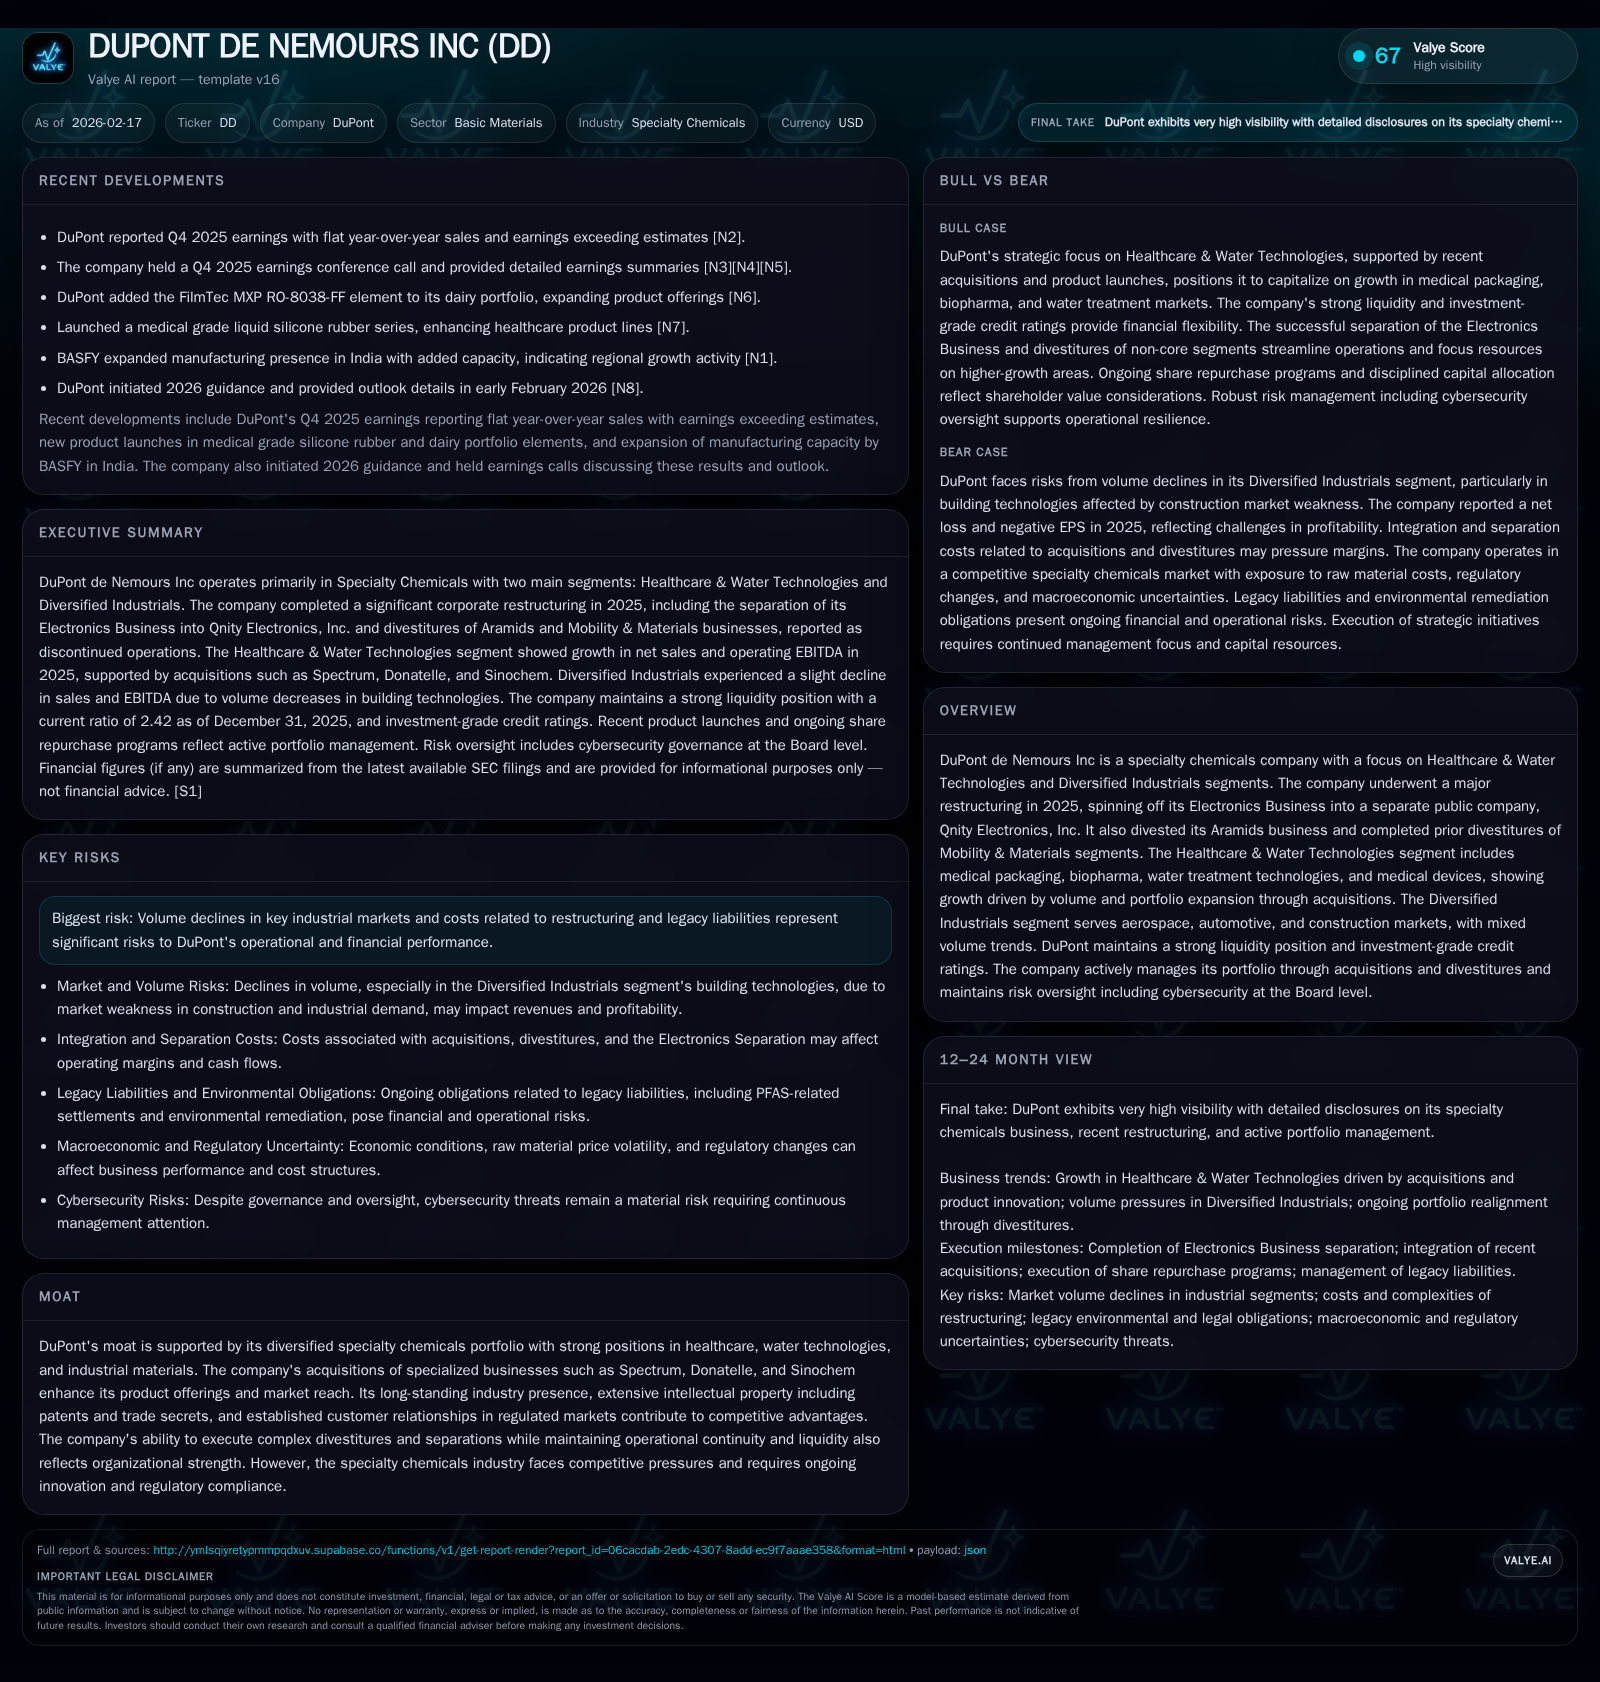
DuPont de Nemours, Inc. completed significant strategic transformations in 2025, spinning off its Electronics Business and divesting legacy segments such as Aramids and Mobility & Materials. These moves redefined its core into two segments—Healthcare & Water Technologies and Diversified Industrials—with growth driven by healthcare product expansion and water treatment technologies. Despite this progress, flat overall revenues accompanied by a net loss in the latest fiscal year reflect costs from restructuring, legacy liabilities, and market headwinds. The company maintains strong liquidity and an active capital allocation policy focused on share repurchases and dividends amid its focus on operational streamlining.
Historical Performance and Strategic Restructuring
DuPont de Nemours Inc's financial trajectory over recent years reflects pronounced strategic realignments culminating in a major portfolio transformation during 2025. Historically boasting revenues above $20 billion pre-2019 (including legacy DowDuPont operations), by FY2020 reported revenue consolidated to approximately $5.25 billion as divestitures commenced [F1]. The company's net income trajectory turned negative in FY2025, with a loss of $126 million contrasting sharply with a positive $703 million in FY2024 [F1]. This reversal owes largely to restructuring costs tied to the Electronics business spin-off completed November 1, 2025, along with legacy litigation provisions.
The spin-off of the semiconductor-focused Electronics Business into Qnity Electronics marks a pivotal corporate milestone [S1]. Concurrently, DuPont announced definitive sales for Aramids (~$1.2 billion cash proceeds plus equity) with completion expected in Q1 2026 [S1]. Earlier divestitures included the Mobility & Materials segment between 2022-23 (notably the Delrin® acetal business), reflecting a strategic pivot away from commodity polymers towards specialty chemicals concentrated on healthcare, water technologies, and industrial materials.
This reshaping effectuated changes in reportable segments: initially separating the Electronics group for distinct management seen through early-to-mid 2025 reporting; post-separation realignment solidifying two main segments effective late-2025 — Healthcare & Water Technologies and Diversified Industrials [S1][S16].
Segment Dynamics and Growth Drivers
The Healthcare & Water Technologies segment emerges as DuPont's engine of growth post-restructuring. Full-year net sales rose 9% year-over-year to $3.23 billion in 2025, fueled by a 7% volume increase coupled with modest portfolio expansions from key acquisitions such as Spectrum and Donatelle [S16][N7/N11]. Medical packaging and biopharma led volume growth within healthcare technologies; water technologies saw gains primarily in industrial and municipal water markets supported by innovations like FilmTec MXP RO-8038-FF elements for dairy filtration [S10]. Operating EBITDA expanded faster than sales (15% increase) reaching $972 million driven by productivity programs offset partially by growth investments [S16].
Conversely, the Diversified Industrials segment exhibits mixed volume trends. It serves diverse markets including aerospace—where cyclicality is customary—automotive, and construction sectors affected by macroeconomic conditions. Post-separation reporting granularities limit detailed subsegment disclosure but indicate stable albeit challenged demand patterns.
Revenue and Profitability Trends
Consolidated revenues approximated $3.75 billion latest available data aligning closely with flat year-over-year movement (~0.9% increase) amid portfolio shifts [F1][N1]. However, profitability metrics reveal pressure. The net loss recorded for FY2025 reverses prior profit trends (FY2024 net income of $703 million). This loss includes substantial items linked to restructuring charges for organizational synergies post-divestitures alongside ongoing costs related to legacy liabilities including environmental remediation provisions particularly PFAS-related agreements settled or pending approval [S6][S17].
Operating cash flow dropped sharply in FY2025 compared to prior years (a roughly 74% decline against FY2024), impacted partly by cash transferred in the Electronics separation process plus elevated working capital demands during integration phases [F1][S1][N2/N3]. Capital expenditures were curtailed by about 42%, reflecting more selective investment following asset sales though continued funding of R&D-intensive specialty chemical product development persists [F1][S12].
Liquidity Position and Capital Structure
The company's liquidity remains robust albeit reduced relative to prior year: end-2025 cash and equivalents stood at approximately $715 million down from roughly $1.8 billion at end-2024 due primarily to separation transaction cash outflows, share repurchases, debt repayments and M&A activity funding [S1][S5][F1]. To supplement liquidity management, DuPont holds committed revolving credit facilities aggregating $3 billion underscoring prudent capital management [S15][S18].
Significant deleveraging occurred during 2025 lowering gross debt from about $7.2 billion at end-2024 to roughly $3.2 billion end-2025 principally through maturity repayments ($1.85 billion notes retired), exchanges of outstanding notes for new debt instruments designed around post-spinoff capital structure targets plus redemption events mandated under separation agreements [S20][S28]. Such refinancings improved maturity profiles supporting investment-grade ratings affirmed as Stable across S&P BBB+, Moody’s Baa1, Fitch BBB+ categories [S18].
Returns Profile and Capital Allocation
DuPont returned capital consistently through dividends totaling nearly $597 million in FY2025 representing about $1.43 per common share—a slight reduction from previous years reflecting sensitivity to earnings pressures but sustaining shareholder income streams [F1][S4][S7]. Share repurchase activities remain aggressive under multi-billion dollar programs spanning several years; notably a fresh authorization of up to $2 billion share repurchases was approved late-2025 with accelerated share repurchase transactions completed totaling over $500 million late that year alone [S4][S19].
Approximate return on equity deteriorated into negative territory (-0.9%) on trailing results given losses despite equity base contraction post-divestitures evidenced by shareholders' equity declining from about $23.35 billion in FY2024 to about $13.92 billion at FY-end 2025 [F1]. Free cash flow estimated at roughly $255 million (operating cash flow less capex) signals positive but constrained capacity for discretionary investments or meaningful expansion absent operational improvements or strategic acquisitions.
Industry Context and Competitive Moat
Operating chiefly within specialty chemicals—an industry requiring extensive regulatory compliance, technical expertise, intellectual property defense, innovation cycles and customer intimacy—DuPont leverages a considerable moat derived from its diversified portfolio encompassing healthcare materials (medical devices, packaging), advanced water treatment technologies, and engineered industrial materials used across resilient markets such as aerospace.
Acquisitions such as Spectrum (medical materials), Donatelle (healthcare solutions), Sinochem transactions further enhance proprietary offerings enabling differentiated solutions addressing stringent regulatory environments . The company’s established customer relationships coupled with patents/trade secrets support competitive defensibility amidst price sensitivity and innovation-driven barriers typical of specialty chemical marketplaces.
However, risks persist notably volume declines tied to cyclical industrial segments or pandemic aftereffects alongside ongoing expenditures related to complex restructurings/remediation obligations associated with historical liabilities—factors that may cap near-term margin leverage despite growth initiatives.
Environmental Liabilities and Litigation Risks
A significant element shaping DuPont’s risk profile is environmental remediation obligations particularly linked to PFAS compounds historically manufactured or used prior to separations. Following negotiated cost-sharing memoranda of understanding among DuPont, Chemours, Corteva—and judicial consent orders pending approval—the company has provisioned indemnities exceeding aggregate hundreds of millions USD with incremental contingencies disclosed nearing potential multiples beyond accrued amounts [S17][S11]
Notable resolved cases include New Jersey State judicial settlements reducing uncertainty albeit leaving residual exposure while Company engages ongoing EPA inquiries on other sites like Richmond VA Spruance facility alleged violations under hazardous waste regulations [S6]. The prudent provisioning philosophy incorporates legal counsel assessments recognizing inherent forecasting challenges relating to these contingent liabilities.
Outlook Considerations
Explicit forward guidance was initiated early February 2026 emphasizing expectations for flat-to-modest revenue gains within Healthcare & Water Technologies supported by sustained demand in medical/biopharma packaging alongside incremental contribution from portfolio innovations including medical grade liquid silicone rubbers introduced recently as well as novel ion exchange resins aiding acid purification [N11][N13]. Conversely diversified industrials remain susceptible to slower automotive/aerospace recovery scenarios.
Investors should watch key milestones around closing of Aramids sale expected Q1 2026 bringing incremental liquidity; execution progress against share repurchase authorizations; working capital efficiency improvements; resolution updates on environmental contingencies; along with margin trajectories reflecting raw material cost trends which have been volatile industry-wide but partially moderated lately.
Summary Table: Selected Financial Metrics (USD millions)
Historical performance (annual)
| FY | Net ($bn) | Capex ($mm) | Net YoY |
|---|---|---|---|
| 2025 | -0.1 | 333 | -117.9% |
| 2024 | 0.7 | 579 | +66.2% |
| 2023 | 0.4 | 619 | -92.8% |
| 2022 | 5.9 | 743 |
Note: Omitted columns lack sufficient annual XBRL coverage in the provided tags (need ≥2 annual points): Rev, CFO, OpInc, FCF. Source: SEC companyfacts cache [F1].
Capital returns and efficiency (annual)
| FY | Div ($mm) | Buybacks ($bn) | ROE% |
|---|---|---|---|
| 2025 | 597 | 3.3 | -0.9 |
| 2024 | 635 | 3.3 | 3.0 |
| 2023 | 651 | 3.3 | 1.7 |
| 2022 | 652 | 22.1 |
Source: SEC companyfacts cache [F1]. *Latest CFO data preceding full restructure impacted; buybacks figure lagging official data releases. **Latest available figure per segments consolidated excluding discontinued. [Source: SEC filings/S1-S29]
This analysis integrates data primarily from DuPont’s most recent SEC filings (10-K dated February 17, 2026) complemented with recent earnings commentary reports ([N1],[N2],[N3]), balancing between near-term execution realities post-major portfolio shifts alongside longer-term value creation aspirations anchored in core specialty chemical franchises.
Disclaimer: This report is an informational company analysis synthesized from public regulatory documents and news sources without offering investment guidance or recommendations.
Disclaimer: This is research-only, informational analysis and not investment advice. It may include AI-generated interpretation and general industry context. Always verify important details using primary sources.
Comments