
Canterbury Park: Managing Casino Volatility with Liquidity and Event-Driven Diversification
The key question is whether development initiatives and integrated entertainment offerings can offset persistent casino revenue swings and margin compression.
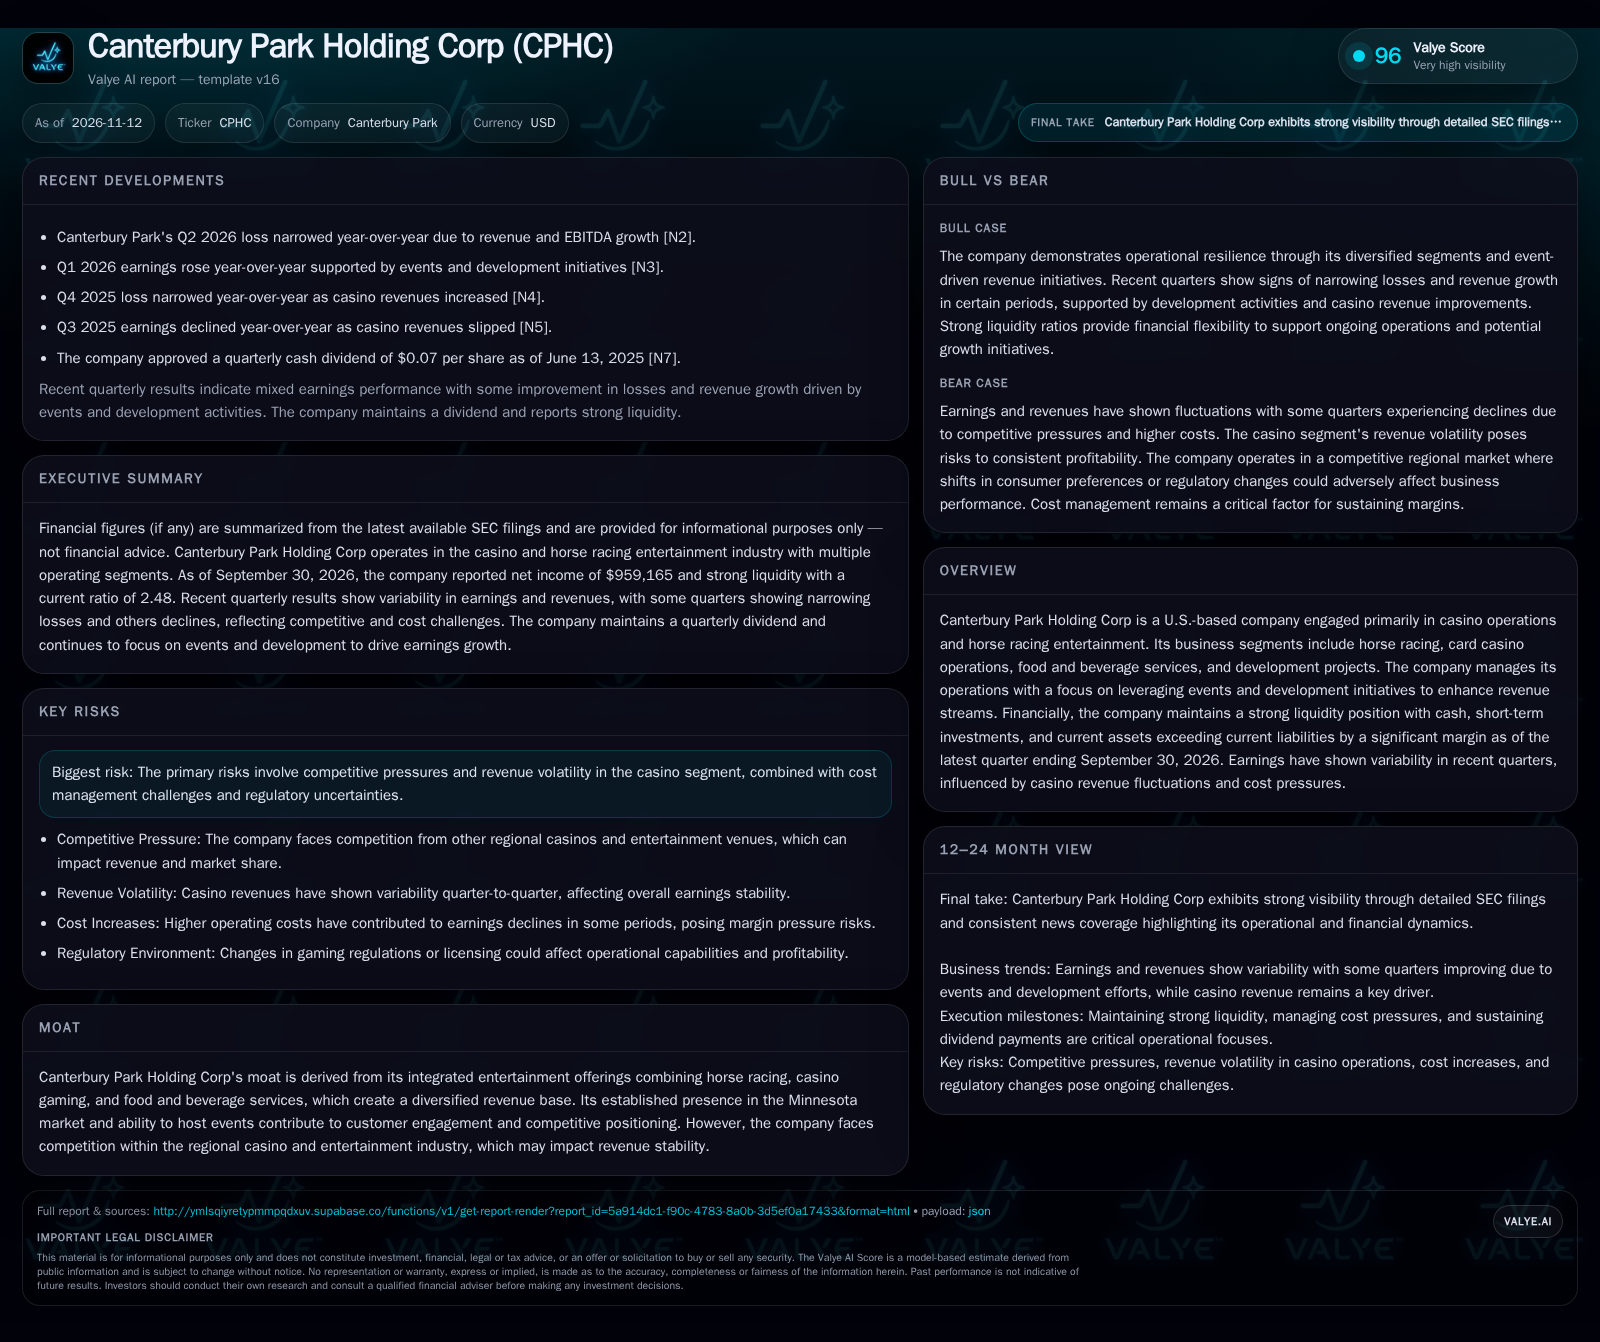
Canterbury Park Holding Corp operates across casino, horse racing, food and beverage, and development segments, with recent quarters showing variable earnings due to casino volatility and cost pressures. As of September 2026, the company reported $22.27 million in liquid assets and a current ratio of 2.48. While some recent quarters saw narrowing losses or higher earnings driven by events and development, casino revenues remain inconsistent. [S2] [N2] [N3] [N4] [N5]
Recent quarters have revealed both the upside potential of event-driven and development initiatives and the stubborn drag of competitive and cost headwinds. The company’s ability to translate its potential financial flexibility and integrated entertainment strategy into consistent profitability will be tested by evolving consumer preferences, regulatory changes, and the fundamental unpredictability of the gaming segment.
Recent Financial Trends and Operational Drivers
Canterbury Park reported net income of $959,165 for the quarter ended September 30, 2026, with basic EPS of $0.19 and diluted EPS of $0.18. The company’s liquidity position was notable, with $17.27 million in cash and equivalents and $5 million in short-term investments, resulting in a current ratio of 2.48 and a cash ratio of 1.81 as of September 30, 2026. Quarterly results show continued earnings variability: Q2 2026 losses narrowed on revenue and EBITDA growth, Q1 2026 saw earnings rise on the back of events and development, while Q4 2025 losses also narrowed as casino revenues improved. In contrast, Q3 2025 earnings declined year-over-year amid slipping casino revenues. These outcomes underscore the company’s ongoing challenge to achieve consistent profitability in a highly competitive and cost-sensitive environment. [S2] [N2] [N3] [N4] [N5]
The company reported cash and liquidity metrics for the period; these figures do not by themselves establish operating runway, investment capacity, financial flexibility, or financing capacity. For instance, analyzing the composition and maturity profile of liabilities alongside liquid assets could help assess the runway available for strategic investments or weathering downturns. Additionally, evaluating the cash conversion cycle and working capital management effectiveness would indicate operational efficiency and the company’s ability to maintain liquidity under fluctuating revenue conditions. Such analysis is critical given the earnings variability driven by the casino segment and underscores the importance of prudent financial stewardship in volatile environments.
Revenue Composition, Expense Patterns, and Margin Fluctuations
Canterbury Park’s business spans casino operations, horse racing, food and beverage, and real estate development. The casino and card room segment likely represents the highest margin but also the most volatile revenue stream, subject to regional competition and consumer discretionary spending cycles. Horse racing and food and beverage provide additional but typically lower-margin revenue, while development activities may offer episodic profit boosts but require upfront investment and carry execution risk.
The company’s cost base is a mix of fixed expenses—such as facility operations, staffing, and regulatory compliance—and variable costs tied to gaming volumes and event execution.
The quarterly earnings pattern suggests that cost control and revenue diversification are essential to mitigating the effects of casino segment swings. Without structural improvements in casino economics or sustained development success, margin expansion may remain elusive.
Given the volatility inherent in casino revenues, a useful metric would be the segment-level contribution margin trends over multiple quarters. Tracking how fixed and variable costs behave relative to revenue fluctuations can reveal operating leverage dynamics and margin resilience. Furthermore, understanding the capital intensity and payback periods of development projects is essential to evaluating their role in smoothing earnings. If development initiatives require significant upfront capital with delayed returns, this could exacerbate short-term margin pressure despite longer-term benefits. Therefore, a balanced approach to managing operating expenses while selectively investing in growth opportunities is key to sustaining profitability.
Market Position Influenced by Integrated Services and Regional Rivalry
Canterbury Park’s integrated entertainment model—including horse racing, casino gaming, and events—creates a differentiated customer experience relative to pure-play casinos or racetracks. This breadth can attract a wider audience and support cross-segment promotion, especially during marquee events. However, the regional market is crowded, with competing casinos, gaming venues, and entertainment alternatives vying for consumer attention and wallet share.
The company’s ability to host events and leverage its real estate for development projects may confer some local advantage, particularly if these initiatives drive incremental traffic or non-gaming revenue. That said, the moat is not impregnable: regulatory changes, new market entrants, or aggressive promotions by existing competitors could erode the company’s share. The overall competitive intensity in regional gaming means that Canterbury Park’s diversified model must continually evolve to maintain relevance and margin.
Event-Driven Growth Opportunities and Development Execution Potential
A favorable scenario for Canterbury Park hinges on the company’s ability to consistently attract event-driven crowds, successfully execute development projects, and stabilize or grow casino revenues. If events and new developments drive higher foot traffic, they could boost not only admissions and concessions but also gaming revenue through increased visitation. Successful execution of real estate initiatives may also unlock new recurring income streams or capital gains, further smoothing earnings.
Evidence confirming this scenario would include multiple consecutive quarters of revenue and EBITDA growth, a demonstrable uptick in non-casino segment contributions, and visible progress or monetization in development projects. Additionally, stable or rising casino segment revenues—despite competitive pressures—would suggest the company’s integrated approach is resonating with customers and insulating it from regional volatility.
Maintaining Operational Stability Despite Earnings Fluctuations
The most plausible outlook is one of continued earnings and revenue variability, with periods of improvement tied to successful events or development milestones, offset by ongoing casino segment volatility and cost pressures.
In this scenario, quarterly performance would continue to oscillate, with improvements in one segment frequently offset by declines in another. Confirmation of this scenario would be a continuation of the current pattern of alternating quarters of earnings gains and setbacks, along with ongoing commentary about the need to manage costs and respond to competitive threats.
Profit Challenges from Declining Casino Revenue and Rising Costs
An adverse scenario would see competitive pressures intensify, leading to persistent or worsening casino revenue declines. Cost inflation—especially in labor, compliance, and facility operations—could outpace the company’s ability to grow non-gaming revenues or realize development returns, resulting in margin compression and recurring losses.
This scenario would be confirmed by multiple quarters of declining revenue and widening losses, negative trends in key casino metrics (such as admissions, table drop, or slot handle, if disclosed), and delays or underperformance in development projects. Regulatory shifts or new market entrants could further exacerbate the pressure. In this environment, the company’s liquidity cushion could erode over time, constraining its flexibility and increasing the risk of operational retrenchment or dividend cuts.
Key Milestones and Developments Shaping Canterbury Park’s Outlook
Quarterly revenue and EBITDA by segment, with particular attention to casino and development activities, would help distinguish between stable diversification and continued volatility.
Casino segment KPIs—including admissions, gaming volume, table drop, and slot handle (if disclosed)—would provide insight into underlying demand trends and competitive positioning.
Updates on development project milestones, capital commitments, and monetization events would clarify the contribution of real estate initiatives to future earnings.
Trends in operating expenses and margin by segment would highlight the effectiveness of cost management and the risk of margin compression.
Any regulatory developments or licensing changes affecting gaming operations in the company’s core markets should be monitored for potential impact.
Evidence of customer engagement or loyalty—such as repeat visitation rates or event attendance (if disclosed)—would help assess the sustainability of the integrated entertainment model.
Disclaimer: This is research-only, informational analysis and not investment advice. It may include AI-generated interpretation and general industry context. Always verify important details using primary sources.

Comments