
Corebridge Financial’s Merger Milestone and Strategic Trajectory in 2026
Corebridge advances merger integration with Equitable Holdings, leveraging capital actions and product growth amid operational challenges.
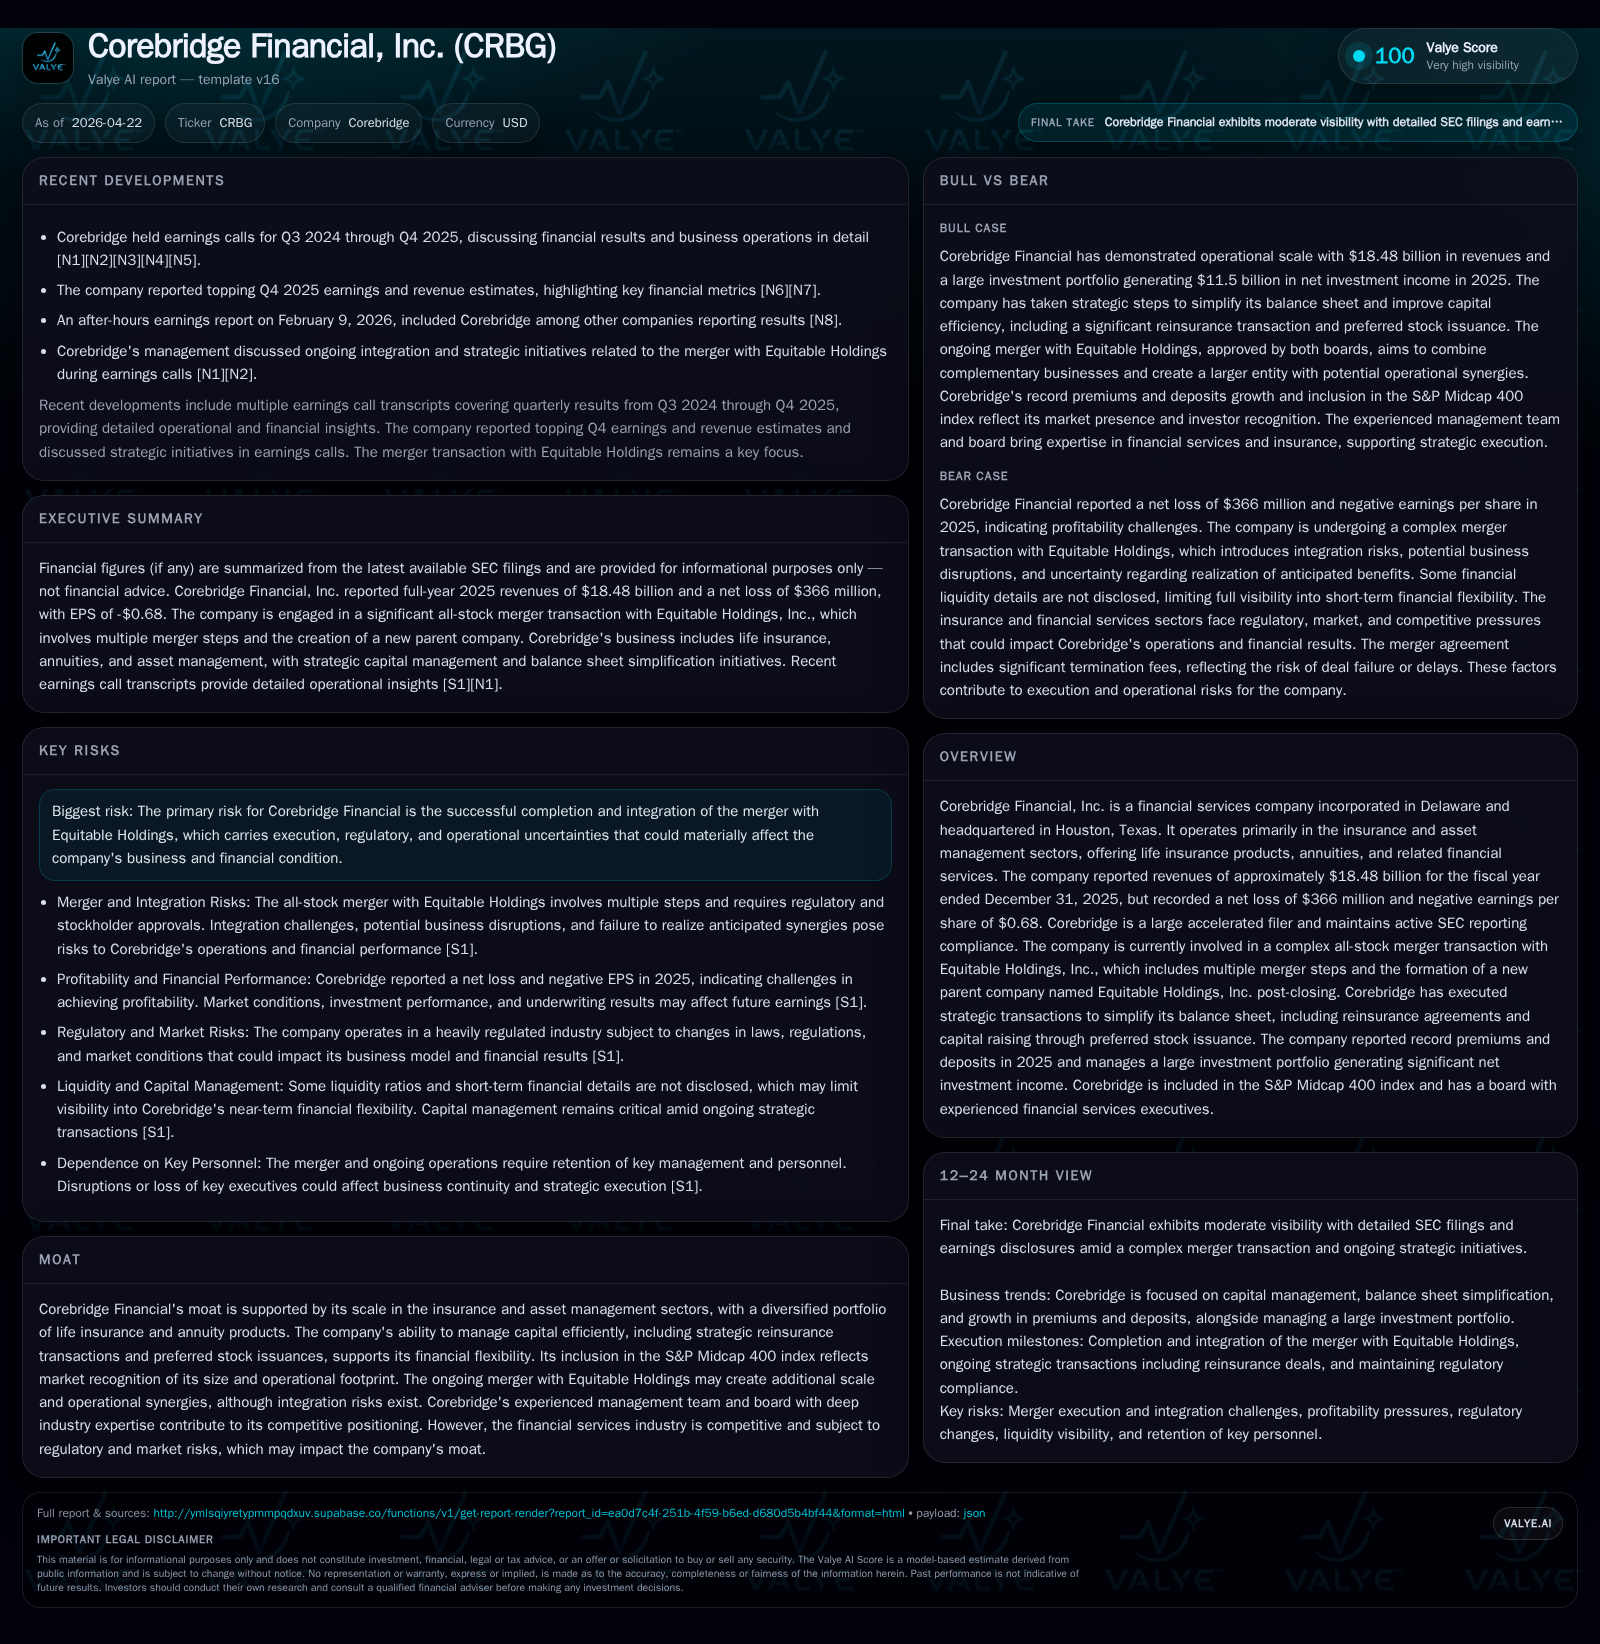
Corebridge Financial's latest quarterly and event filings reveal active steps toward completing its transformative all-stock merger with Equitable Holdings. The company is executing capital optimization strategies including share repurchases, preferred stock issuance, and reinsurance transactions to support balance sheet simplification and growth. Corebridge’s diversified insurance and asset management portfolio benefits from scale advantages, though merger integration risks and market volatility remain key constraints. Close attention to merger approvals, synergy realization, and new business momentum will shape Corebridge’s path forward.
Latest Operating Update and Merger Progress
Corebridge’s November 2025 quarterly report [S2] lays the groundwork for understanding its evolving operational landscape as it advances toward the closing of its planned all-stock merger with Equitable Holdings. In the April 14, 2026 8-K [S3], the company announced a key director election expanding its board composition with an appointee under the Nippon Life Stockholder’s Agreement—signaling attentive governance restructuring ahead of integration. Concurrently, discussions about pre-closing share repurchases were revealed in an April 16 filing [S4], where Corebridge coordinated with Equitable to explore such actions contingent on waivers of merger agreement restrictions. These filings collectively frame a near-term operating picture shaped heavily by the pending combination’s demands.
Notably, these filings reflect heightened management focus on liquidity preservation balanced with shareholder return objectives before deal close. Share repurchase flexibility could serve as a tactical lever to support equity price stability or value extraction amid merger-related uncertainty, yet remains subject to tight cross-party controls—a nuance underscoring cautious capital stewardship.
Business Model and Product Portfolio
According to the amended annual report filed April 22, 2026 [S1], Corebridge Financial operates as an integrated insurance and asset management entity generating revenues primarily through life insurance premiums, annuity contract deposits, and investment management fees. A sizeable portion of its insurance liabilities is ceded via comprehensive reinsurance agreements to Corporate Solutions Life Reinsurance Company (CSLR) based in Bermuda—a jurisdiction leveraged for capital efficiency advantages.
This reinsurance strategy enables Corebridge to transfer underwriting risk while optimizing regulatory capital requirements. Product segmentation includes fixed indexed annuities (FIAs), structured settlements, term life products, and institutional markets offerings as highlighted by EVP Jonathan Novak’s commentary where new business exceeded sales budget by approximately 22%, pushing total transaction value beyond $547 million—more than double budget expectations. The breadth of products supports diversified revenue streams that benefit from premium pricing power linked to differentiated annuity structures incorporating client-tailored features.
The strategic operation of asset/liability matching frameworks further buttresses financial resilience by aligning investment portfolios against policyholder obligations—a critical factor given interest rate volatility impacts on fixed income-heavy insurer balance sheets.
Competitive Position Within Insurance and Asset Management
Corebridge’s standing as a large accelerated filer included in the S&P Midcap 400 index denotes significant scale among peers . In a fragmented U.S. market characterized by intense competition among life insurers coupled with evolving consumer preferences toward simpler retirement savings solutions, Corebridge maintains competitive spacing through product innovation and distribution channel breadth.
Regulatory scrutiny remains elevated across the sector with frequent adjustments to actuarial assumptions and capital adequacy standards pressuring margins industry-wide. Corebridge’s access to reinsurance markets supports mitigation of these constraints yet exposes it to counterparty credit considerations.
Management depth is evident in recent executive appointments ensuring continuity during transition. Moreover, customer switching costs in long-duration life products create retention barriers favoring incumbents with established brand trust—though digital-forward disruptors maintain latent threat vectors especially among younger demographics seeking greater transparency.
Capital Structure Optimization and Shareholder Actions
From March through April 2026 filings [S5-S8; S11; S13], Corebridge issued multiple tranches of subordinated notes collectively enhancing its callable debt profile—specifically junior subordinated notes due in 2064 carrying fixed coupon rates around 6.375%. These debt issuances improve core liquidity buffering capacity pre-merger while aligning maturity horizons with anticipated post-merger strategic timelines.
The April 16-17 disclosures on capital allocation [S4; S7] reveal board-level deliberations around dividends augmentation (a reported modest increase despite substantial capital deployment needs) coupled with cautious share repurchase programs dependent on merger approval waivers. This balanced approach signals intent to sustain investor returns without undermining credit metrics or regulatory requirements.
Historical financial evidence supports this narrative: fiscal year buybacks surged approximately 18% year-over-year to $2.12 billion whereas dividends slightly decreased but remain material at over $511 million paid [F1]. Equity rose commensurately reflecting core net asset base expansion despite net income compressions tied partly to increased transactional costs.
Growth Drivers: New Business Momentum and Reinsurance Strategy
Growth dynamics are anchored around strong new business production achieving more than double budget targets as per [S1]. This momentum reflects effective sales force execution complemented by product suite adaptations catering to evolving consumer demand for fixed indexed annuities offering downside protection combined with upside participation—a product segment growing across insurer franchises nationally.
Reinsurance transactions epitomize another critical growth enabler: Corebridge's Bermuda-based subsidiary CSLR assumed over $7 billion in liabilities covering FIAs, structured settlements, and term life policies under recently closed agreements [S1]. This shift not only enhances regulatory capital ratios but also sharpens margin profiles through risk transfer economics.
These reinsurance moves facilitate a cleaner balance sheet conducive to further organic growth investments or potential bolt-on acquisitions post-merger—a structural advantage compared to less flexible competitors reliant solely on internal capital buildup.
Risks and Constraints: Integration Challenges and Market Environment
Merger execution remains the predominant risk factor driving Corebridge’s outlook [valye_report_excerpt; S2; S3]. Integration challenges include melding corporate cultures, consolidating IT infrastructure, harmonizing compensation frameworks (notably variable equity awards subject to performance conditions detailed in annual compensation disclosures), and aligning strategic priorities rapidly enough to realize projected run-rate synergies estimated within merger documentation.
Regulatory approvals introduce timing uncertainty compounded by possible conditions impacting deal economics or managerial autonomy before closing [S14; S19]. The appointment of new directors effective April 21, 2026 [S3], signals preemptive governance alignment aimed at smoothing transition friction.
Externally, macro-financial volatility including interest rate shifts can depress fixed income returns integral to insurer operations affecting product attractiveness indirectly via pricing adjustments or lapse rates. Variable investment income fluctuations noted preliminarily for Q1 2026 further highlight this exposure impacting adjusted pre-tax operating income calculations [S22].
Key Near-Term Milestones to Monitor
Critical milestones include finalizing regulatory clearances amidst ongoing communication delays noted regarding proxy statement filings following prior extension allowances [S1]. The commencement of proxy mailing represents pivotal shareholder engagement phase dictating vote outcomes essential for deal closure.
Synergy realization timelines disclosed anticipate phased expense savings post-closing—with management earmarking early cost optimization primarily within administrative overheads complemented by investment efficiencies monitored closely in subsequent earnings releases [S4; S29].
Share repurchase decisions ahead of closing continue as an execution variable contingent upon waiver approvals from Equitable Holdings under merger covenants ([S4])—potentially influencing near-term equity price dynamics.
Liquidity posture through dividend stewardship remains under scrutiny given commitments to maintain insurance subsidiaries’ dividend flow rates while preserving capital buffers necessary for statutory compliance [S20].
Supporting Financial Analysis and Performance Trends
Historical performance (annual)
| FY | Rev ($bn) | Net ($bn) | CFO ($bn) | Rev YoY | Net YoY |
|---|---|---|---|---|---|
| 2025 | 18.5 | -0.4 | 2.0 | -1.6% | -116.4% |
| 2024 | 18.8 | 2.2 | 2.2 | -0.5% | +102.0% |
| 2023 | 18.9 | 1.1 | 3.4 | -29.2% | -86.5% |
| 2022 | 26.7 | 8.1 | 2.7 |
Source: SEC companyfacts cache [F1].
Capital returns and efficiency (annual)
| FY | Div ($mm) | Buybacks ($bn) | ROE% |
|---|---|---|---|
| 2025 | 511 | 2.1 | -2.8 |
| 2024 | 544 | 1.8 | 19.5 |
| 2023 | 1722 | 0.5 | 9.4 |
| 2022 | 876 | 99.3 |
Source: SEC companyfacts cache [F1].
Fiscal year end data for December 31, 2025 underpins this strategic narrative quantitatively: Corebridge generated revenues totaling approximately $18.48 billion representing a slight decline (-1.6% YoY) from prior years reflecting ongoing portfolio reshaping effects [F1]. Meanwhile net loss of -$366 million marked a severe reversal compared to positive net income in previous periods (-116% YoY change), largely attributed to increased merger-related expenses and mark-to-market adjustments inherent during transformational phases.
Operating cash flow remained relatively stable around $2.02 billion albeit down modestly (-6%), demonstrating resilient core cash generation capability supporting dividend payments ($511 million) alongside notable share repurchases exceeding $2 billion demonstrating aggressive capital return strategy despite market uncertainty.
Equity base expanded from $11.46 billion in 2024 to $13.2 billion end-2025 highlighting retained earnings buffering net losses while maintaining strong capitalization levels vital for regulatory leverage ratios [F1]. Return on equity consequently turned negative (-2.8%) indicative of transitional pressures but holding within an expected range amid strategic repositioning phases.
Overall financial picture aligns with qualitative assessments emphasizing temporary earnings setbacks collateralized by stable cash flows enabling proactive capital maneuvers crucial for anticipated combined entity scale benefits following completion of the Equitable merger.
Disclaimer: This analysis is for informational purposes only based on publicly filed SEC documents dated through April 22, 2026. It does not constitute investment advice or recommendations.
Disclaimer: This is research-only, informational analysis and not investment advice. It may include AI-generated interpretation and general industry context. Always verify important details using primary sources.
Comments