
EastGroup Properties Advances Rent Growth Through Focused Development in High-Growth Submarkets
EastGroup’s Q1 2026 results underscore its strategic development execution and robust leasing performance in key industrial hubs amid inflation and macroeconomic uncertainty.
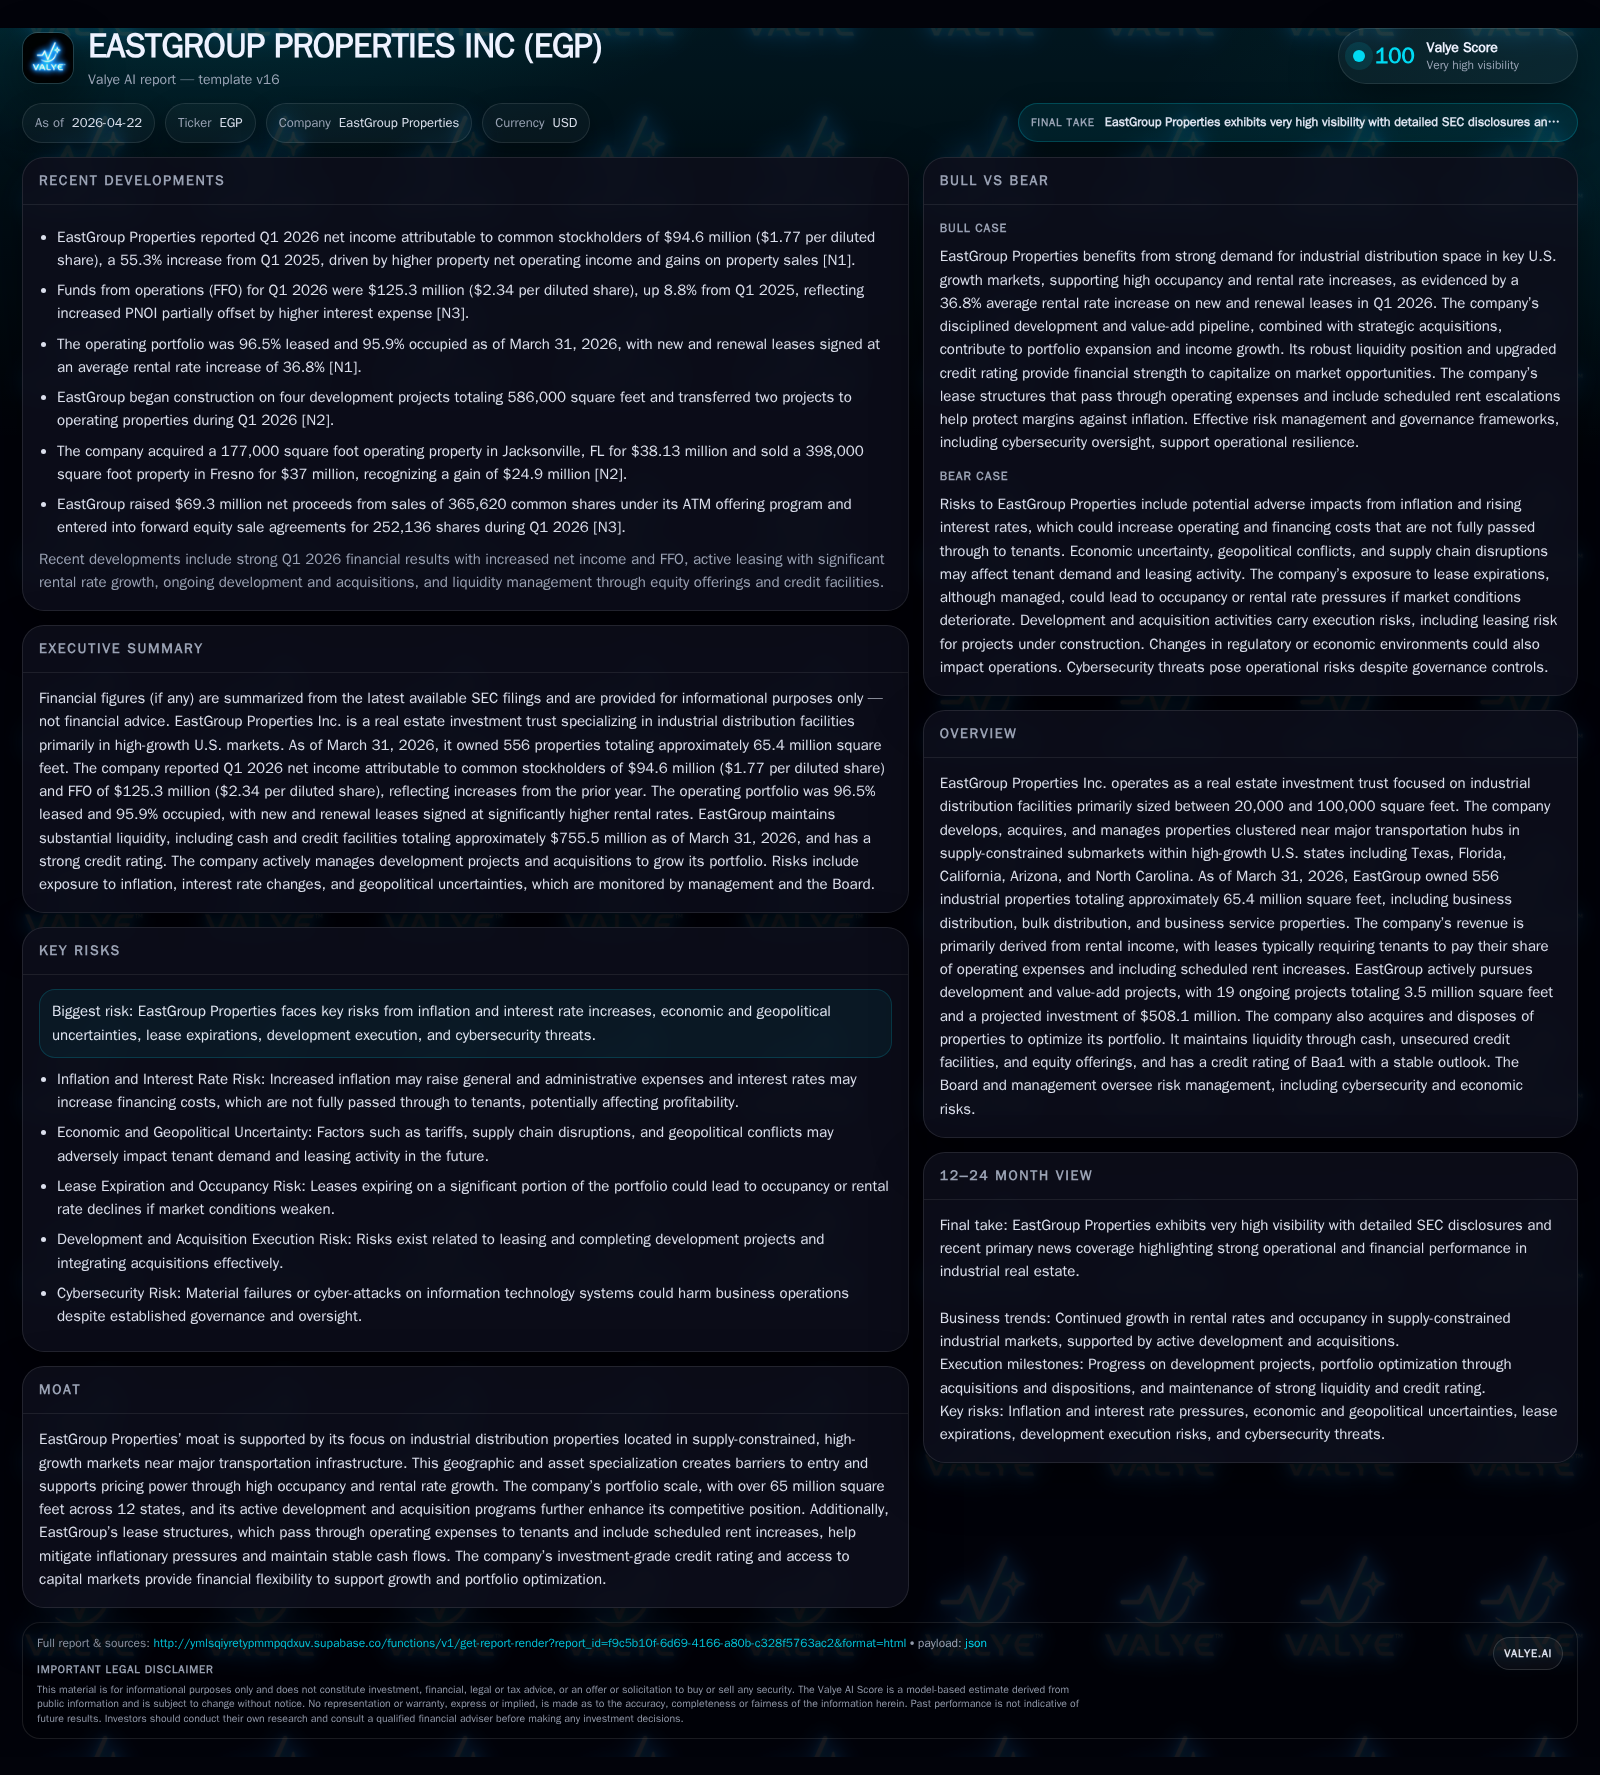
EastGroup Properties reported solid Q1 2026 operational progress, highlighted by sustained rent escalations on new and renewal leases averaging 36.8%, an active development pipeline of 3.5 million square feet across 19 projects, and liquidity fortified by $69 million net ATM equity proceeds. The company maintains high occupancy near 96% in a portfolio concentrated on mid-sized industrial distribution properties located in supply-constrained, high-growth U.S. markets including Texas, Florida, California, Arizona, and North Carolina. EastGroup’s triple-net lease structures enable effective operating expense pass-throughs, supporting resilient cash flows despite inflationary cost pressures. Moody’s upgrade to Baa1 further enhances capital access to underpin ongoing development and acquisition programs.
Latest Quarterly Operating Update Highlights
EastGroup Properties’ Q1 2026 filing [S2] reflects continued operational momentum anchored by strong rent growth and active portfolio expansion. As of March 31, 2026, EastGroup owned 556 properties totaling approximately 65.4 million square feet across twelve states, primarily concentrated in Texas, Florida, California, Arizona, and North Carolina—the nation’s fastest-growing logistics markets [S2].
The company reported rental rate increases on new and renewal leases averaging a striking 36.8% compared to prior leases covering about 3.3% of the total operating portfolio area—a clear signal that pricing power remains intact despite macroeconomic headwinds [S27]. Same-property Property Net Operating Income (PNOI) rose by 7.5% year-over-year, largely driven by these contractual rent escalations embedded in triple-net structured leases which shift most operating expenses onto tenants [S28]. Occupancy remained resilient near historical peaks at roughly 95.9%, down fractionally from a year earlier but supported by proactive lease management including reducing expiring leases from 8.2% to 7.1% of annualized base rent within just weeks [S20].
Development activity accelerated with EastGroup commencing four new projects totaling nearly 586,000 square feet during the quarter and transferring two projects (562,000 square feet) into stabilized property status [S24]. Total development and value-add property investment stood at approximately $698 million as of quarter-end with $186 million still to be invested across the pipeline—reflecting disciplined capital allocation amid ongoing inflation pressures [S25].
The company bolstered liquidity through its at-the-market (ATM) equity program, raising net proceeds of $69 million via direct stock issuance while maintaining cash balances near $31 million and credit availability exceeding $674 million on unsecured lines [S2][S5]. Notably, Moody's upgraded EastGroup’s issuer rating to Baa1 with a stable outlook in February 2026—strengthening its credit profile and enabling future debt issuances predominantly via unsecured fixed-rate instruments with favorable spreads [S7][S21].
Business Model: Specialized Industrial Real Estate in Supply-Constrained Hubs
EastGroup specializes in industrial distribution facilities sized predominantly between 20,000 and 100,000 square feet tailored for location-sensitive tenants requiring proximity to major transportation infrastructure such as interstates, ports, rail hubs, and airports [S1][S2]. This mid-box segment fills critical gaps between large bulk warehouses and smaller last-mile facilities favored by e-commerce.
The corporate strategy centers on clustering assets within supply-constrained submarkets where land scarcity limits new construction—creating barriers to entry and sustaining occupancy rates . Lease agreements overwhelmingly employ triple-net formats whereby tenants reimburse EastGroup for real estate taxes, insurance, maintenance, and common area expenses; this significantly stabilizes rental income against inflationary spikes in operating costs [S2][S28]. Additionally, most leases include scheduled contractual rent escalations helping ensure revenue growth even absent significant market rental resets.
EastGroup also pursues an active development and value-add program—typically initiating projects only after securing pre-leasing commitments—which mitigates risk while adding a predictable supply of new rentable space aligned with tenant demand cycles [S24]. The typical lease term profile combined with disciplined asset acquisition or disposition enables steady recurring rental revenues complemented by opportunistic capital gains from property sales.
Competitive Position and Industry Structure in Industrial REIT Sector
Within the industrial REIT landscape, EastGroup occupies a distinctive niche focusing exclusively on functional mid-sized logistics properties clustered near vital transportation corridors in rapidly expanding states characterized by population growth and business migration trends: Texas (Dallas-Fort Worth,Houston), Florida (Jacksonville,Tampa), California (Inland Empire), Arizona (Phoenix), North Carolina (Charlotte,Raleigh) [S17]. This selective geographic footprint contrasts peers with broader national exposure or specialization in warehousing megaprojects.
Such geographic concentration enhances operational efficiencies via portfolio density yet benefits from diversified local economies spanning retail fulfillment, manufacturing supply chains, tech hardware distribution and last-mile delivery—all sectors demonstrating secular growth drivers rather than purely cyclical demand fluctuations (analysis). Entry barriers imposed by limited developable land around transportation nodes reinforce pricing power while achieving consistently high occupancy—further supported by tenant credit quality notably improved via post-pandemic supply chain reintegration plans.
EastGroup’s investment-grade Baa1 rating following Moody’s upgrade showcases market confidence in its governance standards, financial discipline and risk management frameworks including comprehensive cybersecurity controls led by a specialized corporate committee [S1]. This solid credit standing supports cost-efficient capital raises critical for funding development pipelines amid restrictive monetary conditions impacting many REITs.
Growth Catalysts and Headwinds: Development, Leasing Dynamics, Inflation
The company’s organic growth hinges primarily on two pillars: contractual rent escalations embedded in long-term triple-net leases driving same-store revenue uplift; plus accretive square footage expansion through disciplined development projects carefully timed to tenant demand visibility [S24]. In Q1 alone EastGroup began construction on four developments comprising nearly 586 thousand sq.ft., reflecting continued confidence in sustained demand for well-located industrial space.
Leasing dynamics reveal robust tenant willingness to absorb above-average rent increases—36.8% average lifts on new/renewal leases during Q1 compelling evidence given prevailing economic uncertainty marked by persistent inflation pressures and tariff concerns globally [S27][N4]. However, the company acknowledges some exposure to inflation-driven administrative expenses—such as general & administrative overheads—that are non-recoverable under typical lease terms potentially squeezing margins if inflation persists or intensifies beyond anticipated ranges [S2]. Interest rate volatility also remains a watchpoint influencing refinancing costs despite largely fixed-rate debt portfolio.
Market constraints relating to available buildable land near key transport nodes naturally restrict new competing supply fostering favorable landlord conditions—but could limit long-term scale gains absent acquisitions serving markets outside core geography or innovative asset repositioning strategies (analysis). Meanwhile geopolitical factors adding uncertainty around trade routes represent external risks warranting close monitoring.
Capital Strategy and Financial Flexibility Overview
EastGroup maintains substantial liquidity headroom entering Q2 with total accessible capital exceeding $755 million composed of $31 million cash & equivalents plus $674+ million undrawn unsecured credit line capacity alongside forward equity sale agreements enabling equity issuances when market conditions justify [S5][S7][S22]. The recent ATM stock sale yielded $69 million net proceeds reinforcing balance sheet flexibility while shareholder distributions remain well-supported given strong cash flow generation.
Net cash from operations was notably healthy at approximately $142 million for Q1 alone driven by rent collections supported by lease pass-through structures [S5]. Debt profile is primarily unsecured fixed-rate instruments often hedged through interest rate swaps mitigating refinancing risks; scheduled debt maturities appear manageable with principal payments spread evenly through next five years complemented by prudent use of revolving credit lines for working capital needs [S6][S8][S21]. Moody's upgrade from Baa2 to Baa1 signifies confidence in low leverage levels relative to asset quality supporting competitive cost of borrowing advantages uncommon among mid-cap industrial REIT peers.
Capital investment during the quarter balanced between improvements on existing stabilized assets ($14 million) focused on tenant enhancements/maintainance plus substantial ($45 million) deployment into ongoing development/value-add pipelines demonstrating investment discipline aligned with long-term value creation objectives [S12][S25].
Key Forward-Looking Indicators and Execution Risks
Crucial watch points pivot on maintaining stable occupancy during significant lease rollover activity slated through late-2026 comprising roughly ~7-8% of annualized base rent—a figure already improving as recent lease renewals reduce expirations indicating successful retention/rollover tactics [S20][S27]. Timely delivery of under-construction developments also bears monitoring as delays could disrupt revenue ramp profiles or increase costs amidst tightened labor/material markets.
Inflation trajectory remains uncertain impacting administrative non-pass-through expenses; any protracted acceleration could pressure margins even as contractual escalations offset direct property operating cost rises (analysis). Cybersecurity receives clear governance focus via dedicated committees featuring senior management expertise ensuring preparedness against evolving digital threats—a notable operational resilience element embedded within corporate oversight structures [S1]. Geopolitical factors affecting supply chains represent external risk multipliers requiring ongoing vigilance.
Overall execution consistency combined with measured capital deployment will dictate ability to sustain growth rhythm underpinning current positive momentum heading into subsequent quarters.
Financial Profile Supporting Operational Trajectory
Fiscal year-end data corroborate upward trajectory evident in quarterly disclosures: revenue ascended to approximately $721 million for FY2025 representing a healthy +12.7% year-over-year increase; operating income similarly climbed (+14%) underscoring margin expansion amid rising rents coupled with effective cost controls ([F1]). Operating cash flow grew +15.4% YoY supporting ample internal funding capacity; reported free cash flow (operating cash flow less capex) approximated $474 million signaling robust liquidity fundamentals ([F1]). Equity base steadily increased exceeding $3.49 billion reflecting retained earnings accumulation plus fresh equity issuances contributing capital for development programs ([F1]).
Q1 results detailed net income attributable to common stockholders surging approximately +55% year-over-year to ~$95 million ($1.77 per share diluted basis), driven by higher PNOI ($140M) partially offsetting elevated depreciation/amortization from acquired/developed properties ([F1],[S29]). Interest expense rose modestly consistent with new debt issuances but remained controlled through hedging strategies ([F1],[S15]). Diluted shares increased slightly due to ATM program issuances influencing per-share metrics moderately ([F1],[S20]).
Summary Tables:
Historical performance (annual)
| FY | Rev ($mm) | CFO ($mm) | Rev YoY |
|---|---|---|---|
| 2025 | 721 | 481 | +12.7% |
| 2024 | 640 | 417 | +12.2% |
| 2023 | 571 | 338 | +17.2% |
| 2022 | 487 | 317 |
Source: SEC companyfacts cache [F1].
| Debt Maturity Profile | Principal Amount/Interest Rate |
|---|---|
| Oct ’26 | $100M / ~2% |
| Dec ’26 | $40M / ~3.75% |
| Mar ’27 | $100M / ~1.7% |
| Aug ’27 | $75M / ~3.89% |
| Years ’28–’31+ | $620M+ / ~3.63%-3.83% |
EastGroup Properties is positioned solidly within a structurally advantaged industrial market segment anchored by location scarcity around high-demand logistics nodes combined with proactive asset management fostering resilient occupancy rates and accelerating rental rate growth embedded contractually under triple-net leases mitigating inflation extraction risks from operators’ side.
Near-term challenges persist from macroeconomic uncertainty including variable interest rates impacting cost of capital although mitigated somewhat via fixed-rate debt swaps plus geopolitical concerns affecting global trade patterns which underpin many tenants’ operations.
Investor attention should center on EastGroup’s ability to execute leasing rollovers effectively amidst lease expiry concentrations later this year while advancing timely completion of development ventures visible already committed under construction volumes representing over half-billion dollars planned investment—key drivers shaping follow-on revenue expansion potential.
Disclaimer: This analysis is provided solely for informational purposes without any recommendation or advice regarding securities or investments related to EastGroup Properties Inc.
Disclaimer: This is research-only, informational analysis and not investment advice. It may include AI-generated interpretation and general industry context. Always verify important details using primary sources.
Comments