
Chevron’s Integrated Model Balances Upstream Growth and Downstream Margins Amid Market Volatility
Chevron’s latest quarter highlights robust earnings supported by upstream production gains and refining optimization despite commodity price pressures and regulatory risks.
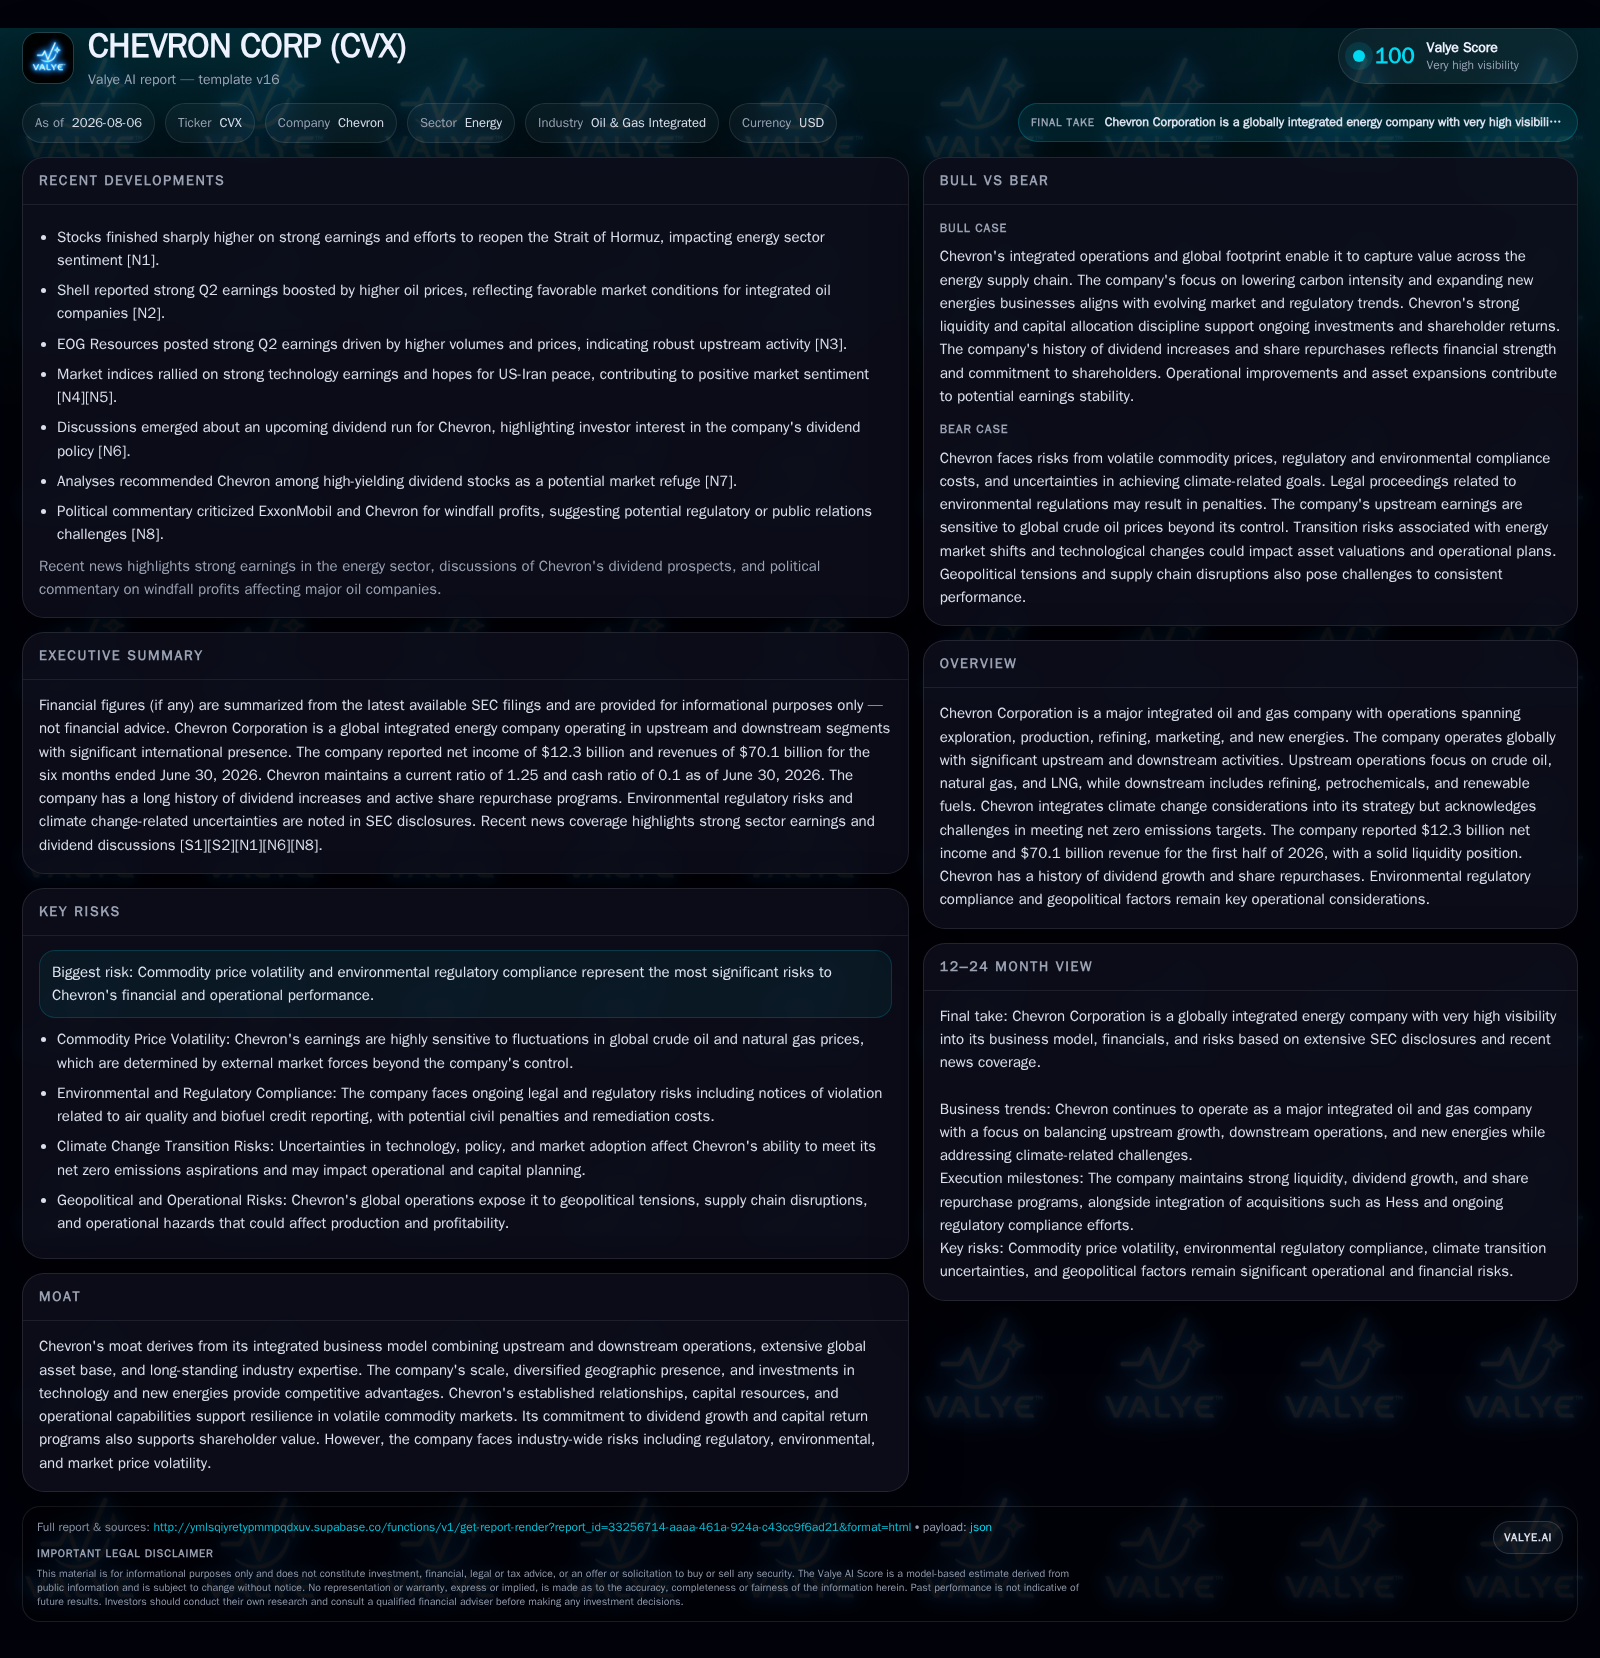
Chevron Corporation reported strong second-quarter 2026 earnings of $12.1 billion, driven by increased upstream production and improved downstream refining utilization. The company's integrated oil and gas business model allows it to capture value across exploration, production, refining, and marketing, offsetting volatility from commodity markets. While Chevron maintains a solid liquidity position with a current ratio of 1.25, it faces ongoing challenges from regulatory compliance, asset decommissioning obligations, and geopolitical uncertainties. Its strategic investments in U.S. shale, offshore developments, and renewable fuels will be critical growth drivers as Chevron navigates the energy transition.
Recent Operating Update
These operational gains offset headwinds from lower crude price realizations relative to Brent benchmarks and foreign currency impacts that traditionally affect international earnings segments. Chevron’s ability to leverage its integrated business model across upstream production, midstream logistics, refining, petrochemicals, and marketing channels continues to provide resilience against fluctuations in individual commodity prices or regional market disruptions [S9][S21]
Business Model Analysis
Chevron operates as a fully integrated oil and gas major engaged across the hydrocarbon value chain starting with exploration and production (E&P) of crude oil, natural gas including liquefied natural gas (LNG), followed by midstream transportation and storage services. Downstream activities encompass refining crude oil into petroleum products such as gasoline, diesel, jet fuel, lubricants, alongside manufacturing petrochemicals and renewable fuels.
Revenue generation follows a multi-step monetization approach: sales of crude oil and natural gas mainly priced off benchmark indices (Brent for crude), followed by margin capture on refined product sales heavily influenced by refining capacity utilization rates and downstream refining margins. Marketing operations extend product reach through wholesale and retail distribution networks globally.
Chevron’s breadth across upstream assets—including shale basins like Permian and offshore growth hubs such as Guyana—combined with its downstream refinery optimization enables it to shift capital between segments based on market signals to maximize return on capital employed (ROCE). The firm’s incremental investments into low-carbon technologies underline a forward-looking diversification during evolving regulatory frameworks targeting carbon emissions.
Industry Structure and Competitive Position
As an integrated major alongside peers like ExxonMobil, Shell, BP, TotalEnergies, and ConocoPhillips, Chevron benefits from scale economies across exploration success rates, reserve quality, refining capacity positioning, and capital expenditure efficiency. Its geographic diversification reduces exposure to localized geopolitical disturbances or regulatory regimes while supporting access to varying basin types.
Integrated players’ margins tend to be more stable compared to pure upstream companies due to vertical integration opportunities: for instance, when crude prices drop but refining margins widen due to supply-demand imbalances downstream. However, this structure also demands managing complex operational footprints subject to capital intensity constraints.
Chevron holds a competitive edge in reserve replacement; its reported reserve replacement ratio was 158% in 2025 reflecting replenishment exceeding production depletion—critical for sustaining long-term upstream cash flows [S23]. Refining utilization improvements particularly leveraging light tight oil feedstock expansions illustrate its adaptive response to changing supply dynamics [S25].
Growth Drivers
Chevron’s near-to-medium term growth strategy hinges on several pillars:
- Upstream production expansion: Focused capex (~$17B projected for upstream in 2026) toward high-return shale plays (Permian Basin, DJ Basin) alongside global offshore developments mainly in Guyana and Eastern Mediterranean shores drives volume increases [S22].
- Downstream optimization: Enhancing refinery throughput capacity (e.g., Pasadena Light Tight Oil project) boosts refined product yields allowing better margin capture amid volatile crude inputs.
- Investment in new energies: Around $1B of annual capital is dedicated to lowering carbon intensity via renewable fuels development and carbon capture initiatives aligning with energy transition trends.
- Structural cost savings: Targeting $3–4 billion cumulative cost reductions through portfolio optimization and productivity-enhancing technologies aims to maintain margin resilience despite cyclical pressures [S18].
- Asset transactions: Continued disciplined asset divestitures are expected to generate proceeds toward redeploying capital into higher-growth opportunities with recurring returns [S11].
Monitoring KPIs such as barrels of oil equivalent (BOE) per day production volumes—reported growing by over 100k barrels/day year-over-year—and refinery utilization rates offer real-time demand proxies confirming execution progress.
Risks and Watchpoints
Chevron faces prevalent industry risks including:
- Commodity price volatility: Earnings remain highly sensitive to global crude benchmarks like Brent or WTI; price downturns directly compress upstream operating income notwithstanding some sheltering via downstream integration.
- Environmental regulations: Multiple Notices of Violation concerning air quality standards at U.S. refineries pose potential civil penalties upwards of $1 million each; resolution timelines remain uncertain but imply ongoing compliance costs [S8][S1].
- Climate change litigation: Chevron is involved in complex lawsuits alleging misrepresentation of climate risks which may introduce material financial exposure beyond accrued reserves though management contests their merit vigorously [S20].
- Operational hazards: Risks of unplanned outages due to weather events or mechanical failures can disrupt both upstream production capacity or downstream refining efficiency impacting margin realization.
- Reserve replacement challenges: Sustaining reserve replacement ratios above depletion levels is essential; failure risks longer-term production declines.
- Capital intensity constraints: Large project execution delays or cost overruns linked especially to offshore developments could impair expected growth trajectories.
What To Watch Next
Key indicators will include:
- Quarterly updates on upstream production volumes split by asset class (shale vs offshore) validating organic growth assumptions.
- Refinery throughput capacity utilization trends signaling downstream demand resilience amid shifting fuel product consumption profiles.
- Progress reports on renewable fuels portfolio expansion reflecting Chevron’s energy transition positioning.
- Developments on regulatory resolution including timing/outcomes of environmental violation settlements impacting cash flow guidance.
- Capital expenditure pacing relative to announced budgets for upstream vs downstream segments revealing any shifts linked to market repricing or technological advances.
- Legal proceedings progression details clarifying litigation risks associated with climate-related lawsuits.
Financial Profile Discussion
Chevron maintains a strong liquidity buffer supported by total current assets of approximately $49 billion against current liabilities around $39 billion as of June 30, 2026—translating into a current ratio near 1.25 highlighting comfortable short-term solvency [F1]. Cash and equivalents stood near $4 billion last reported mid-2024 while total debt measured about $31 billion at end-2025 yielding net debt close to $27 billion after cash offsets [F1].
Free cash flow generation remains substantial allowing Chevron flexibility for stock repurchases alongside strategic investment activities elucidating prudent capital allocation aligned with shareholder value maximization strategies.
Disclaimer: This analysis is for informational purposes only based on publicly available information from company SEC filings and news releases as referenced; it does not constitute investment advice or research views.
Disclaimer: This is research-only, informational analysis and not investment advice. It may include AI-generated interpretation and general industry context. Always verify important details using primary sources.

Comments