
Diversified Energy Co: Acquisition-Driven Scale Meets Liquidity and Margin Headwinds
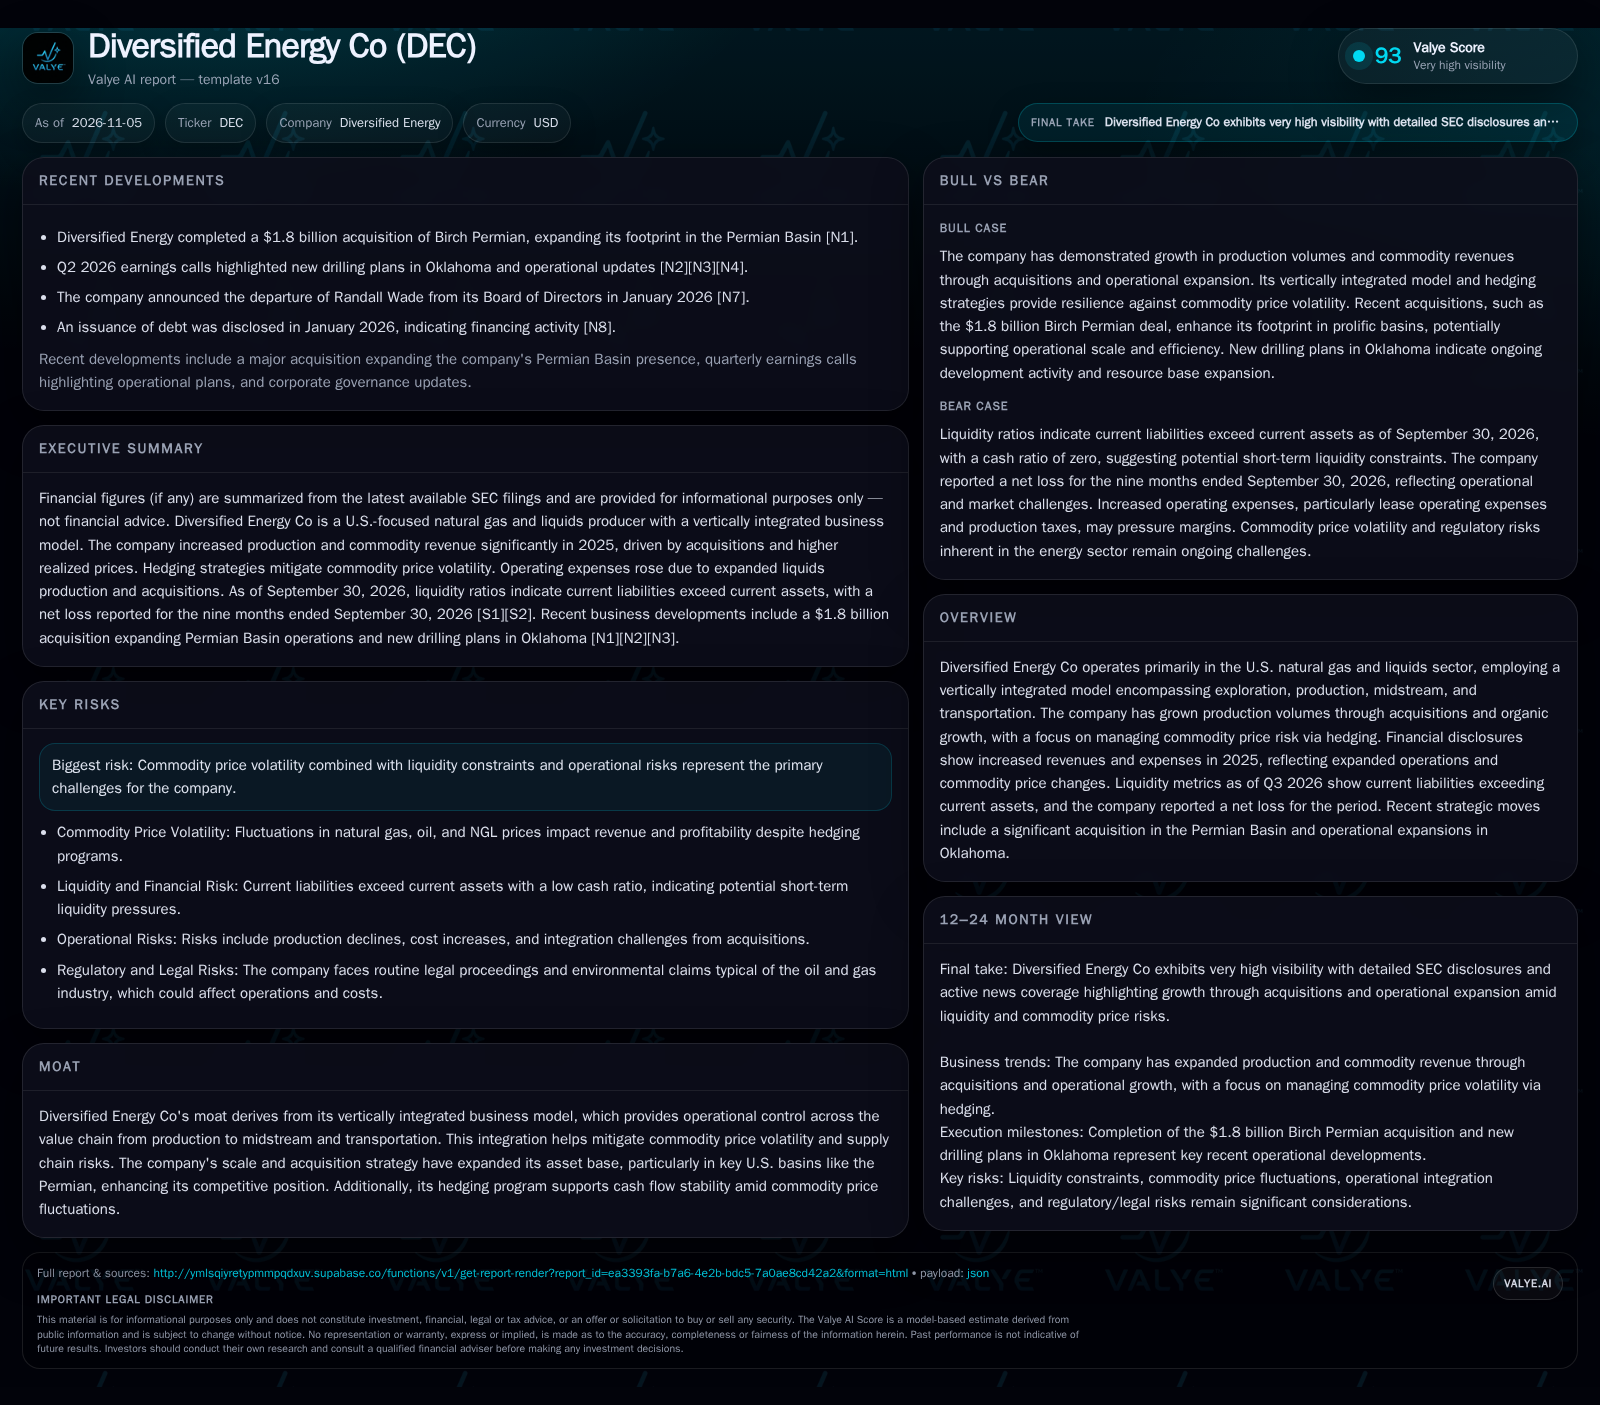
Diversified Energy Co’s rapid production and revenue growth in 2025, fueled by major acquisitions and higher realized natural gas prices, has been offset by sharply rising operating costs and a liquidity profile where current liabilities now substantially exceed current assets.
Recent acquisitions and natural gas price gains drove a 110% increase in commodity revenue for Diversified Energy Co in 2025, but operating costs and current liabilities also surged. Watch for updates on cost control, hedging effectiveness, and cash management as the company moves forward.
Diversified Energy Co has rapidly expanded its operational footprint and revenue base through a series of acquisitions, notably boosting both production volumes and realized natural gas prices in 2025. Yet this accelerated growth has come with sharply higher operating costs and a liquidity profile that now shows current liabilities far outstripping current assets. The company’s strategy—anchored in vertical integration and extensive commodity hedging—offers some insulation from market volatility, but a persistent net loss and minimal reported cash balance highlight the risks of scale-driven expansion if costs and integration challenges are not contained.
Production Growth and Liquidity Strain Define Current Operating Reality
In 2025, Diversified Energy Co’s total production volumes increased by 37% compared to the prior year, propelled by the acquisitions of Maverick Natural Resources and Canvas Energy as well as full-year output from previous deals [S1]. Alongside this, average realized sales prices—especially for natural gas—jumped 53% before the effect of derivatives, with natural gas up 48% year-over-year, though oil and NGL prices declined. As a result, commodity revenue more than doubled, rising 110% to $1.539 billion [S1].
However, this expansion came at a cost: operating expenses surged 51% in 2025, reflecting higher lease operating expenses and production taxes due to asset base growth and increased liquids production [S1]. [S2] Net income for the first nine months of 2026 was a loss of $202.44 million with negative earnings per share [S2].
Roughly 80% of production was hedged at year-end 2025, providing a measure of insulation from commodity price swings [S1].
How Scale, Hedging, and Integration Shape Earnings Power
Diversified Energy Co’s revenue model is primarily volume-driven, with realized pricing for natural gas and liquids a significant swing factor. The company’s vertically integrated structure—from upstream production through midstream operations and transportation—should, in theory, allow for greater control over costs and margins, as well as modest pricing leverage in regional markets. However, the economics of this model are highly sensitive to both commodity price cycles and the efficiency of integrating acquired assets.
Operating leverage is potentially significant: fixed costs can be spread over a larger production base as acquired assets are assimilated, but this only materializes if integration is smooth and cost synergies are captured. The sharp 51% rise in operating expenses in 2025, outpacing volume growth, suggests that acquisition-driven expansion has yet to fully translate into cost efficiencies [S1]. Lease operating expenses and production taxes—both variable and somewhat fixed in nature—rose meaningfully alongside liquids output.
Hedging 80% of production provides revenue and cash flow stability, but it also caps upside during sustained commodity price rallies and may introduce basis risk. Ongoing debt issuance (as noted in early 2026) suggests reliance on external funding to bridge liquidity gaps [N7].
Vertical Integration and Hedging: Strengths and Vulnerabilities in a Crowded Field
Diversified Energy Co’s vertically integrated operations theoretically confer advantages over pure-play upstream producers: control over midstream and transport can reduce third-party costs, improve market access, and buffer against supply chain disruptions. In a sector where commodity price volatility and regional basis differentials can be acute, this integration—combined with a robust hedging program—offers some resilience.
However, the competitive landscape for U.S. natural gas and liquids producers remains intense, with both large integrated majors and nimble independents vying for scale and efficiency. Recent acquisitions have expanded Diversified Energy’s footprint, particularly in prolific basins (e.g., the $1.8 billion Birch Permian deal), but also increase integration and execution risk [N1]. Larger peers may have greater balance-sheet flexibility and access to capital, while smaller operators can sometimes outpace on cost discipline and asset focus.
Switching frictions for midstream customers are moderate, but not insurmountable; regional infrastructure constraints and long-term contracts can provide some stickiness, but the company’s ability to maintain cost and service advantages will be tested if commodity prices weaken or if integration falters.
If Integration Efficiencies and Commodity Prices Align, Margin Expansion Could Follow
A favorable scenario for Diversified Energy Co unfolds if the company successfully integrates its recent acquisitions, extracting operating synergies and driving down per-unit costs. If commodity prices—especially for natural gas—remain robust, the company’s hedging program could lock in healthy margins while still allowing some upside from unhedged volumes.
In this scenario, operating expense growth would decelerate relative to production gains, and free cash flow would improve, enabling the company to rebuild its reported cash balance and reduce reliance on external financing. Evidence confirming this would include a sequential decline in lease operating expenses per unit, stabilization or improvement in the current ratio, and a return to positive net income and operating cash flow, even as production volumes remain elevated.
Sustained discipline in capital allocation—prioritizing organic development and selective, accretive acquisitions—would further support this outcome. The company could also benefit from regulatory tailwinds or infrastructure expansions that ease midstream bottlenecks.
Integration Drag and Mixed Price Environment Likely to Keep Margins Tight
The most plausible near-term scenario is one in which Diversified Energy Co continues to post elevated production and revenue figures, but margin expansion is hampered by lingering integration costs and only moderate commodity price support. Operating expenses may remain high as the company works through the complexities of assimilating new assets and normalizing its cost structure.
Hedging will continue to dampen the impact of price swings, but may also limit participation in any rally. Liquidity constraints persist, requiring continued vigilance in working capital management and possible further debt or asset sales if cash flow does not improve. Net income could remain negative or only marginally positive unless cost discipline improves materially.
Confirmation of this scenario would involve persistent low or negative current and cash ratios, continued net losses, and only gradual improvement in per-unit cost metrics. Conversely, a sharp and sustained decline in expenses or a material positive swing in net income would challenge this base case.
Commodity Price Weakness or Integration Missteps Could Trigger Financial Stress
In a downside scenario, Diversified Energy Co faces a combination of weaker natural gas and liquids prices and continued cost overruns or integration difficulties. If hedging coverage rolls off or proves less effective due to basis risk, revenue could fall sharply while high operating expenses persist, compressing margins and exacerbating net losses.
Under these conditions, the company’s already tight liquidity position could deteriorate further, potentially forcing asset sales, dilutive equity raises, or distressed debt issuance. Debt service burdens could rise, and regulatory or legal challenges could add to the strain.
Confirmation of this scenario would include further deterioration in liquidity ratios, a sharp drop in commodity revenue, persistently negative or worsening net income, and announcements related to asset sales, covenant breaches, or restructuring efforts.
What Will Determine Whether Scale Delivers Profitable Growth for Diversified Energy Co?
Quarterly trends in lease operating expenses and production taxes per unit; improvement would indicate successful integration and cost control.
Current and cash ratios in upcoming financial reports; stabilization or improvement would suggest reduced liquidity risk.
Net income and operating cash flow trends; a return to profitability is a key milestone for thesis validation.
Volume-weighted average realized prices for natural gas, oil, and NGLs, both before and after hedging, if disclosed.
Hedging coverage levels and mark-to-market impacts; changes in strategy or effectiveness could materially affect cash flow.
Updates on asset sales, new financings, or capital raises—especially if driven by liquidity needs rather than strategic growth.
Integration progress and cost synergy disclosures related to recent acquisitions, including any material restructuring charges or operational disruptions.
Disclaimer: This is research-only, informational analysis and not investment advice. It may include AI-generated interpretation and general industry context. Always verify important details using primary sources.

Comments