
DNOW Inc. Struggles with Transition but Eyes Growth from MRC Global Acquisition
The integration of MRC Global has disrupted DNOW's financial performance in 2025, challenging historical profitability but offering a pathway to expanded digital and supply chain leadership.
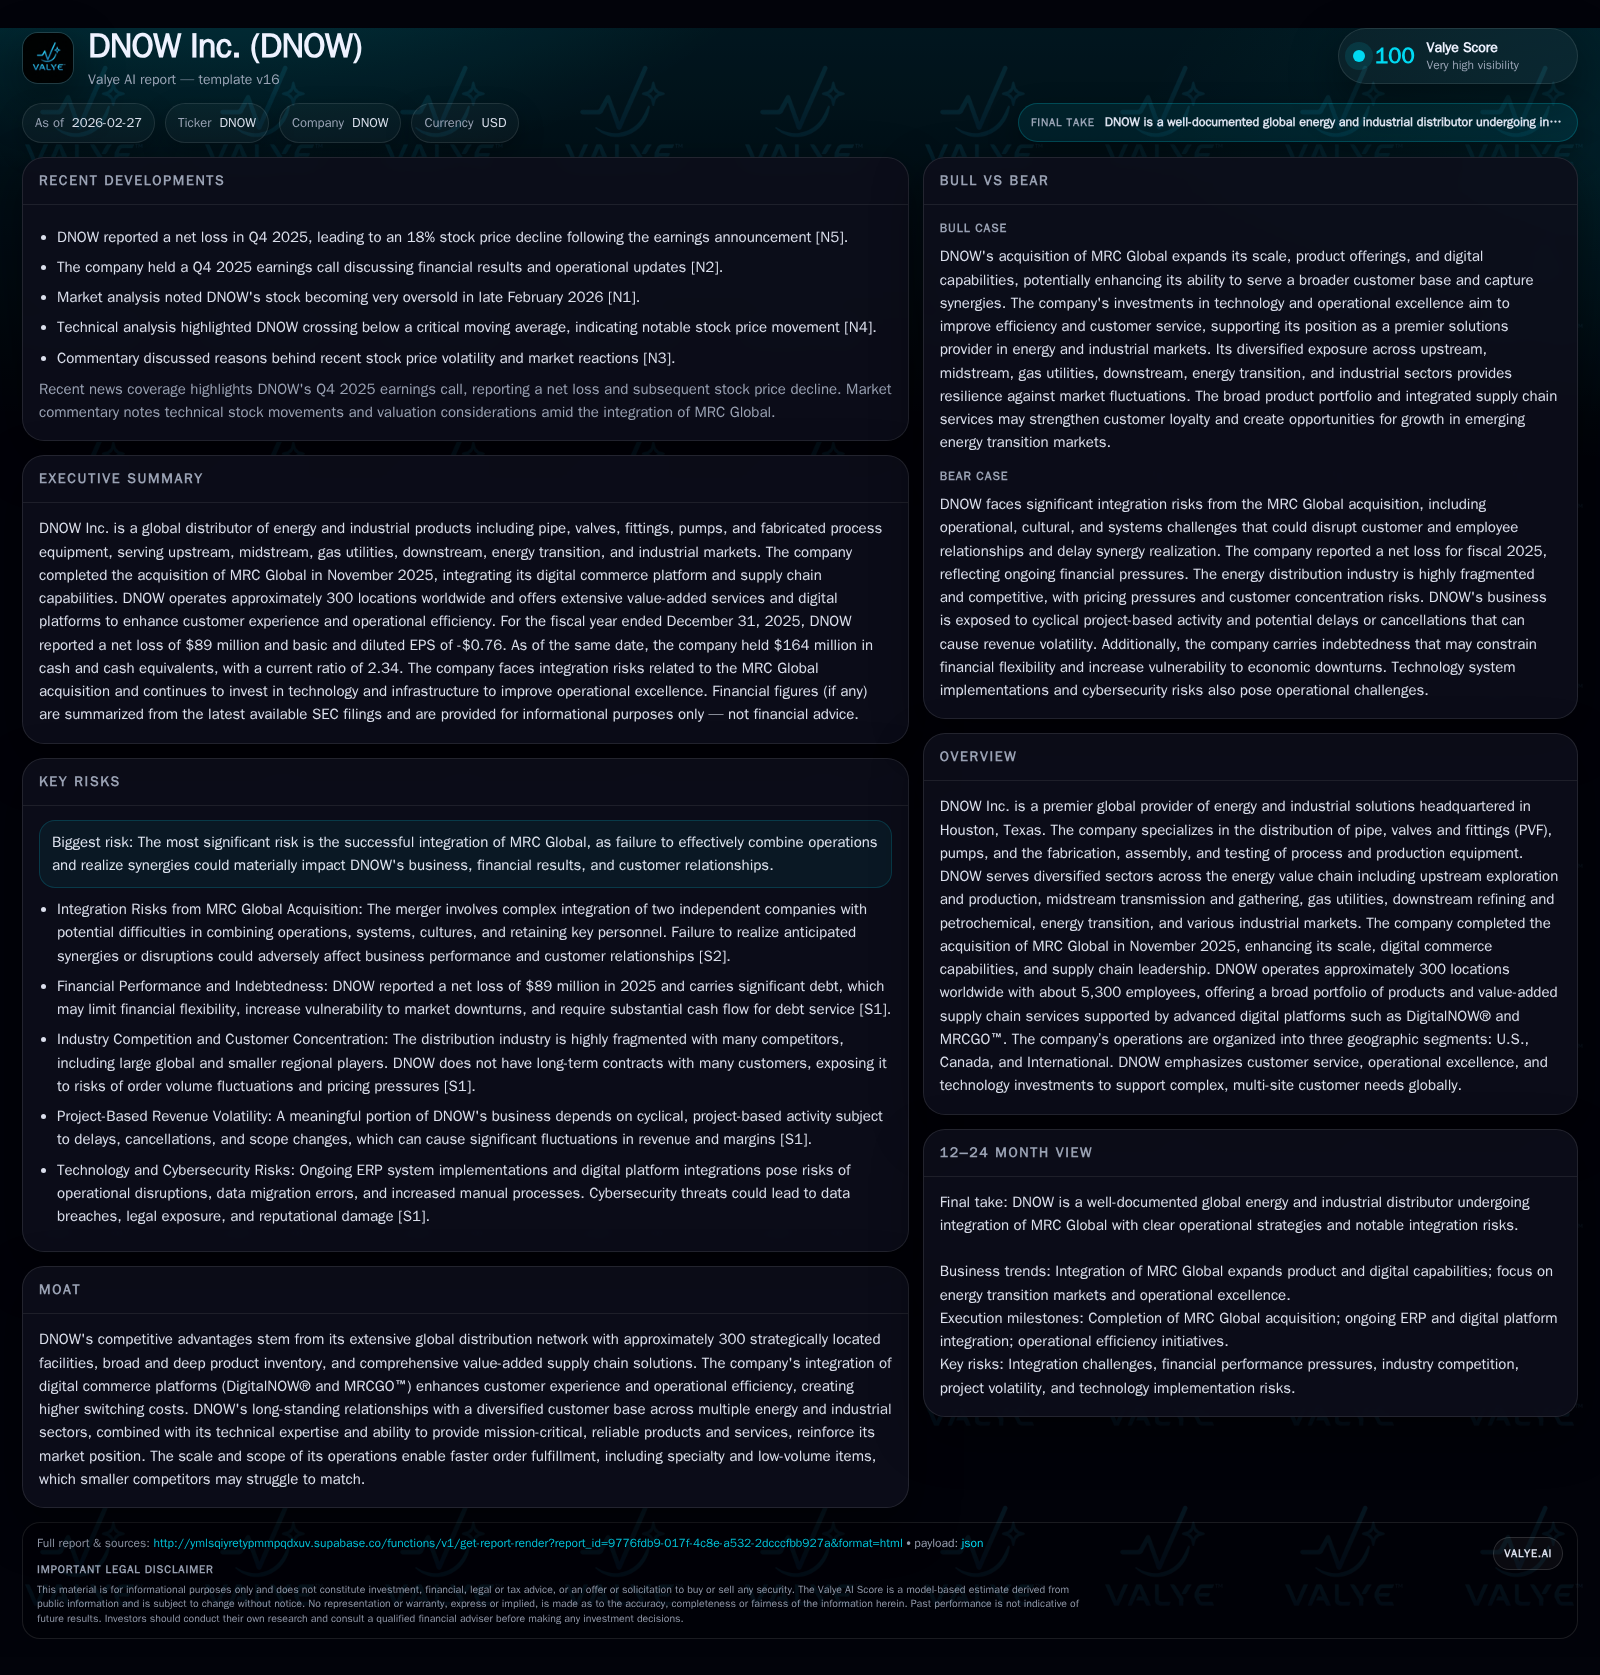
DNOW Inc., a leading global distributor in energy and industrial solutions, experienced a sharp operational setback in 2025 following its acquisition of MRC Global. While revenue grew by approximately 24% year-over-year, the company reported a significant operating loss of $93 million and a net loss of $89 million, primarily due to restructuring costs and ERP system integration challenges. Despite these near-term issues, DNOW’s broad geographic reach, extensive inventory, and digital platform expansion provide groundwork for future growth. Capital allocation remains disciplined with positive operating cash flow supporting ongoing investments and buybacks. Near-term risks center on successful merger integration and the volatility of the energy supply chain environment.
Legacy Growth Performance Before Integration
Before the MRC Global acquisition, DNOW demonstrated solid business fundamentals characterized by steady growth in revenues and profitability. From fiscal year (FY) 2017 through FY 2024, DNOW increased annual revenue from $669 million to an implied higher base prior to merger (with 24.3% overall revenue increase in 2025 including MRC Global), complemented by consistent operating income ranging from $113 million in FY 2024 to $140 million in FY 2023 [F1]. This performance was underpinned by operational efficiency gains, strong market positioning within PVF distribution, pump solutions, and fabricated production equipment serving upstream through downstream energy sectors. Cash generation trended positively with operating cash flows exceeding $200 million before the acquisition [F1].
The company benefited from multi-pronged sales strategies targeting regional to global customers across its approximately 300 strategically located facilities worldwide staffed by technical experts supporting mission-critical product delivery. This scale enabled rapid order fulfillment including specialty items often unavailable through smaller distributors or local suppliers. DNOW’s investment in digital ordering platforms such as DigitalNOW® enhanced customer self-service options while optimizing supply chain management—a factor that contributed to gradational margin improvements pre-2025 [S4][S7].
This historical base established a resilient commercial platform delivering both diverse energy market exposure and operational discipline.
Historical performance (annual)
| FY | Net ($mm) | CFO ($mm) | OpInc ($mm) | Capex ($mm) | Net YoY |
|---|---|---|---|---|---|
| 2025 | -89 | 155 | -93 | 21 | -209.9% |
| 2024 | 81 | 298 | 113 | 9 | -67.2% |
| 2023 | 247 | 188 | 140 | 17 | +93.0% |
| 2022 | 128 | 0 | 131 | 9 |
Source: SEC companyfacts cache [F1].
Capital returns and efficiency (annual)
| FY | Buybacks ($mm) | FCF ($mm) | ROE% |
|---|---|---|---|
| 2025 | 37 | 134 | -4.0 |
| 2024 | 23 | 289 | 7.2 |
| 2023 | 50 | 171 | 23.3 |
| 2022 | 7 | -9 | 15.2 |
Source: SEC companyfacts cache [F1].
Numbers reflect core operations prior to MRC merger inclusion; operating income and net income from continuing operations per [F1].
Impact of MRC Global Acquisition on 2025 Results
The strategic acquisition agreement executed mid-2025 integrated MRC Global’s substantial scale and digital commerce assets into DNOW; however, this complex all-stock transaction also proved highly disruptive during the initial post-merger phase. Closing occurred November 6, shortly before year-end reporting deadlines [S1][S2]. This limited timeframe contributed to substantial one-time costs related to restructuring initiatives, workforce realignment, rationalization of overlapping functions, and particularly ERP system consolidation challenges inherited from MRC Global.
Consequently, the financial results for full-year FY 2025 reveal stark contrasting dynamics: revenues increased by roughly 24% reflecting combined operations synergies but profitability reversed dramatically with an operating loss of $93 million versus positive $113 million prior year. Net income swung from a gain of $81 million to a loss of $89 million [F1], largely attributable to non-recurring integration expenses including an inability to achieve projected cost savings on schedule.
Management has openly recognized persistent ERP system instability as a key impediment hampering operational cadence—this affects order processing efficiencies and fulfillment accuracy which are vital in PVF distribution where timely delivery impacts costly industry downtime [N1][S2]. Expectations have been moderated that full ERP stabilization will be extended into early-to-mid-2026.
The magnitude of integration complexity is consistent with known industry experiences involving large distributor mergers where IT systems synchronization often introduces multi-quarter expense pressures before full benefits materialize.
Operational and Market Factors Influencing Recent Performance
Externally, DNOW contended with variable market factors amplifying internal challenges during its first full year post-acquisition. The upstream oil & gas sector continues its inherently cyclical capital expenditure patterns affected by oil price volatility driven by geopolitical tensions and demand-supply imbalances globally. Such capex variability creates uneven demand cycles for PVF products necessary for infrastructure buildouts and maintenance programs.
Additionally, inflationary pressures raised input costs for steel-based products integral to DNOW’s offerings alongside elevated transportation costs due to freight carrier constraints impacting logistics expenses [S1][S5]. These factors compressed gross margins further as pricing adjustments often lag behind raw material surges due to contract structures.
Heightened inventory risk arose as legacy stocking policies required recalibration amidst merging two large inventories post-MRC deal; excess or obsolete stock exposures carry working capital cost implications [S1]. Midstream transmission projects faced delays tied to permitting complexities and seasonal shutdowns typical within Canadian operations accentuating revenue timing fluctuations [S8][S16].
Overall these operational headwinds highlight how sensitive PVF distribution margins are to both macroeconomic forces and internal supply chain efficiencies.
Digital Platform Expansion as a Strategic Differentiator
Central to DNOW’s strategy pre- and post-merger has been investment in advanced digital commerce platforms — notably DigitalNOW® originally developed internally, now complemented by MRCGO™, inherited from the acquired firm [S7][N1]. These platforms enable customers direct access to order materials online with detailed product catalogs incorporating supplier certifications and pricing algorithms customized per corporate accounts.
By embedding themselves deeper into client procurement systems via multi-tier inventory visibility tools and automated replenishment features, DNOW aims to reduce total transaction costs for customers while increasing switching costs—critical in an industry where reliability is paramount.
Such digital transformation offers a competitive moat beyond traditional physical inventory footprint advantages by streamlining procurement cycles across large distributed energy infrastructure projects demanding rapid response times. During recent quarters despite ERP setbacks affecting back-end processes, customer uptake metrics for these self-service tools have steadily advanced per management commentary indicating long-term value potential [N1].
E-commerce ecosystems like DigitalNOW® represent pathway enhancements beyond mere transactional volume increases — they drive data-driven supply chain optimization which can translate into lower overhead ratios as platform maturity advances.
Capital Allocation: Cash Flows, Dividends, and Buybacks Amid Pressures
Despite reported losses at the profit line level reflecting substantial non-cash restructuring charges along with extraordinary expenses linked directly to the merger process; DNOW produced robust operating cash flow totaling approximately $155 million for FY 2025—down nearly half from $298 million last year but sufficient demonstrating underlying business solidity [F1].
Capital expenditures increased materially to $21 million (+133% YoY), reflecting investments aimed at operational integration including IT infrastructure upgrades which should underpin future efficiency gains.
Share repurchases remained active though more measured in scale versus prior years with about $37 million deployed compared to $23 million in FY 2024 [F1]. Dividend payments remain stable though management reports conservative outlooks pending successful operational turnaround.
ROE turned negative (~ -4%) reflecting net income losses relative to expanded equity post-merger balance sheet build; the sturdy equity base rose sharply from $1.12 billion at end-2024 to over $2.23 billion due largely to share issuance combined with goodwill additions from acquisition accounting considerations [F1].
Overall capital stewardship reflects balancing act between sustaining shareholder distributions while funding integration investments necessary for longer horizon value creation.
Outlook and Key Risks to Monitor in the Near Term
Management acknowledges merger execution risk remains elevated given ongoing ERP system challenges alongside customary cultural blending obstacles inherent to combining two sizable distributors previously functioning independently over decades [N1][S2]. Any failure to fully realize expected revenue synergies or cost savings could pressure margins beyond current forecasts.
Industry cyclicality tied closely to oil & natural gas price swings presents ongoing uncertainty especially amid geopolitical developments affecting energy supply chains globally [S20]. Inflation may continue pressuring procurement costs if steel prices rise unexpectedly without commensurate price pass-through capability.
Cybersecurity vulnerabilities coupled with reliance on third-party logistics partners pose additional operational risk exposure that requires continual oversight given critical nature of product delivery timeliness within end-markets served [S1].
Legal liabilities including asbestos-related claims represent legacy contingent risks detailed within filings; while not currently materializing as large individual settlements their aggregate effect bears watching especially under evolving regulatory scrutiny [S13][S20].
These factors outline key focal points investors should track through ensuing quarters for signs of stabilizing operations enhancing confidence around merger success trajectory.
What Investors Should Watch Next
While explicit forward guidance remains cautiously conservative due to transitional uncertainties highlighted during Q4 earnings call [N1], several measurable KPIs will serve as barometers assessing DNOW’s ability to emerge stronger:
- Progress milestones on full ERP stabilization minimizing order processing errors,
- Realization of projected cost synergies lowering SG&A burden,
- Improvement in gross margin percentages driven by efficient inventory management,
- Uptake metrics for DigitalNOW®/MRCGO™ platforms indicating deeper client engagement,
- Free cash flow growth resurgence supporting balanced capital returns,
- Adjustments in dividend payout ratio or accelerated buyback programs signaling confidence recovery,
- Customer retention rates among large upstream/midstream operators reflective of service reliability restoration,
- Monitoring competitor moves particularly manufacturers selling direct could test DNOW’s distributor positioning.
In sum, while near-term pressure on profitability tempers optimism, DNOW’s vast product breadth across essential infrastructure sectors combined with expanding digital ecosystem investments position it well over medium term—conditional upon deft resolution of integration challenges.
This analysis is based solely on publicly available information as of February 27, 2026, including SEC filings ([F1],[S#]), earnings call transcripts ([N#]), and operative disclosures from DNOW Inc. It is intended for informational purposes only without providing investment advice or recommendations.
Disclaimer: This is research-only, informational analysis and not investment advice. It may include AI-generated interpretation and general industry context. Always verify important details using primary sources.
Comments