
Domino's Pizza Navigates Growth from Franchise Expansion and Supply Chain Efficiency Amid Rising Costs
Domino's Pizza Inc.'s global franchise-driven model delivers steady revenue growth supported by strong brand presence and operational leverage while balancing rising commodity costs and debt obligations.
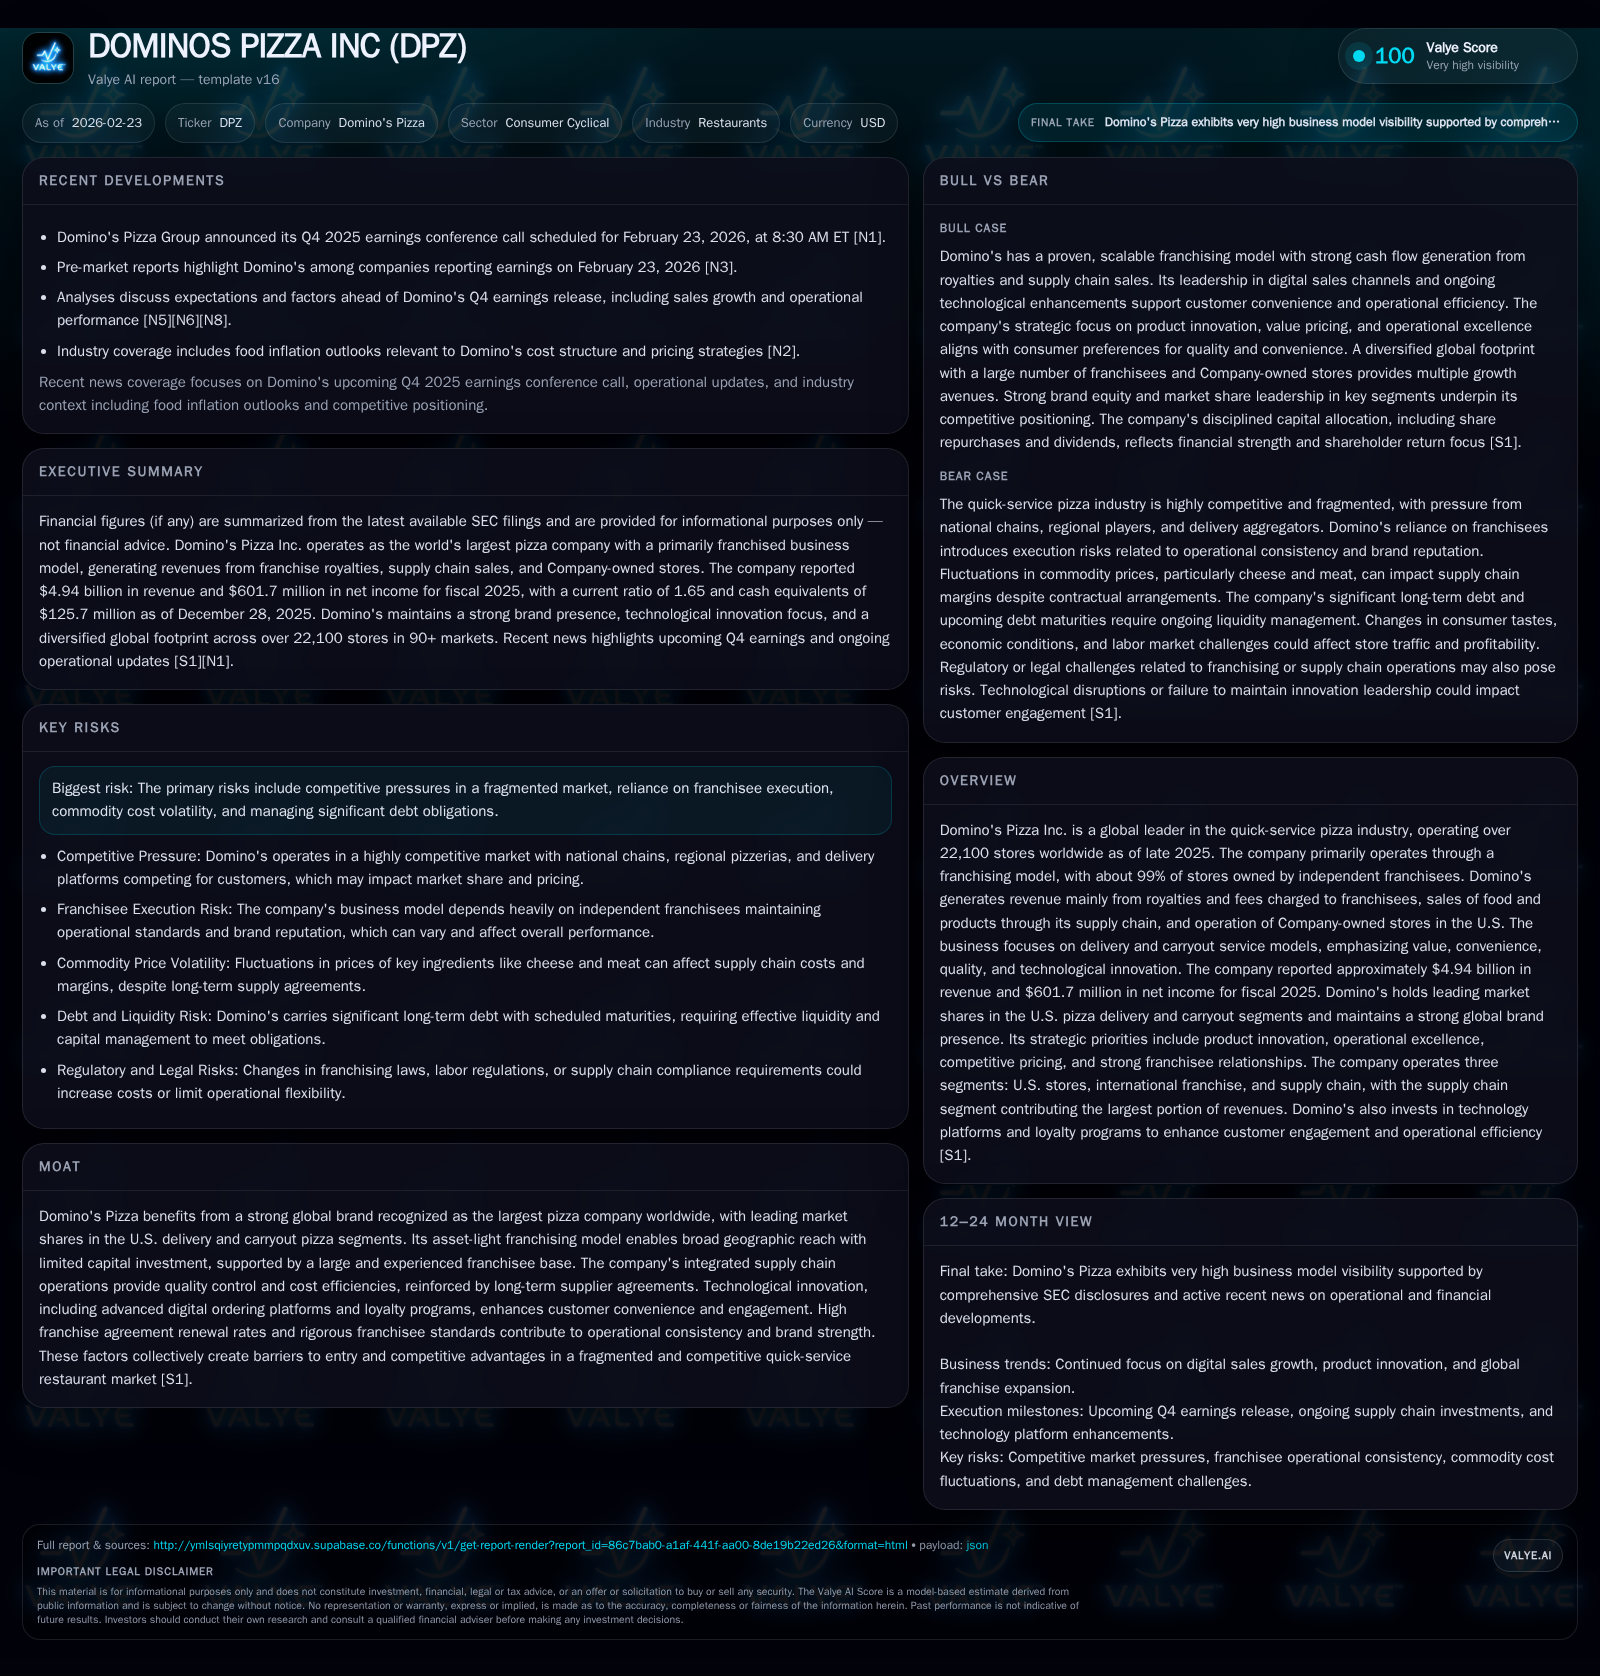
Domino's Pizza Inc. reported a 5% revenue increase in fiscal 2025, fueled by system-wide sales growth from its asset-light franchising approach that covers over 22,100 stores worldwide. The company’s operational model depends on royalties, supply chain sales, and a limited number of company-owned stores focused on innovation and efficiency. While industry-leading market shares in U.S. delivery and carryout segments provide competitive advantages, Domino’s faces cost pressures from commodity inflation—most notably cheese prices—and carries significant debt from recent recapitalizations. Capital allocation remains disciplined with continued dividends and share repurchases supported by robust operating cash flows.
Overview and Business Model
Domino's Pizza Inc., as of December 2025, operates more than 22,100 stores across over 90 global markets, securing its position as the world's largest pizza company [S16]. The company’s core business model centers on franchising, with roughly 99% of stores owned by independent franchisees who benefit from Domino's brand strength and streamlined operating system without requiring significant capital outlay from the parent company [S4].
The brand has built a global reputation for value, convenience, quality food offerings, and technological innovation since its first franchise opened in 1967. This asset-light model allows Domino's to expand broadly without heavy investment in physical stores.
Domino's operates mainly under two service models: delivery and carryout—the latter increasingly pivotal given changing consumer preferences—supported by efficient store designs optimized for these channels rather than dine-in options which are less emphasized [S16].
Revenue streams primarily include royalties calculated as percentages of franchisee sales, fees associated with new store openings or other franchising activities, supply chain sales of key ingredients such as fresh dough and cheese (especially in the U.S. and Canada), and revenues from company-owned domestic stores that also serve as testbeds for innovation [S4,S6].
Historical Performance: Growth Drivers and Financial Trajectory
From FY2022 to FY2025, Domino's reported consistent revenue growth averaging around 4-5% annually despite industry headwinds including inflationary pressures on input costs [F1]. The following table summarizes key financial measures:
Historical performance (annual)
| FY | Rev ($bn) | Net ($mm) | CFO ($mm) | OpInc ($mm) | Rev YoY | Net YoY |
|---|---|---|---|---|---|---|
| 2025 | 4.9 | 602 | 792 | 954 | +5.0% | +3.0% |
| 2024 | 4.7 | 584 | 625 | 879 | +5.1% | +12.5% |
| 2023 | 4.5 | 519 | 591 | 820 | +2.8% | +1.7% |
| 2022 | 4.4 | 510 | 654 | 780 |
Note: Omitted columns lack sufficient annual XBRL coverage in the provided tags (need ≥2 annual points): Capex. Source: SEC companyfacts cache [F1].
Capital returns and efficiency (annual)
| FY | Div ($mm) | Buybacks ($mm) | FCF ($mm) |
|---|---|---|---|
| 2025 | 237 | 358 | 672 |
| 2024 | 210 | 330 | 512 |
| 2023 | 170 | 269 | 485 |
| 2022 | 139 | 1321 | 560 |
Source: SEC companyfacts cache [F1].
Note: Capex includes investments primarily linked to store technology upgrades and supply chain capacity expansion; Dividends represent declared payments; buybacks denote common stock repurchases.
Growth drivers include expanding the global store footprint via franchise openings—both mature markets in the U.S. and developing international markets—and leveraging the supply chain to provide franchisees consistent pricing power tempered by commodity price dynamics [S15,S16]. Same-store sales increases benefit from continuous menu innovation (e.g., new crust styles and specialty pizzas introduced in late FY2025), digital ordering enhancements, and localized marketing efforts aimed at value-conscious consumers seeking convenience.
Operating income improvements reflect superior operating leverage afforded by an efficient store model characterized by smaller footprints optimized for delivery/carryout without costly dine-in amenities, coupled with refined supply chain management reducing waste and enhancing margin preservation [S9].
Future Growth Prospects: Catalysts and Constraints
Key growth opportunities lie in:
- International Expansion: As Domino's deepens penetration in markets outside the U.S., particularly through master franchise agreements with growth minimums targeting underserved regions offering rising demand for convenient food delivery [S19].
- Digital Innovation: Continued investment in proprietary ordering platforms augmented by AI-powered customer insights can improve order accuracy, accelerate delivery times, personalize offers, and enhance customer loyalty.
- Menu Development: Novel product launches sustain repeat customer engagement while catering to evolving taste preferences globally, such as locally adapted offerings (Croissant Pizza in Spain/Mexico or Chicken Burst Pizza in India) [S9].
- Operational Enhancements: Further efficiencies at supply chain centers—including enhanced automation at dough manufacturing plants—and store-level operational improvements may boost margins.
Potential headwinds include:
- Commodity Inflation: Cheese remains the largest food cost component; although pricing to franchisees follows formula-based contracts pegged partly to CME cheddar block prices enabling margin pass-throughs for the Company’s supply chain segment, sustained cheese price volatility can pressure franchisees’ retail pricing strategies affecting volume growth [S10].
- Labor Market Challenges: Store-level wage pressures have mounted due to historical minimum wage increases; ongoing labor shortages risk service consistency or higher operating costs.
- Competitive Dynamics: The quick-service restaurant sector is fragmented but intensely competitive both within pizza delivery/carryout (notably Pizza Hut, Papa John’s) and broader food delivery marketplaces serviced by third-party aggregators such as Uber Eats and DoorDash —to whom Domino's has granted marketplace access agreements—raising margin pressure through commission fees or necessitating promotional intensification [S23].
- Debt Leverage: Despite refinancing efforts extending maturities (e.g., issuance of $1 billion Notes in early FY2025), Domino’s carries nearly $4.8 billion of long-term debt resulting in significant interest obligations that could limit financial flexibility during adverse conditions [S7,S13,S20].
Forecasts and Milestones To Monitor
While explicit forward guidance is not provided in recent filings or earnings releases through Feb ’26 events calendar [N1,N4], key metrics warrant observation:
- Same-store sales trend shifts domestically and internationally given their direct impact on royalty fees.
- New franchised store openings versus closures indicating net unit growth.
- Supply chain gross margin stability amid ingredient cost fluctuations.
- EPS trajectory relative to operating income gains balanced against interest expense from debt refinancing cycles.
- Capital expenditure patterns signaling investments into technology or supply chain capacity that underpin future operational scaling.
- Progress against strategic imperatives under the “Hungry for MORE” plan emphasizing sales expansion, increased store count growth pace, profit margin improvement initiatives, and further enhancement of franchisee engagement levels [S6].
Returns and Capital Allocation Strategy
Domino’s exhibits disciplined capital deployment focused on shareholder returns combined with prudent balance sheet management:
- Operating cash flow surged by nearly +27% YoY to approximately $792 million in FY2025 due primarily to improved net income performance plus working capital efficiencies supporting free cash flow generation near $671 million after capex outlays [F1].
- Dividend payments increased steadily year-over-year aligning with earnings growth; total dividends reached approximately $237 million representing roughly a ~40 cents annual payout per share based on shares outstanding trends noted in SEC disclosures [F1,S11].
- Share repurchase programs remain active with nearly $358 million deployed during FY2025 under a Board authorized plan exceeding $1 billion total authorization available as of early ’26; repurchases reduce share count slightly supporting EPS accretion assuming stable earnings trajectory [F1,S17].
- Approximate ROE calculation appears negative (~ -15%) attributable largely to substantial negative equity balances caused by historical recapitalization financing structures typical of asset-backed securitizations rather than fundamental profitability deficits —reconciled carefully against positive net income figures demonstrating cash-generative operations rather than capital erosion [F1].
Capital expenditures are modest relative to revenue scale (~2.4%) reflecting low fixed asset intensity inherent in franchised store designs focusing more on technology upgrades rather than brick-and-mortar expansion financed differently through franchisees.
Industry Positioning & Competitive Context
Domino’s leads the U.S. pizza QSR segment with estimated shares near one-third of delivery business (32.9%) and approximately one-fifth (19.6%) of carryout volume – underscoring dominance not only by unit count but consumer spending influence—a critical metric given variable pricing environments across competitors including Little Caesars and Pizza Hut expanding digital footprint strategies [S23,S5].
Its integrated supply chain strategy enforces quality control while yielding cost advantages enabling competitive menu pricing paired with convenience-focused store formats efficiently executing high throughput volume allowing strong unit economics – fundamentals essential given labor availability challenges throughout the quick-service space.
Emerging trends around AI augmentation for order customization, voice-enabled ordering interfaces integrated into mobile apps, drone or autonomous vehicle delivery pilots represent potential longer-term disruption sparks but require significant capital investment which Domino's mitigates risk exposure through leveraging franchisee-operational ownership carrying impact downstream carefully across system partners.
Risks Overview
The company enumerates several risk factors critical for assessment:
- High indebtedness could amplify exposure to interest rate hikes or refinancing risks impacting liquidity if operating performance weakens unexpectedly.
- Reliance on independent franchisees introduces execution risk where localized failures or dissatisfaction among operators could impair royalty streams or brand reputation.
- Commodity cost swings—particularly dairy derivative price spikes—while partially hedged create earnings volatility for supply chain operations influencing consolidated results materially.
- Competitive intensity driven by aggregation platforms may compress margins through fee structures necessitating promotional escalations injurious over time if not offset by scale benefits.
- Regulatory compliance risks vary internationally encompassing labor laws governing wage floors/reporting obligations/franchise rules adding legal complexity costs potentially unforeseen litigations including employment-related suits have moderate likelihood given workforce scale.
Conclusion & Monitoring Points
Domino’s continues leveraging its dominant brand positioning backed by a time-tested franchising expertise driving solid financial results evidenced by steady revenue expansion alongside robust profits yielding substantial cash flow enabling shareholder returns through dividends plus buybacks. Nonetheless balancing acts remain imperative amidst elevated leverage levels coupled with inflationary pressures on raw materials—a sphere where technological innovation plus targeted international expansion serve as natural levers feeding momentum going forward. Keeping close track of same-store sales trends particularly internationally, commodity cost trajectories affecting supply margins plus funding costs linked to debt maturities will provide key insights into sustained corporate health throughout fiscal '26 onward horizons.
Disclaimer: This report is for informational purposes only based on publicly disclosed data as of February '26; it does not constitute investment advice or recommendations.
Disclaimer: This is research-only, informational analysis and not investment advice. It may include AI-generated interpretation and general industry context. Always verify important details using primary sources.
Comments