
DIRTT Environmental Solutions’ Strategic Push Amid Revenue Contraction and Liquidity Challenges
DIRTT leverages its proprietary ICE Software amid declining revenues and liquidity pressures while managing capital allocation and legal risks.
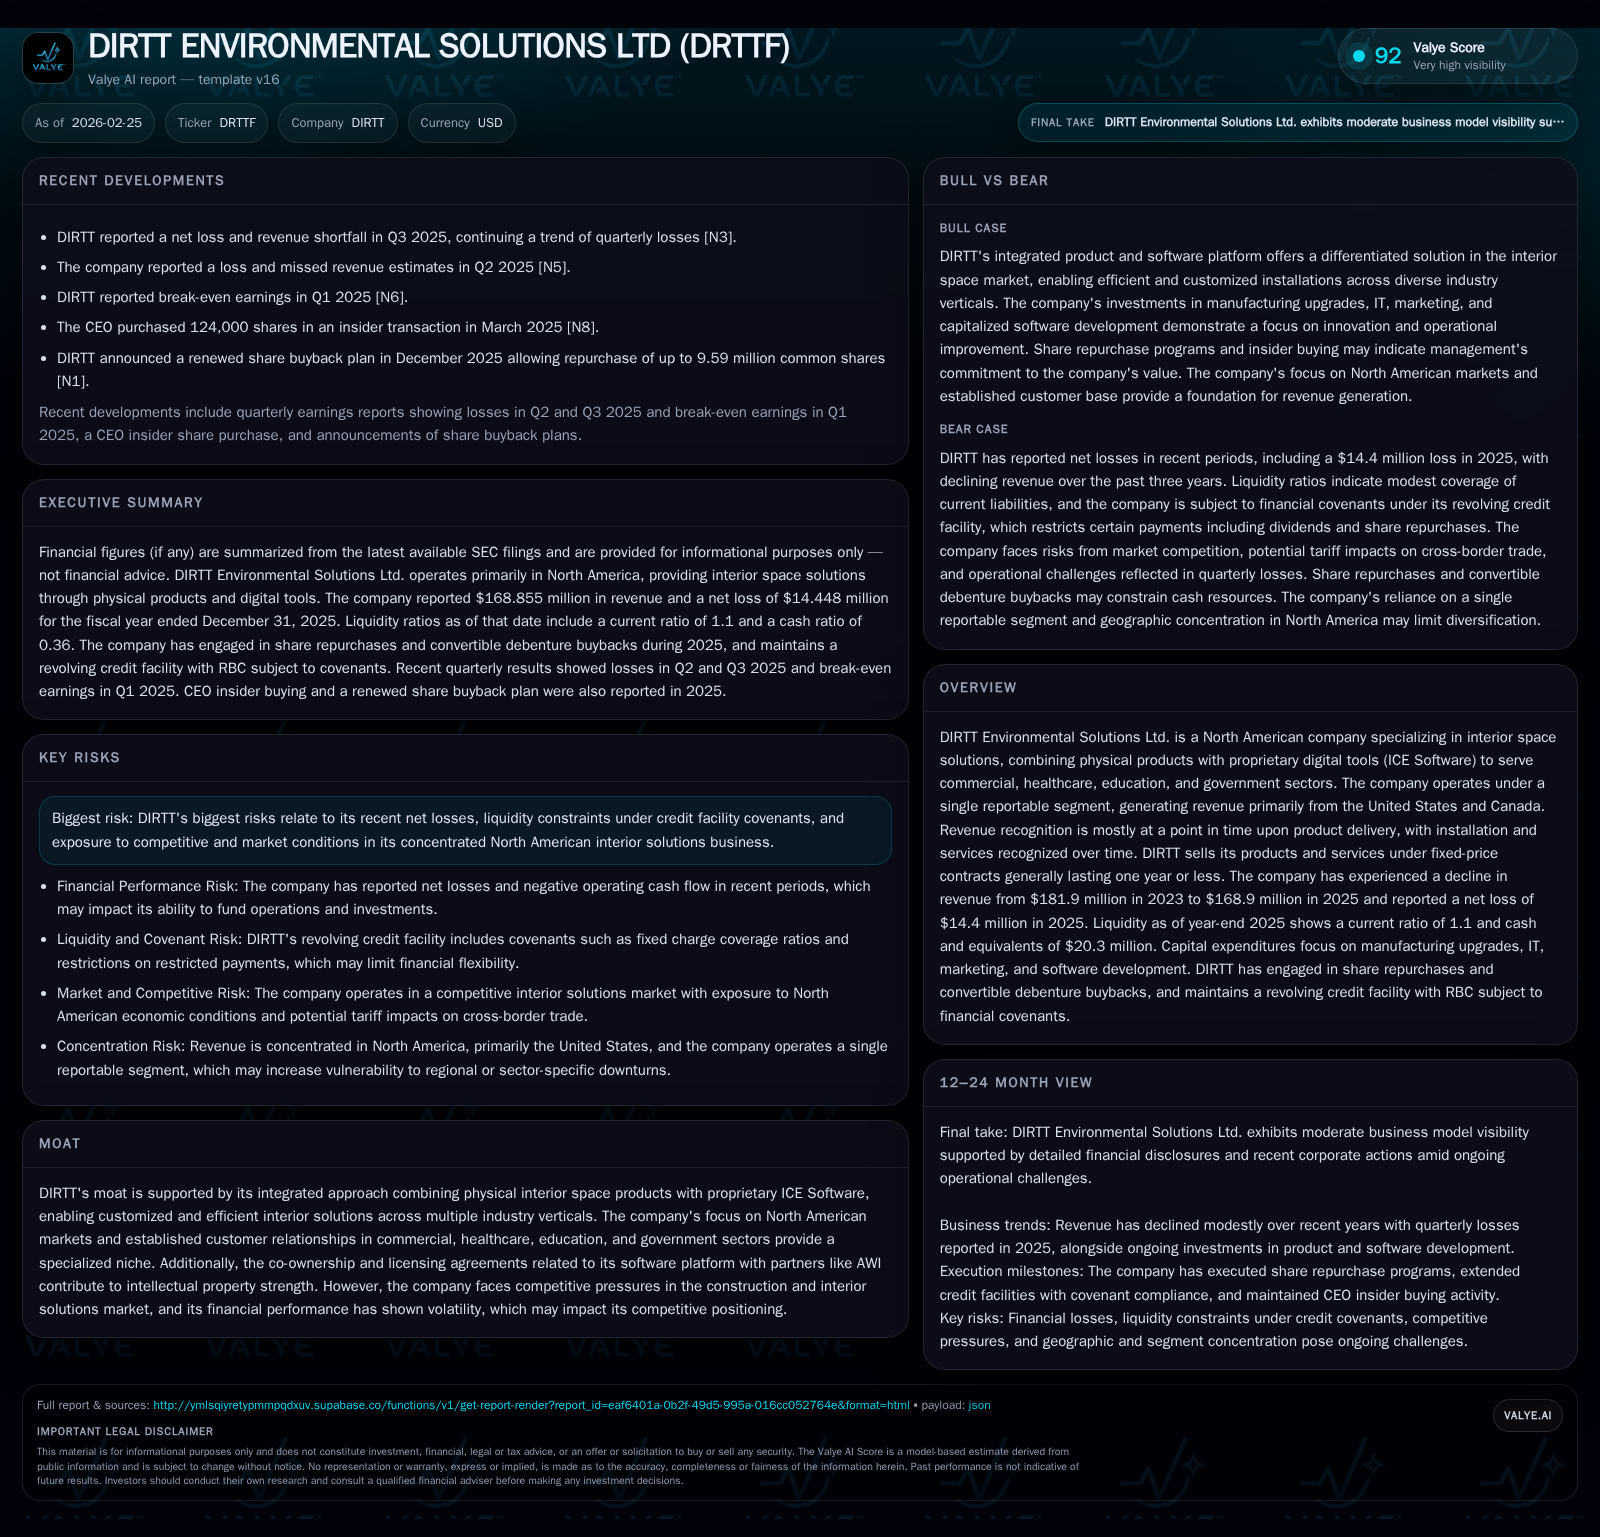
DIRTT Environmental Solutions Ltd. has experienced a revenue decline from $181.9 million in 2023 to $168.9 million in 2025 alongside operating losses and net losses, reflecting intensified competitive and sector headwinds in North American interior space solutions. The company's integrated approach, combining physical products with ICE Software, underpins its moat but faces volatility in demand across commercial and healthcare verticals. Liquidity management has been complex, with covenant constraints prompting debt refinancing and cautious capital allocation, including share repurchases despite cash flow deficits. Upcoming legal proceedings on intellectual property will be critical milestones to watch for operational stability.
Revenue Trajectory and Industry Vertical Dynamics Since 2023
DIRTT’s revenue performance over the past three years shows a decline from $181.9 million in 2023 to $168.9 million in 2025 according to fiscal year-end figures reported [F1]. By industry verticals, the commercial sector remains the largest contributor but declined from about $121.5 million in 2023 to under $98 million by end-2025 [S4]. This reflects softer demand possibly tied to reduced project backlogs or increased competition within North America’s interior solutions market.
Healthcare revenues showed volatility rising sharply from $21.2 million in 2024 to above $40 million in 2025 after prior fluctuations — indicative of episodic project wins linked to healthcare infrastructure funding cycles [S4]. Government and education verticals contributed smaller but relatively stable shares around $11–13 million each.
DIRTT primarily sells physical products under fixed-price contracts typically lasting one year or less; this introduces lumpiness in revenue recognition consistent with project timing [S4]. Contract liabilities decreased modestly to about $3.5 million at end-2025 reflecting timing shifts in orders and payments [S16].
Operating Losses during Declining Demand
After achieving operating income of $4.2 million in FY 2024 following prior losses, DIRTT reverted to an operating loss of $11.3 million in FY 2025 [F1]. This reflects margin pressures as lower volumes strained absorption of fixed manufacturing overheads during competitive pricing dynamics [S14].
Operating cash flow was near breakeven at approximately -$0.19 million for FY25 highlighting constrained financial flexibility during this period of volume softness [F1].
Legal Proceedings Impacting Operational Stability
DIRTT’s proprietary ICE Software faces ongoing litigation alleging trade secret misappropriation involving Falkbuilt Ltd., former employees, and associates adjudicated primarily under Canadian law after dismissal of U.S. claims on forum grounds [S1, S21].
An eight-week trial began February 2, 2026 before Alberta’s Court of King’s Bench addressing damages claims potentially significant to DIRTT’s IP protection strategy [S21]. The outcome will be critical for safeguarding the company’s technology moat.
Capital Structure and Liquidity Management
In early 2026, DIRTT repaid the entire outstanding balance (~$12.1M USD equivalent) of its January Debentures which matured January 31, 2026 using cash on hand [S1]. The December Debentures remain outstanding with maturity at end-2026 alongside ongoing buyback programs.
The revolving credit facility with Royal Bank of Canada (RBC) is secured primarily by accounts receivable with inventory excluded from borrowing base calculations since October 2023 . Covenants include a Fixed Charge Coverage Ratio (FCCR) threshold near 1.10:1 trailing twelve months; breaches have triggered reserve requirements and cash dominion risks mitigated by recent waivers allowing continuation of share repurchases despite FCCR shortfalls after December purchases [S8,S20].
Additionally, DIRTT entered a term loan agreement with Business Development Bank of Canada (BDC) for up to C$15 million disbursed in tranches starting May 2026 through April 2032 at floating interest rates providing liquidity runway beyond fiscal year-end [S19].
Share Repurchase Activity Despite Cash Flow Constraints
Despite negative free cash flow exceeding $1.7 million (operating cash flow minus capex), DIRTT repurchased approximately CAD $6.2 million worth of common shares (about 5.7 million shares) during FY25 through normal course issuer bids and a private transaction reducing shares outstanding to roughly 190 million post-transaction [N1,F1,S8,S1].
This capital return amidst liquidity pressure suggests management views equity as undervalued or aims to signal confidence while balancing financial flexibility.
Capital Expenditure Focused on Operational Efficiency
Capital expenditures totaled approximately $1.58 million in FY25 — a modest increase — directed mainly towards manufacturing system upgrades ($0.5M), IT enhancements ($0.4M), marketing initiatives ($0.5M), and leasehold improvements ($0.2M) aimed at sustaining production capabilities within tight budgets [F1,S27]. Capitalized software investments supporting ICE Software development remained steady around $1.7 million.
Growth Outlook Centered on Core Verticals and Digital Integration
DIRTT continues emphasizing commercial workspace interiors alongside healthcare delivery sites leveraging its integrated physical-digital solution via ICE Software which enables cost-time certainty under fixed-price contracts [N1,S4,S21].
Risks include tariff impacts on Canadian exports into the U.S., where majority revenue originates (~$149M vs ~$19M Canadian revenues), requiring active monitoring due to potential cost competitiveness effects [S21,S7]. The specialized model creates differentiation but also imposes scalability challenges amid competitive pressures.
Upcoming Milestones To Watch
Important near-term events include:
- Conclusion of Alberta Court trial on IP claims by March 27, 2026 shaping protection of proprietary technology;
- Maturity of December Debentures at year-end requiring refinancing or redemption decisions;
- Continued execution under renewed Shares NCIB through December 2026 reflecting capital return commitment;
- Quarterly financial reports expected mid-2026 providing insight into stabilization of revenue trends or margin improvements post restructuring efforts [N1,S3,S1].
Maintaining current ratio near 1.1 indicates balanced short-term liquidity though covenant compliance remains vital amid debt obligations and external financing dependencies.
Historical Financial Performance Summary
Historical performance (annual)
| FY | Rev ($mm) | Net ($mm) | CFO ($mm) | OpInc ($mm) | Rev YoY | Net YoY |
|---|---|---|---|---|---|---|
| 2025 | 169 | -14 | 0 | -11 | -3.1% | -197.8% |
| 2024 | 174 | 15 | 7 | 4 | -4.2% | +201.3% |
| 2023 | 182 | -15 | 15 | -17 | +5.7% | +73.5% |
| 2022 | 172 | -55 | -44 | -59 |
Source: SEC companyfacts cache [F1].
Note: Some line items are omitted where multi-year comparability is limited in the structured SEC XBRL dataset; trend columns are shown only when comparable history exists.
Capital returns and efficiency (annual)
| FY | FCF ($mm) | ROE% |
|---|---|---|
| 2025 | -2 | -50.6 |
| 2024 | 6 | 34.7 |
| 2023 | 14 | -205.4 |
| 2022 | -47 | -305.5 |
Source: SEC companyfacts cache [F1]. Note: Figures are millions USD; YoY changes sequential per available data from FYE.
Disclaimer: This analysis is based solely on disclosed data as of February 25, 2026 without any investment advice or projections beyond official filings.
Disclaimer: This is research-only, informational analysis and not investment advice. It may include AI-generated interpretation and general industry context. Always verify important details using primary sources.
Comments