
DriveItAway Holdings Accelerates Market Footprint While Grappling with Profitability Headwinds
DriveItAway’s rapid U.S. market expansion via strategic partnerships contrasts with persistent financial losses and liquidity challenges.
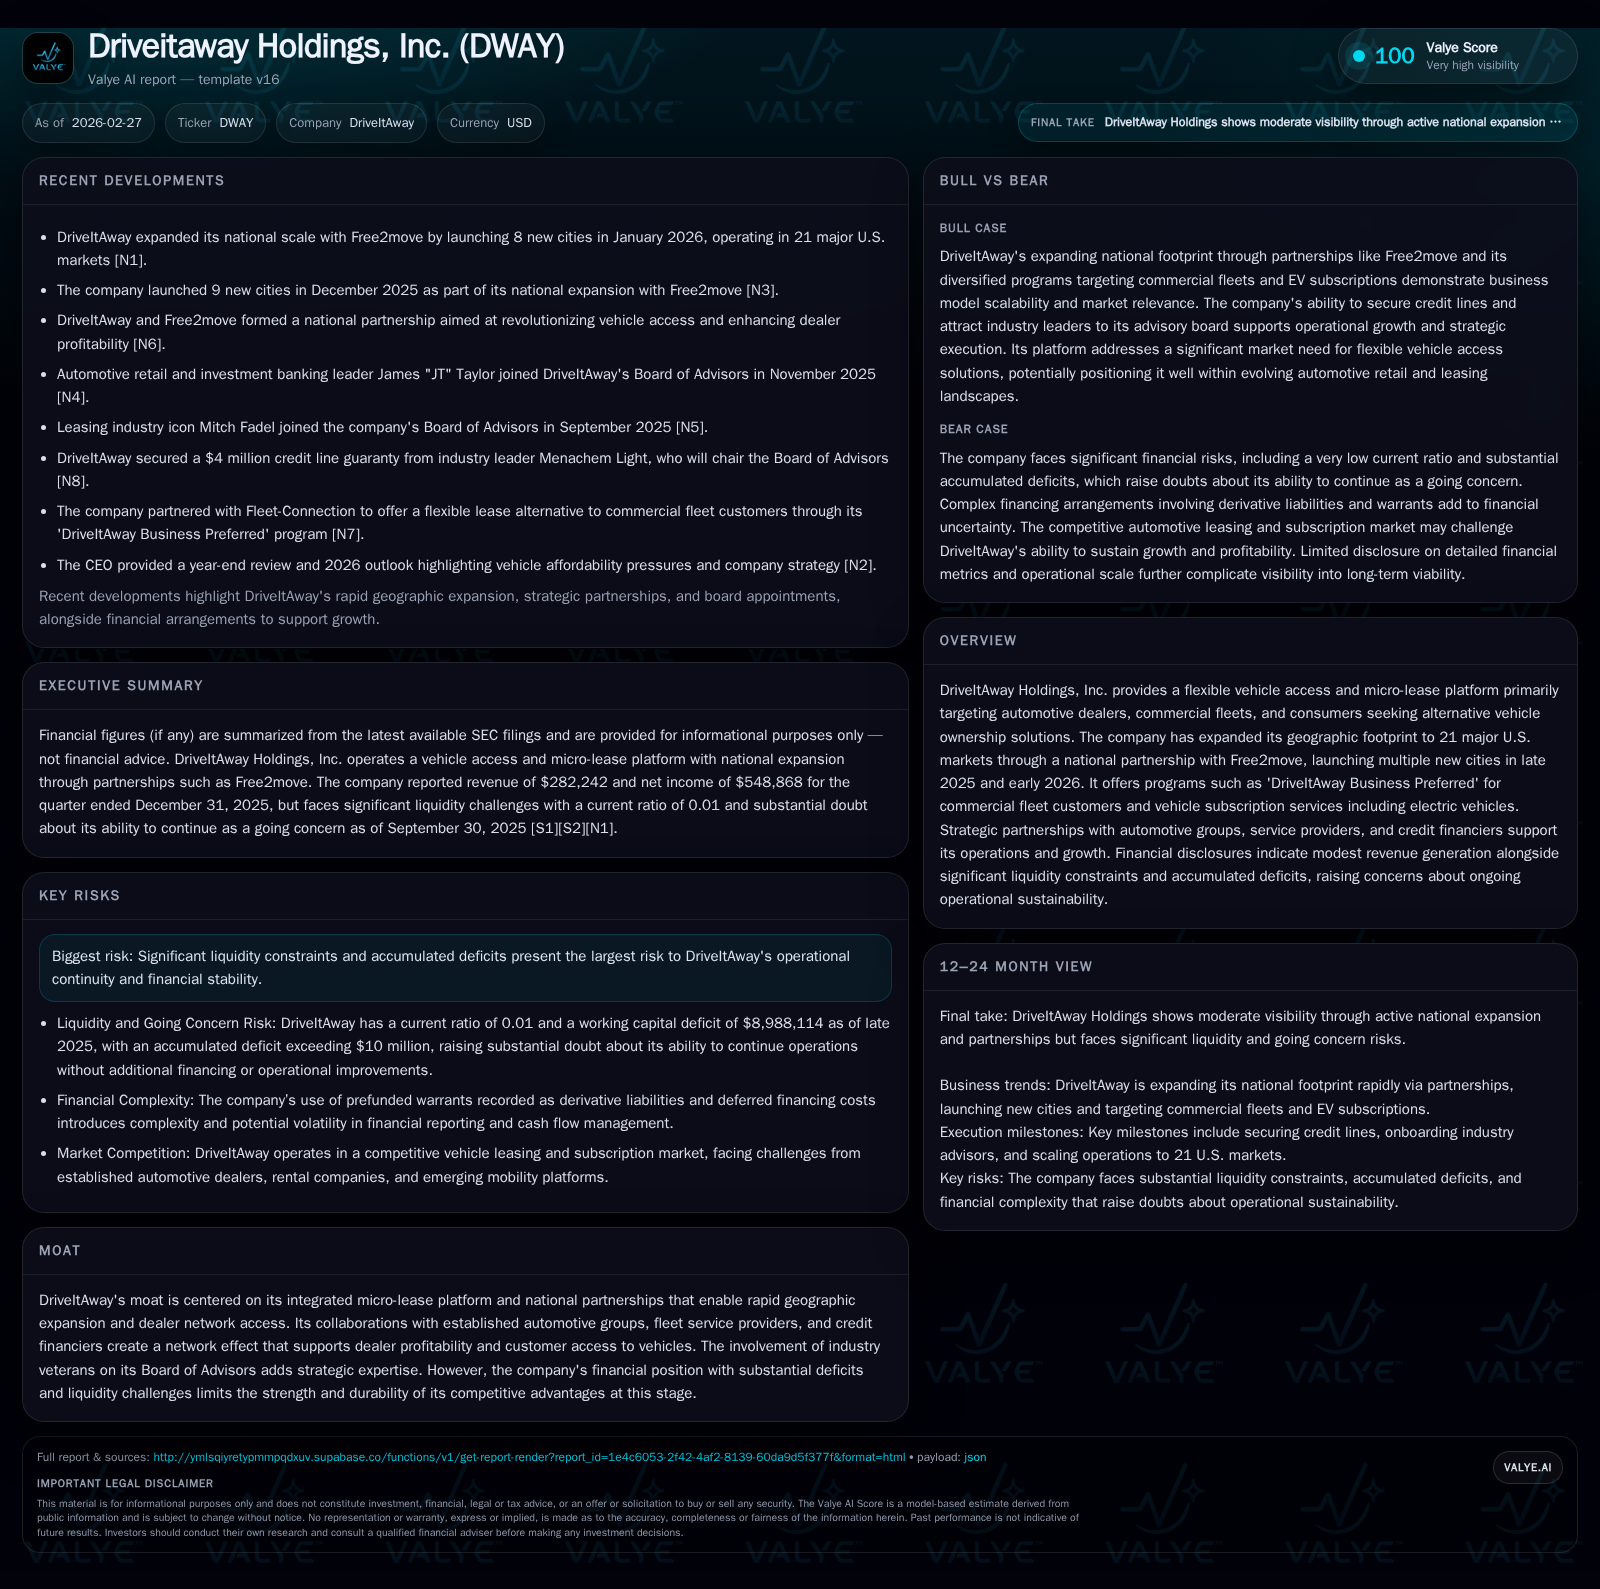
DriveItAway Holdings has more than doubled its revenue from FY2024 to FY2025, driven by aggressive geographic expansion powered by its partnership with Free2move. Despite top-line growth, the company continues to face significant operating losses and a growing accumulated deficit, coupled with severe liquidity constraints highlighted by a nearly non-existent current ratio. Its innovative micro-lease platform targeting automotive dealers and fleet customers provides a competitive moat, but operational scale-up costs and complex debt financing structures weigh on profitability and cash flow. Watch for upcoming milestones on further market launches and evolving capital arrangements as critical indicators of its sustainability trajectory.
From Modest Inception to Doubling Revenue: Tracking DriveItAway’s Growth Trajectory
DriveItAway Holdings has demonstrated a notable top-line acceleration over the past four fiscal years. Revenue increased from just $55,509 in FY2022 to $460,991 in FY2024, and then more than doubled to $987,937 in FY2025—an impressive 114.3% year-over-year increase in the last reported fiscal year [F1]. This surge correlates strongly with expanded operational footprint and customer engagement.
However, despite this revenue momentum, operating income remains substantially negative, though improving. The operating loss narrowed from -$1,185,156 in FY2022 to -$868,503 in FY2025, representing a 52.9% improvement but still reflecting persistent cash burn associated with scaling activities [F1]. Net income figures follow a similar pattern: while losses moderated from -$1,475,365 in FY2022 to approximately -$930,137 (latest available figure from FY2023), sustained negative net results highlight challenges in quickly monetizing growth [F1].
Operating cash flow trends reveal ongoing liquidity consumption, with CFO at approximately -$477,743 in FY2025 paralleling the negative earnings trend [F1]. Capital expenditures have fluctuated historically but spiked significantly in prior years (notably +4903% YoY comparing earlier periods), indicative of investments in platform infrastructure or fleet assets [F1].
Historical performance (annual)
| FY | Rev ($) | Net ($) | CFO ($) | OpInc ($) | Rev YoY | Net YoY |
|---|---|---|---|---|---|---|
| 2025 | 987937 | -477743 | -868503 | +114.3% | ||
| 2024 | 460991 | -424379 | -568155 | +50.0% | ||
| 2023 | 307284 | -930137 | -445105 | -762455 | +453.6% | +37.0% |
| 2022 | 55509 | -1475365 | -827611 | -1185156 | -554.1% |
Source: SEC companyfacts cache [F1].
Capital returns and efficiency (annual)
| FY | ROE% |
|---|---|
| 2025 | |
| 2024 | |
| 2023 | 47.6 |
| 2022 | 134.2 |
Source: SEC companyfacts cache [F1].
This table summarizes key operating metrics reflecting growth coupled with continuing losses and cash outflows.
Micro-Lease Innovation and Expansion into 21 U.S. Markets: Key Growth Drivers
DriveItAway’s core value proposition is built around a flexible vehicle access micro-lease platform addressing demands from automotive dealers seeking inventory turn optimization and commercial fleets requiring scalable vehicle access without full ownership burdens [N1]. This micro-lease model enables "fleet access optimization" by tapping transient vehicle needs via short-duration leases integrated through an automated subscription management system—a hallmark of platform scalability in automotive finance sectors.
Critical to recent growth is DriveItAway's national partnership with Free2move that catalyzed rapid geographic expansion into 21 major metropolitan statistical areas across the U.S., including eight new city launches in January 2026 alone [N1]. This widened footprint enhances dealer network synergy effects and broadens the end-customer reach encompassing commercial fleet clients such as service providers through programs like 'DriveItAway Business Preferred' .
The company's ability to integrate electric vehicles within subscription offerings also signals responsiveness to evolving fleet electrification trends—a focal point for contemporary fleet operators balancing sustainability goals with cost efficiency.
Profitability Barriers: Understanding Operating Losses and Net Income Trends
Despite top-line gains evidencing successful market penetration, DriveItAway continues grappling with unprofitable operations as reflected in sustained negative EBITDA-equivalent outcomes [F1],[S1]. The narrowing operating losses indicate incremental operational leverage but underline substantial fixed cost absorption associated with scaling micro-lease infrastructure—technology platform development costs, dealer onboarding expenses, and fleet asset management overhead.
As of FY2025 closing September 30th, the company posted an accumulated deficit nearing $10.5 million alongside a negative equity position of approximately -$8.5 million—demonstrating historical cumulative net losses offsetting any retained earnings build-up [F1],[S1]. This sizeable deficit reflects aggressive early-stage investment expenditure that has yet to translate into positive returns or operational self-sufficiency.
An approximate return on equity (ROE) figure derived from latest net income versus equity stands near +10.9%, which superficially appears positive but must be interpreted cautiously given the negative equity base causing distortions typical of companies in steep turnaround phases [F1].
Credit Structure and Derivative Liabilities: Navigating Capital Constraints
The company's capital structure embodies complexity notably arising from pre-funded warrants issued concurrently with credit facilities that are accounted for as derivative liabilities under ASC accounting guidelines [S9],[S10]. These warrants provide investors rights to purchase shares at nominal prices without expiration dates but introduce valuation volatility marked by significant fair value remeasurements impacting reported losses.
Management utilizes an accounting exception allowing deferred financing costs related to these warrants to be treated as assets amortized over the life of related notes—a treatment justified by viewing such warrants as access fees equivalent rather than traditional debt issuance premium [S9]. However, this arrangement imposes higher reported financing expense volatility and complicates transparent assessment of underlying capital costs.
Such derivative liabilities create ongoing challenges for working capital management given unpredictable earnings impacts stemming from mark-to-market adjustments exacerbated by illiquid trading conditions for the small-cap security involved.
Balance Sheet Tightrope: Liquidity Deficits and Going Concern Risks
DriveItAway’s balance sheet underscores material financial distress indicators that have warranted auditor-sanctioned substantial doubt regarding its ability to continue as a going concern [S12],[F1]. The latest current assets total just over $106K against current liabilities exceeding $8 million as of December 31st, 2025—resulting in an alarmingly low current ratio near 0.01 indicative of severe short-term liquidity constraints [F1].
Working capital deficits approaching $9 million highlight acute challenges funding ongoing operations without immediate external capital infusion or operational cash flow turnaround.
Given these conditions combined with accumulated losses surpassing shareholder equity contributions by millions of dollars underscores existential risks without imminent refinancing activity or monetization milestones.
Board Expertise and Strategic Partnerships: Moat Potential Amidst Deficits
Despite financial headwinds DriveItAway’s strategic positioning benefits from an integrated platform model fostering meaningful "dealer network synergy" that incentivizes partner retention through shared economics on micro-leases and subscriptions . Its collaboration with established automotive groups expands distribution channels enhancing customer acquisition efficiency relative to pure tech entrants lacking direct fleet relationships.
Furthermore, involvement of seasoned industry veterans on its Board of Advisors lends valuable domain insight aiding product refinement aligned with commercial fleet customer retention dynamics—an intangible asset contributing defensibility despite constrained resources.
Such network-effects underpinning platform integration benefits remain critical competitive moats supporting future scalability post remediation of capital structure vulnerabilities.
Capital Allocation Overview: Absence of Dividends, Buybacks, and Cash Flow Trends
Reflecting early-phase growth strategy paired with financial instability DriveItAway maintains no dividend distributions nor share repurchase programs with the last recorded buyback activity dating back multiple years ago (FY2016) well before intensified expansion efforts commenced [F1],[S11],[S13].
Operating cash flow remains negative reflecting continued elevated expenses necessary for expanding service footprint and enhancing subscription software capabilities amidst lackluster revenue-to-cost scale efficiencies [F1]. Capital expenditures fluctuate but have risen sharply at points indicating active reinvestment prioritization over capital returns.
This negative free cash flow trajectory implies focus on conservation of liquidity while awaiting break-even inflection points highlighting prudent capital preservation under existing financial constraints.
Future Tipping Points: What to Watch in Upcoming Quarters and Operational Milestones
Looking ahead several key indicators should be monitored closely: whether DriveItAway sustains geographic expansion velocity beyond initial Free2move-enabled rollout cities will determine if "subscription platform scalability" can broaden sufficiently to improve unit economics [N1],[S2].
Additionally any publicized debt refinancing arrangements or equity raises would alleviate near-term going concern risks born from working capital deficits providing runway for continued investment critical amidst thin liquidity runway [S2].
Incremental improvements in operating leverage evidenced through margin progression or reduced derivative liability volatility might mark embryonic profitability trajectories transforming loss-making profile toward sustainable self-funded growth scenarios necessary for valuation stability.[/analysis]
This analysis is intended solely as an informational memorandum synthesizing publicly available data without expressing investment advice.
Disclaimer: This is research-only, informational analysis and not investment advice. It may include AI-generated interpretation and general industry context. Always verify important details using primary sources.

Comments