
EastGroup Properties: Industrial REIT Execution in Supply-Constrained, High-Growth Markets
With strong leasing performance, a disciplined development pipeline, and inflation-resistant lease structures, EastGroup Properties stands out among industrial REITs. The company’s focus on supply-constrained submarkets and tenant expense pass-throughs supports stable cash flows, but recent FFO underperformance and capital market pressures highlight execution risks and the need for ongoing vigilance.
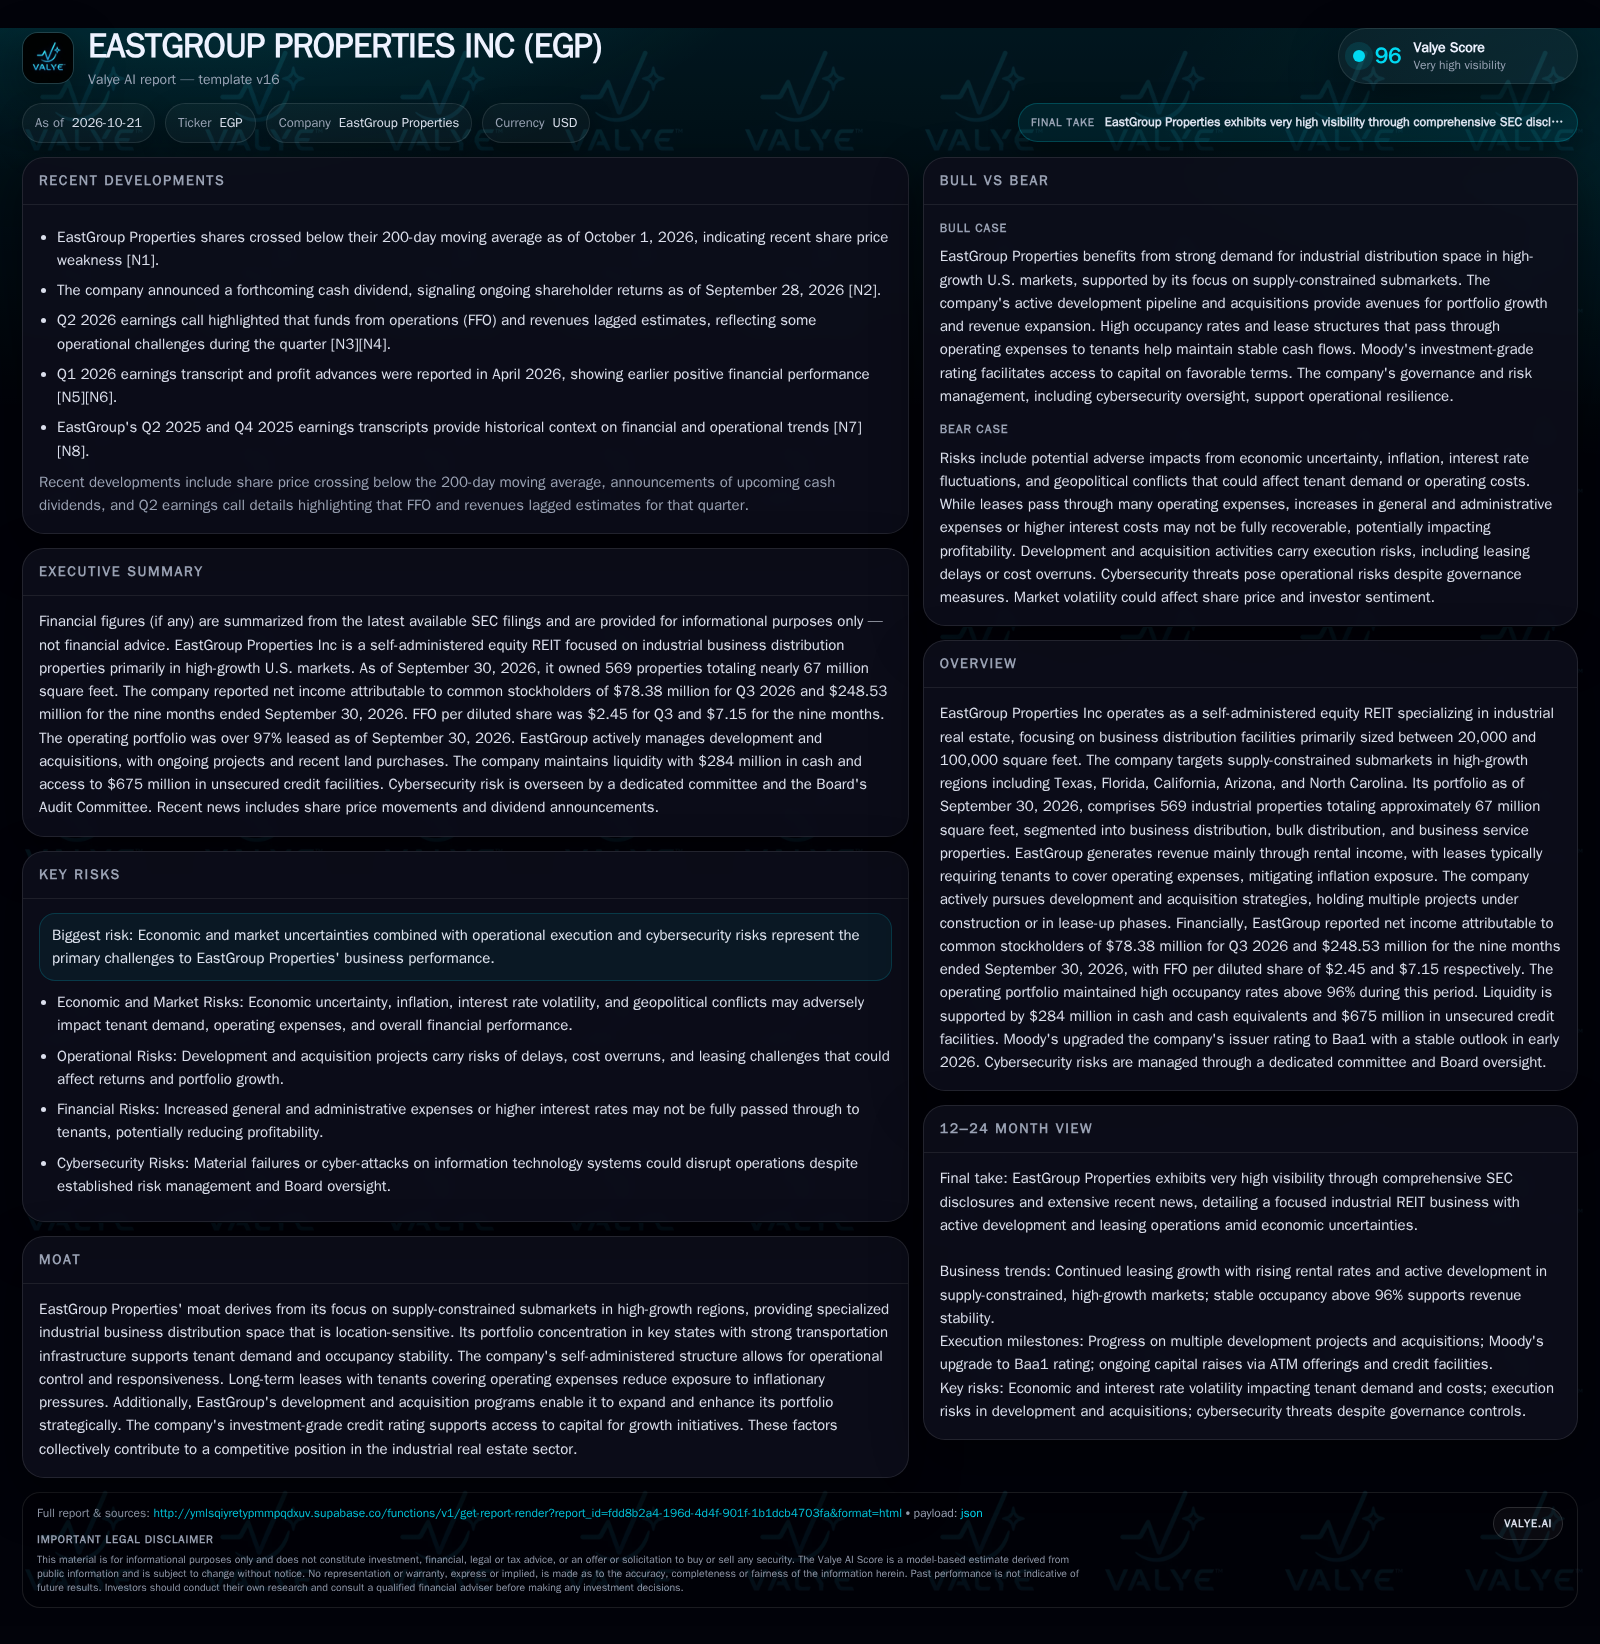
EastGroup Properties is a pure-play industrial REIT operating nearly 67 million square feet in high-growth, supply-constrained U.S. markets. The company reported a 35.6% average increase in rental rates on new and renewal leases during the first nine months of 2026, with occupancy above 96% and a robust development pipeline. While Moody’s upgraded EGP’s credit rating to Baa1, recent quarters saw FFO and revenue lag estimates, and the share price dipped below its 200-day moving average, reflecting both execution challenges and market caution. The company’s inflation-mitigating lease structures and access to capital remain strengths, but development, interest rate, and demand risks persist. [S2] [N1] [N3] [N4]
EastGroup Properties (EGP) has carved out a distinctive niche as a focused industrial REIT, specializing in business distribution facilities in fast-growing, supply-constrained U.S. markets. The company’s high occupancy, rising rental rates, and inflation-mitigating lease structures have delivered resilient performance. However, recent underperformance versus FFO and revenue estimates, combined with share price weakness, underscores the importance of execution and the risks inherent in development-heavy REIT models. As EGP continues to expand its portfolio and navigate capital markets, its ability to sustain growth, manage costs, and maintain tenant demand will be pivotal.
Recent Leasing Momentum and Market Signals Shape the Outlook
EastGroup Properties ended Q3 2026 with 569 owned industrial properties totaling approximately 67 million square feet, primarily clustered in Texas, Florida, California, Arizona, and North Carolina. During the first nine months of 2026, the company executed new and renewal leases on 7.8 million square feet—12.3% of the portfolio—with average rental rates up 35.6% compared to expiring leases. Occupancy remained robust at 97.3% leased and 96.5% occupied as of September 30, 2026, though there was a slight dip by October. These metrics reflect strong tenant demand and pricing power in EGP’s target submarkets. [S2]
Financially, net income attributable to common stockholders was $78.38 million for Q3 2026 and $248.53 million for the first nine months, while FFO per diluted share was $2.45 for the quarter and $7.15 year-to-date. Property net operating income (PNOI) rose 10.1% year-over-year in Q3, with same-property PNOI up 5.3%. Despite these positive trends, EGP’s Q2 FFO and revenues lagged analyst estimates, and its share price crossed below the 200-day moving average in October—suggesting market caution and possible investor concerns around growth consistency or cost pressures. [S2] [N1] [N3] [N4]
The company reported cash and liquidity metrics for the period; these figures do not by themselves establish operating runway, investment capacity, financial flexibility, or financing capacity. Moody’s upgraded EGP’s issuer rating to Baa1 with a stable outlook in February 2026, affirming its investment-grade status and access to competitive funding. [S2]
How EGP’s Lease Structures and Development Pipeline Drive Earnings
EastGroup’s core economics are anchored in rental income from industrial properties, with tenants typically paying their pro rata share of operating expenses. This lease structure substantially reduces EGP’s direct exposure to inflation in property-level expenses, allowing the REIT to preserve margins even as costs rise—a key differentiator versus traditional office or retail landlords.
Revenue growth is driven by a combination of rental rate escalations, high occupancy, and ongoing development/acquisition activity. The company’s recent 35.6% average rent increase on new and renewal leases highlights the pricing power available in supply-constrained, high-growth markets, though such increases may moderate if economic or market conditions soften.
Operating leverage is present but measured: While property-level expenses are largely passed through, general and administrative costs and interest expense are not, creating a potential drag if these rise faster than revenue. Capital needs are significant—ongoing development projects totaled $636.7 million in projected investment as of September 30, 2026, with $251 million yet to be deployed. The company funds growth through a mix of retained cash flow, unsecured credit, and periodic equity issuance (e.g., $69.3 million raised via ATM shares in 2026), balancing dilution risk and cost of capital. [S2]
The risk profile is typical for industrial REITs with active development: upfront capital deployment is followed by a lease-up period before stabilized income is achieved. Delays, cost overruns, or weaker-than-expected tenant demand can negatively impact returns.
Location, Scale, and Tenant Mix Define Competitive Edge
EGP’s principal competitive advantage stems from its focus on supply-constrained, high-growth submarkets—locations where zoning, land scarcity, and robust tenant demand limit new competitive supply. The company’s clustering strategy around major transportation infrastructure (e.g., highways, airports, ports) increases its appeal to logistics, e-commerce, and regional distribution tenants seeking last-mile capabilities.
Relative to peers, EGP’s scale (nearly 67 million square feet), high portfolio occupancy, and disciplined development pipeline bolster its standing. The self-administered structure supports operational agility, and the investment-grade rating enhances access to debt capital at favorable rates.
However, the industrial REIT landscape remains competitive, with other public and private REITs, institutional investors, and logistics real estate platforms targeting similar markets. Substitutes—such as automation, micro-fulfillment centers, or alternative logistics solutions—could gradually alter demand patterns, particularly if e-commerce growth slows or supply chains reconfigure. Additionally, rising interest rates and construction costs may compress spreads on future developments, eroding the relative advantage of incumbents unless offset by continued tenant demand and rent growth.
Sustained Rent Growth and Development Execution Unlock Value
In a favorable scenario, EGP continues to capitalize on robust tenant demand in its core markets, driving above-market rental rate growth and maintaining occupancy at or above current levels. The successful delivery, lease-up, and stabilization of its $636 million development pipeline would provide incremental NOI and FFO growth, while disciplined capital allocation limits dilution and interest expense.
This scenario would be confirmed by continued double-digit increases in rental rates on newly signed leases, minimal vacancy on new developments, and tangible growth in FFO per share. Further upgrades in credit ratings or a return to FFO and revenue outperformance versus consensus would also support the upside case. Ongoing share price recovery and premium-to-NAV valuations would signal investor confidence in the durability of EGP’s model.
This path assumes that industrial demand drivers—such as e-commerce, reshoring, and supply chain resiliency—remain strong, and that new supply remains constrained in EGP’s targeted submarkets.
Growth Moderates as Leasing and Development Normalize
The most plausible near-term outcome is a moderation from recent peak rental rate increases and leasing velocity, as industrial market fundamentals remain sound but face incremental pressure from macroeconomic uncertainty and rising capital costs. EGP continues to complete and lease new developments, but rental spreads compress from current highs and occupancy drifts modestly lower.
FFO and PNOI growth continue, but at a slower pace, reflecting a more balanced supply-demand environment. The company taps its credit facilities and selectively issues equity to fund development, maintaining its investment-grade credit profile.
This scenario would be validated by single-digit annual increases in rental rates, stable or slightly declining occupancy, and FFO per share growth in line with sector averages. Any further lag in FFO or revenue versus consensus—without a sharp drop-off—would be consistent with this moderate-growth base case.
Development Risks and Market Softness Pressure Returns
An adverse scenario could materialize if economic or sector-specific headwinds reduce tenant demand, leading to higher vacancies and lower rental spreads. Delays or cost overruns in the development pipeline could further dampen returns, especially if new supply comes online into a weakening market. Rising interest rates, if not offset by rent growth, would compress spreads and reduce the attractiveness of incremental investment.
This scenario would be confirmed by a material drop in occupancy (e.g., below 94%), flat or negative rental rate change on renewals, and FFO per share contraction. Evidence of development lease-up delays, asset write-downs, or a downgrade in credit rating would further validate the downside risk. A sustained share price discount to NAV and persistent underperformance versus peers would signal investor concern about the durability of EGP’s growth model.
In this environment, EGP’s pass-through lease structure offers only partial protection, as general and administrative or financing costs could rise faster than revenues, and tenant defaults or bankruptcies could increase.
Factors That Will Test EastGroup’s Growth and Resilience Thesis
Pace of rental rate increases on new and renewal leases—continued 30%+ spreads would support the bullish case; a sharp slowdown would challenge it.
Occupancy trends across the portfolio, particularly in newly developed or acquired properties—if disclosed, watch for any uptick in vacancy rates.
Lease-up velocity and stabilization timelines for projects in the $636 million development pipeline—a useful metric would be lease signing within six months of project completion.
Change in general and administrative and interest expenses relative to revenue growth—margin compression could signal underlying cost pressures.
Utilization of credit facilities and incremental equity issuance—material increases could indicate funding strain or dilution risk.
Credit rating actions by agencies like Moody’s—any downgrade would be a clear warning sign.
Same-property net operating income growth, excluding lease termination income—ongoing high-single-digit growth would sustain the bull case.
Share price performance relative to NAV and sector peers—persistent discounts could reflect market skepticism about growth or risk.
Disclaimer: This is research-only, informational analysis and not investment advice. It may include AI-generated interpretation and general industry context. Always verify important details using primary sources.

Comments