
Elmet Group’s 2026 Q1 Reveals Operating Challenges Beyond IPO Launch
Elmet Group's initial quarterly results post-IPO show modest operating profit amid net losses and highlight structural uncertainties affecting early public market performance.
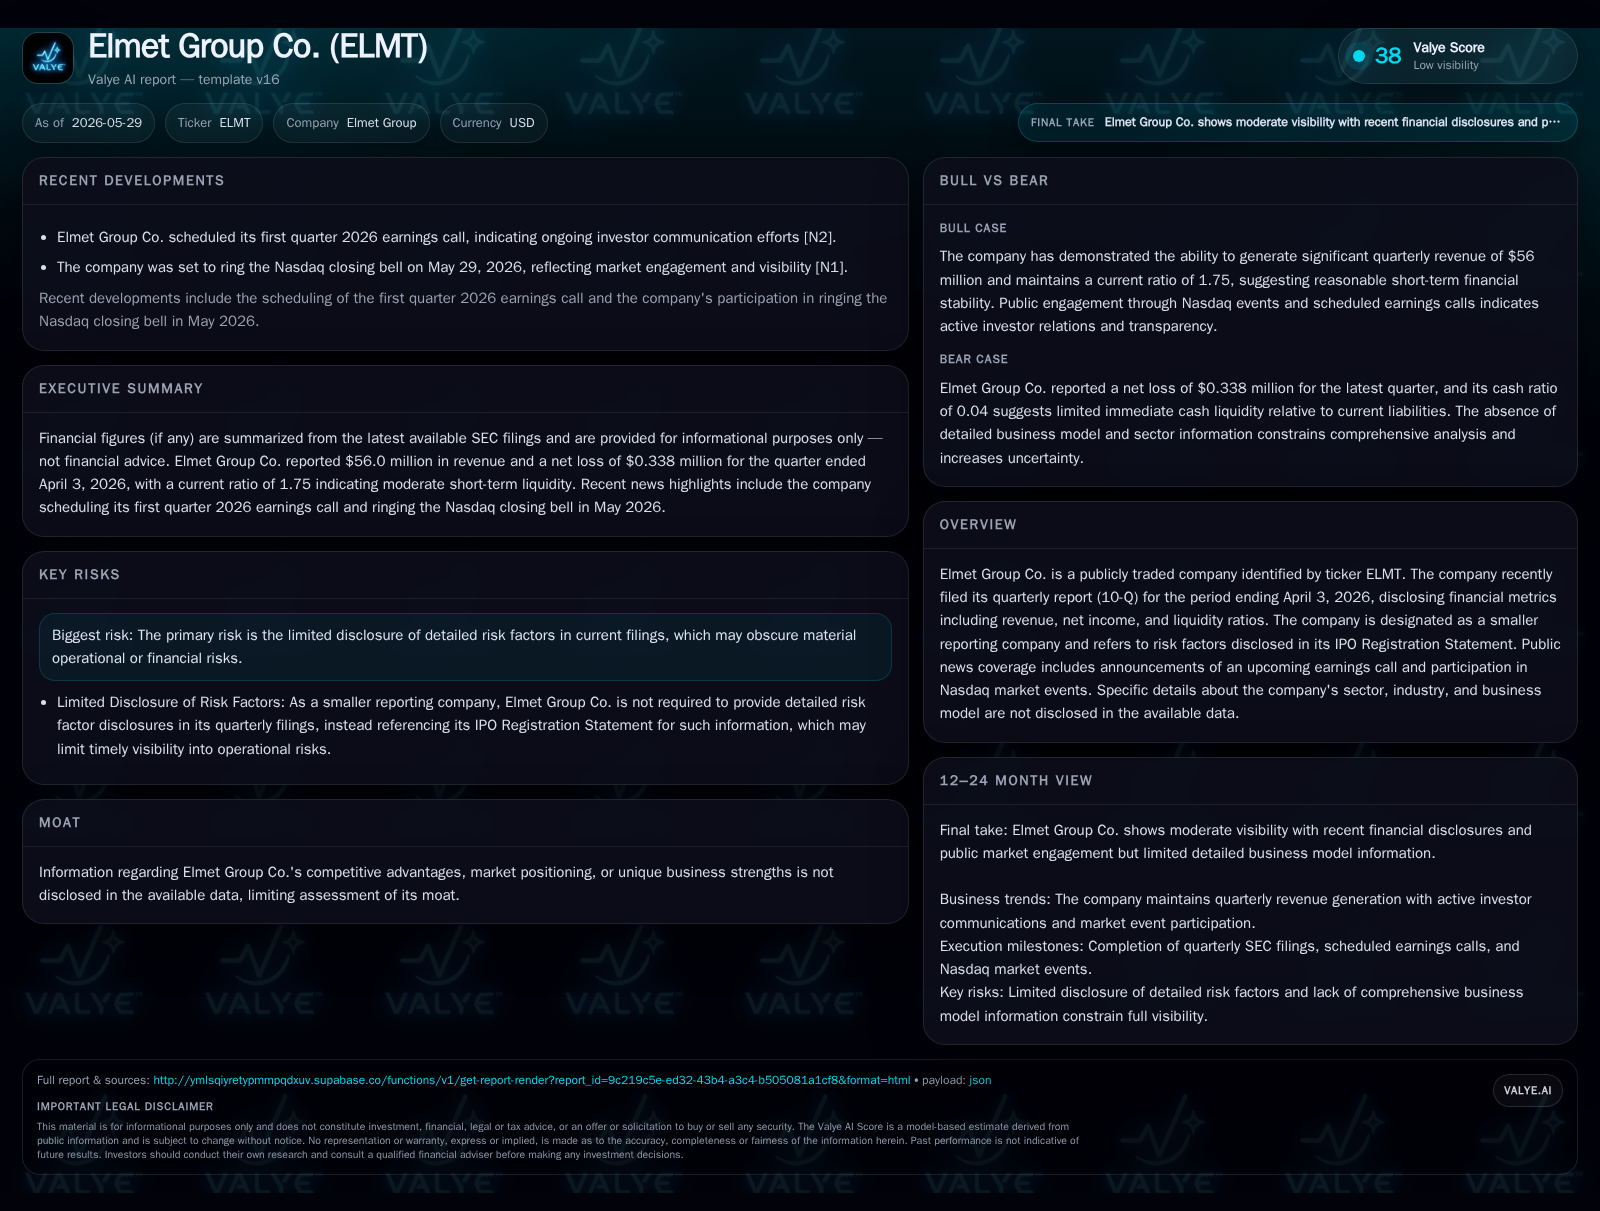
Elmet Group Co.’s first quarterly 10-Q filing since its April 2026 IPO discloses revenue of $56 million with an operating income of $1.86 million but a net loss of $338,000, reflecting margin pressures. The company’s shift to a 4-4-5 fiscal calendar complicates comparability with prior periods. Limited disclosure on business specifics and risk factors stresses uncertainty around its strategic positioning. Upcoming earnings calls and Nasdaq market participation signal efforts to build investor awareness amid early-stage operational execution risks.
Operating Update: First Quarterly Report Post-IPO
The Elmet Group Co. filed its first quarterly report (Form 10-Q) on May 29, 2026, marking the company’s debut operating snapshot following its April 2026 IPO [S2]. The quarter ended April 3, 2026, brought in revenues of $56.0 million, generating a positive operating income of approximately $1.86 million but ultimately recording a net loss of $338,000 [F1]. This juxtaposition signals that while core operations edged into profitability, non-operating expenses or financial costs exerted pressure on bottom-line results.
Complicating direct year-over-year comparisons is Elmet’s recent shift to a 4-4-5 fiscal calendar approved in May 2026 [S10]. This change alters quarter length dynamics by grouping weeks differently across months, potentially inflating or deflating reported period activity relative to traditional calendar quarters. Such accounting adjustments reflect an effort to better align reporting cadence with investor expectations but also introduce transient noise into early financial interpretations.
Alongside this filing, Elmet announced scheduled investor communications including a first quarter earnings call [N1] and participation in Nasdaq’s closing bell ceremony on May 29, highlighting management’s focus on transparent engagement during its nascent public phase [N2][S3].
Business Model and Value Proposition Amid Limited Disclosures
Elmet Group Co. provides minimal detail in public filings about its precise industry vertical or product/services suite beyond references within its IPO Registration Statement [S11]. This opacity limits rigorous reconstruction of its revenue-generation mechanics. Generally speaking, revenues likely stem from customers paying for goods or services under possibly recurring or contract-based arrangements driving volume and pricing leverage.
Available data suggest normal smaller reporting company constraints on disclosure depth regarding customer concentration, pricing power, or margin drivers [S14]. The juxtaposition of operating profitability against net losses coupled with notable leverage suggests Elmet operates under significant fixed-cost loads or financial obligations impacting net income.
This opaque profile accentuates challenges investors face in assessing durable competitive advantages or product differentiation. Without clear ecosystem integration or switching cost indicators disclosed, the value proposition appears broadly contingent on scaling operational efficiency and managing financial structure effectively.
Competitive Environment and Industry Considerations
Though exact peer competitors are undisclosed, Elmet functions within the typical dynamics confronting smaller public companies newly listed on Nasdaq: navigating heightened transparency regimes while establishing scalable operational footprints.
Industry-wise, such companies generally encounter challenges including capacity constraints linked to resource allocation; evolving regulatory landscapes shaping compliance costs; and the critical need to retain customers amid competitive pricing pressures. Switching costs tend to be a key differentiator but without explicit data for Elmet, evaluation hinges on general structural considerations common in thinly detailed sectors.
Given Elmet’s substantial leverage position reflected by total debt exceeding $50 million against limited cash resources [F1], competitors with stronger balance sheets may out-hustle in investment or pricing flexibility, making Elmet’s path to sustainable edge more dependent on operational execution.
Drivers Supporting Potential Growth Trajectory
Growth at this stage for Elmet appears tethered primarily to revenue volume expansion—whether through winning new contracts or increasing sales—and optimization of pricing mechanisms. The newly adopted fiscal calendar that aligns periods into cleaner thirteen-week blocks aims to improve comparability and investor clarity [S10], potentially supporting more consistent assessment of growth progress.
Investor engagement efforts such as the Nasdaq closing bell event [N2] serve to elevate market profile and potentially attract fresh capital interest essential for funding expansion initiatives. The forthcoming earnings calls [N1] represent key milestones for updating markets on operational traction or strategic developments.
Though concrete backlog or bookings metrics remain undisclosed, these public forums offer platforms for signaling renewed momentum or articulating blueprints toward profitability inflection points vital for confidence building.
Risks and Operational Constraints to Monitor
The conspicuous absence of detailed risk factor updates outside reference back to the IPO registration statement [S2] highlights a persistent transparency gap that can mask emerging operational or financial vulnerabilities.
Financially, Elmet operates under material leverage pressure with nearly $50 million net debt presence alongside modest cash reserves [$1.8 million] at April quarter end [F1]. This capital structure elevates refinancing and liquidity risks particularly if earnings do not suffice to service debt obligations promptly.
Margin pressures reflected by minimal operating profits paired with net losses denote ongoing challenges in expense control or cost-of-sales management [S10]. Moreover, transitional effects from the new fiscal calendar create periodic earnings volatility complicating trend identification
As a smaller reporting company newly accessing public capital markets subject to evolving disclosure standards, Elmet may also face execution risks tied to scaling internal controls, governance frameworks and meeting broader market expectations for transparency.
Near-Term Catalysts and What to Watch Next
Key milestones include the next quarterly earnings update subsequent to the May call scheduled per recent announcements [N1]. Market reception following these disclosures will likely shape perceptions regarding sustainability of early positive operating trends versus structural cost issues.
Investor reaction to Nasdaq-related visibility events [N2] may also serve as barometers for institutional interest fueling secondary liquidity demands.
Operational milestones—such as evidence of improving margins, managing working capital effectively evidenced by sustained current ratios near 1.75 (from Q1) [F1], or announcements related to customer contract wins—will be crucial monitoring points that help distinguish cyclical disturbances from structural growth patterns.
Brief Financial Profile: Snapshot of Liquidity and Profitability
At quarter end April 3, 2026, Elmet reported revenue of approximately $56 million yielding operating income near $1.86 million but incurring a net loss around $338,000—a narrow margin squeeze visible at the bottom line [F1]. Cash reserves stood at roughly $1.8 million juxtaposed against total debt exceeding $50 million leaving net debt close to $48.5 million by conservative calculation [F1]. Current assets totaled around $120 million relative to current liabilities nearing $68.6 million resulting in a healthy current ratio of approximately 1.75 indicating sufficient short-term liquidity coverage altogether [F1].
Such metrics reflect an early maturation phase typical for smaller reporting entities balancing growth investment with nascent operational profitability while managing substantial leverage burdens laying groundwork for future refinancing needs or equity raises if required.
This analysis bases all conclusions strictly on documented disclosures including the latest quarterly filing dated May 29, 2026 ([S2]), subsequent event updates ([S3]), companyfacts financial snapshots ([F1]), and publicly verifiable news releases ([N1],[N2]). No undue extrapolation beyond stated facts is included here; inference has been clearly identified where applied within broader industry context guidance.
Disclaimer: This is research-only, informational analysis and not investment advice. It may include AI-generated interpretation and general industry context. Always verify important details using primary sources.

Comments