
EPR Properties Enhances Profitability Through Experiential Real Estate Specialization and Conservative Capital Management
EPR Properties leverages its niche in experiential real estate with long-term, triple-net leases to deliver steady cash flows and improve profitability despite economic uncertainties.
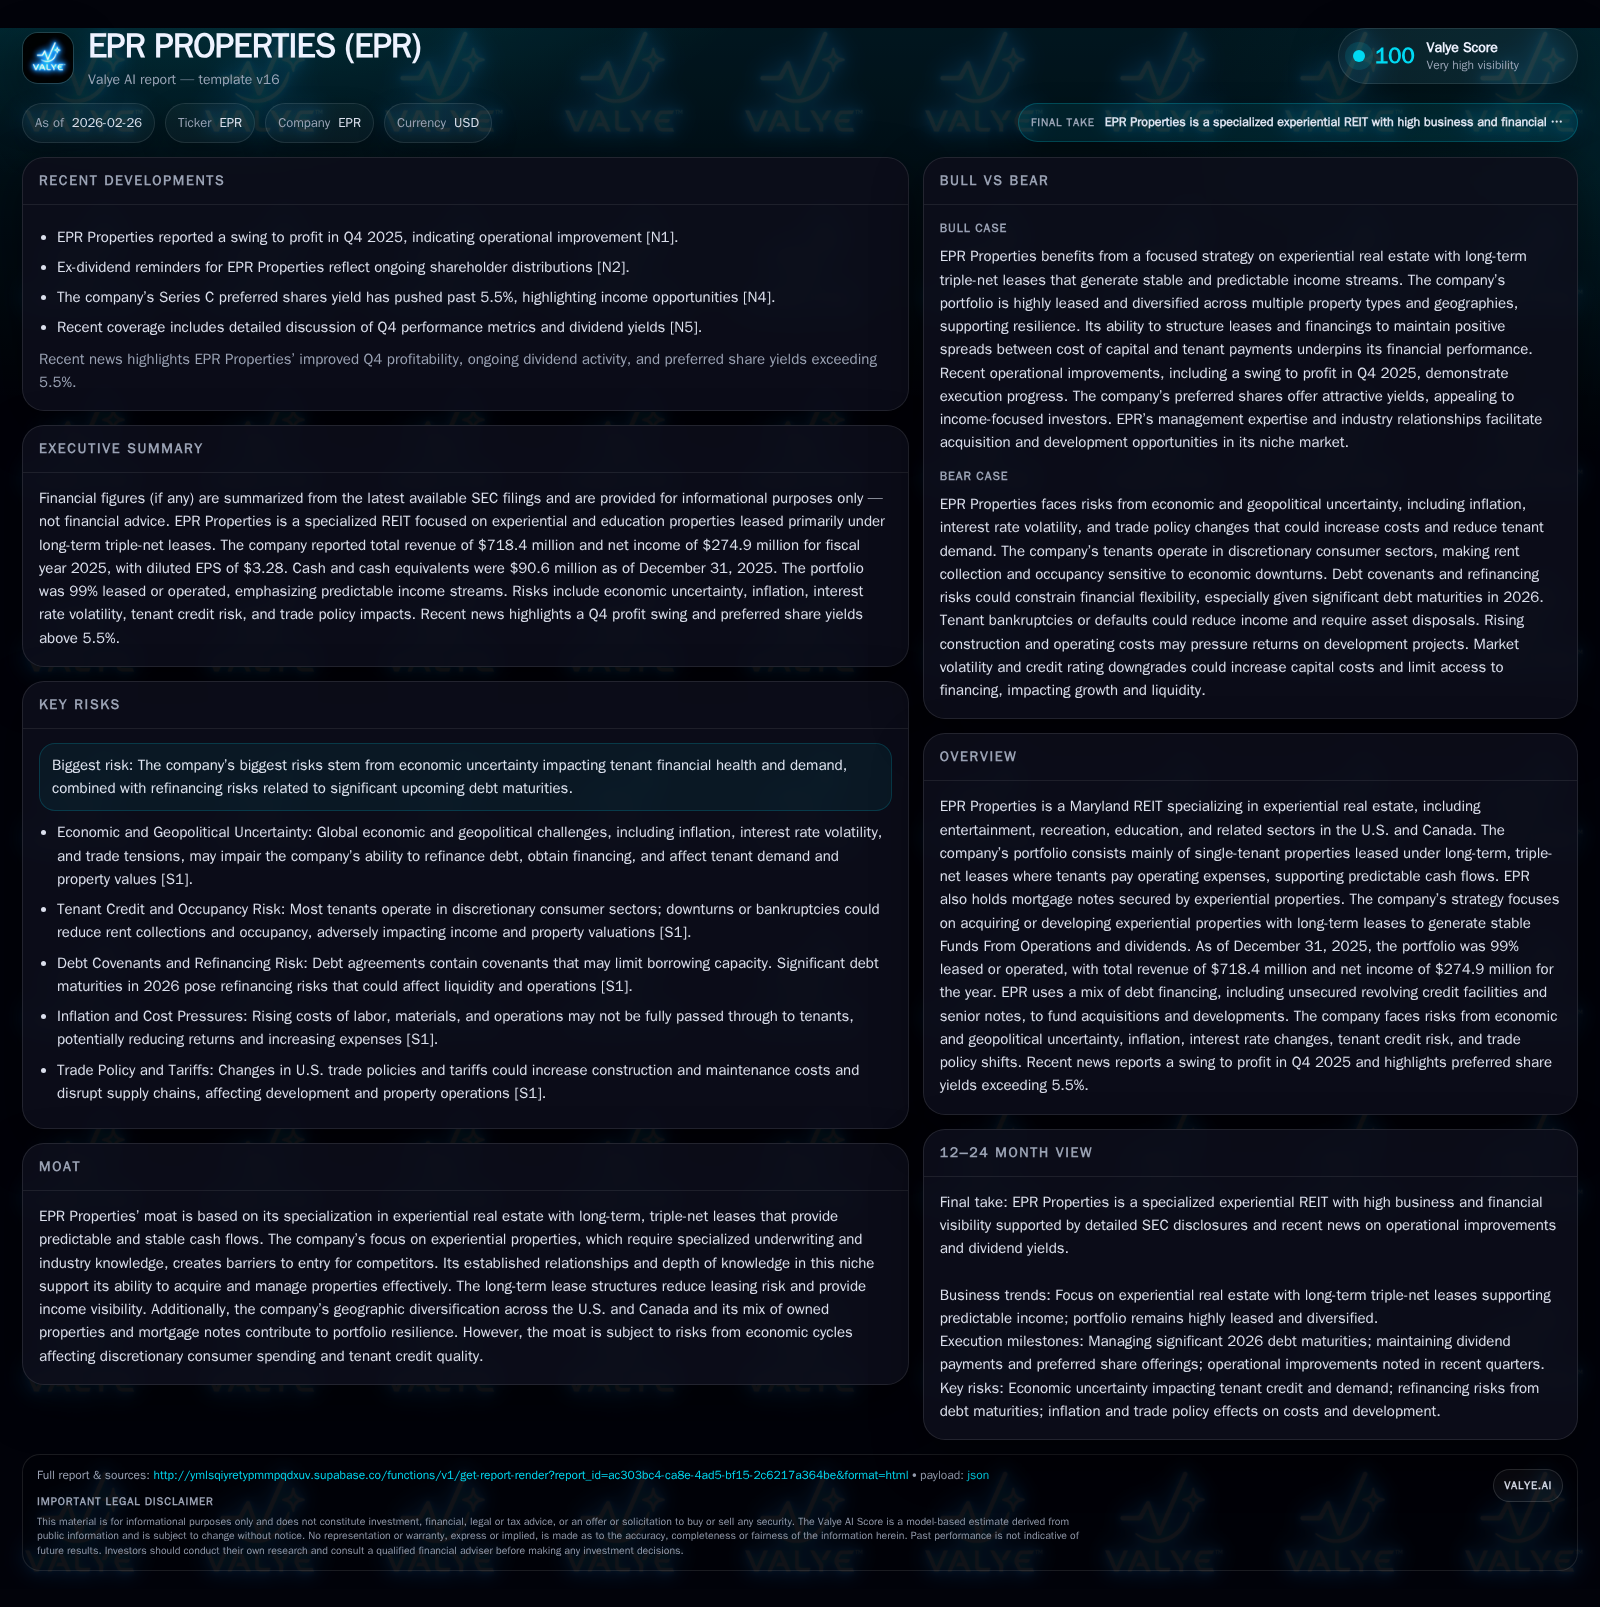
EPR Properties, a Maryland-based REIT focused on experiential properties across the U.S. and Canada, demonstrated robust financial performance in 2025 marked by a nearly 90% jump in net income. The company’s niche specialization in entertainment, recreation, and education real estate under long-term lease agreements provides stable cash flows and mitigates leasing risk. While revenue growth remained modest, operating income expanded significantly due to improved operational efficiencies. Its conservative capital structure—with predominantly unsecured debt and ample liquidity—supports ongoing investment and debt maturities management. However, economic volatility, refinancing risks, and tenant credit health remain critical areas to watch.
Company Overview
EPR Properties is a Maryland REIT specializing exclusively in experiential real estate sectors including entertainment venues, recreation facilities, educational properties, and related segments throughout the United States and Canada [S24]. This strategy focuses on acquiring or developing single-tenant properties held under long-term triple-net leases (NNN), where tenants bear operating expenses such as property taxes, insurance, and maintenance. This lease structure enhances cash flow predictability by mitigating direct operating cost exposure for EPR.
The company also holds mortgage notes secured by experiential assets, diversifying its portfolio beyond direct property ownership [S24]. As of December 31, 2025, EPR's portfolio was approximately 99% leased or operated, underscoring robust occupancy levels within this niche [S1].
Historical Financial Performance
EPR's financial results for fiscal years 2022 through 2025 demonstrate consistent top-line growth alongside significant improvement in profitability:
Historical performance (annual)
| FY | Rev ($mm) | Net ($mm) | CFO ($mm) | OpInc ($mm) | Rev YoY | Net YoY |
|---|---|---|---|---|---|---|
| 2025 | 718 | 275 | 421 | 414 | +2.9% | +88.2% |
| 2024 | 698 | 146 | 393 | 316 | -1.1% | -15.6% |
| 2023 | 706 | 173 | 447 | 306 | +7.2% | -1.8% |
| 2022 | 658 | 176 | 442 | 311 |
Source: SEC companyfacts cache [F1].
Capital returns and efficiency (annual)
| FY | Div ($mm) | Buybacks ($mm) | FCF ($mm) |
|---|---|---|---|
| 2025 | 291 | 10 | |
| 2024 | 280 | 11 | 129 |
| 2023 | 272 | 4 | 178 |
| 2022 | 266 | 4 |
Source: SEC companyfacts cache [F1].
Revenue growth was modest but positive over four years with a compound trend towards stabilization.
The pronounced jump in net income (+88%) between 2024 and 2025 reflects operational improvements and likely reduced impairment charges compared to prior years [S21][S4]. Operating income likewise improved sharply (+31%), indicating enhanced efficiency or favorable lease economics.
Operating cash flow grew moderately (+7%) to $421 million supporting sustained dividend payments ($291 million) consistent with the REIT model’s focus on distributing earnings to shareholders [F1][S26]. Capital expenditures remained relatively stable near $264 million focusing on selective acquisitions or developments.
Modest share repurchases totaling just under $10 million demonstrate disciplined capital return amid a cautious approach to buybacks.
Capital Structure and Liquidity
At year-end 2025, total debt stood at approximately $2.93 billion predominantly composed of unsecured senior notes with interest rates ranging between 3.6% to ~4.95% maturing through the next decade [S5][S14]. Nearly all debt is unsecured (99%), providing flexibility though increasing exposure to market conditions.
EPR maintains a sizable undrawn revolving credit facility of $1 billion set to mature in October 2028 with options for two six-month extensions [S4][S6]. No draw was outstanding on this facility at year-end—a signal of sufficient liquidity buffers supported by approximately $90.6 million in unrestricted cash plus restricted reserves earmarked for escrows or development funding [S21][F1].
The company faces approximately $630 million of upcoming debt maturities due in calendar year 2026 spread across various senior note tranches [S18]. Management indicates confidence in managing these obligations through refinancing or issuance proceeds but acknowledges economic uncertainties could challenge procuring optimal terms [S9][S16].
Covenants embedded within debt instruments impose limitations on leverage metrics such as debt-to-asset ratios (max ~60%) and require maintaining adequate coverage ratios [S13][S19]. As per filings, EPR complied with all covenants as of FY-end despite ongoing macroeconomic headwinds.
Business Strategy & Moat
EPR's competitive advantage stems from its deep specialization in experiential properties requiring nuanced underwriting metrics related to consumer discretionary spending patterns uncommon among broader commercial REITs [S1][S19]. The triple-net lease structures with long durations reduce vacancy risks while offering strong visibility into rental income streams.
This niche focus requires sophisticated tenant credit assessments due to dependencies on consumers' willingness to spend on leisure, entertainment, education, or fitness-related experiences which can be sensitive to economic cycles [S1][S19]. Geographic diversification across U.S.and Canadian markets helps mitigate region-specific downturns.
Experienced asset management teams support stable tenant relationships and portfolio optimization through mix adjustments or selective property sales contributing positively during the recent year [S21].
Industry Context Analysis
The broader REIT sector has seen volatility given inflationary pressures driving up costs for materials like steel—which increases development capex—and higher interest rates elevating borrowing costs [S2]. Though EPR leverages unleveraged leases shifting many price inflation risks onto tenants via escalators or percentage rents, fixed contractual limits temper protection against extreme inflation events.
The experiential segment inherently faces recession sensitivity due to reliance on discretionary spending; however, an ongoing post-pandemic recovery trend has bolstered demand for entertainment and recreational venues nationally.
Refinancing risk remains salient as balloon maturities approach amid tightening credit markets despite historically conservative leverage targets set by EPR’s management.
Future Growth Prospects & Risks
Growth drivers include strategic acquisitions or developments of well-located experiential properties underpinned by long-term stabilized leases supporting recurring FFO generation [S24]. Additional mortgage loan originations secured by experiential assets may supplement yield.[S24]
Growth could be constrained by:
- Elevated capital costs limiting economically viable acquisition or development opportunities.
- Tenant financial stress during economic slowdowns reducing lease renewals or rent collection reliability.[S1][S19]
- Refinancing risk for significant upcoming debt maturities particularly if market liquidity tightens further.
- Regulatory risks including compliance costs related to ADA or environmental concerns embedding contingent liabilities.[S20]
Investors should monitor quarterly leasing updates for occupancy trends as well as announced acquisitions or dispositions that might signal shifts in portfolio composition or strategy execution.
Capital Allocation & Returns
With net income rising strongly in FY25, EPR sustained common shareholder dividends totaling approximately $291 million consistent with prior periods reflecting payout policy aligned with REIT tax rules emphasizing distributions [F1][S26]. Buybacks were modest but consistent with cautious capital deployment balancing growth investments vs return of capital.
An approximate return on equity near ~13% is derived from net income relative to shareholder equity reported around $2.33 billion at year-end [F1]. Free cash flow calculated as operating cash flow minus capex yields about $157 million supporting reinvestment capacity while maintaining distribution commitments sustainably.[F1]
This positions EPR well for measured expansion while preserving balance sheet flexibility.
Key Points To Watch Going Forward
- Execution on refinancing ~$630 million debt maturing during calendar year-2026 under potentially less favorable market conditions.
- Tenant credit quality trends within leisure/recreational sectors sensitive to cyclical consumer spending shifts.
- Capital deployment pace balancing acquisition/development opportunities versus return-of-capital policies amid evolving macroeconomic pressures.
- Potential changes in trade policies or tariffs impacting construction costs indirectly affecting development margins.[S2]
- Inflation dynamics exceeding escalation caps potentially compressing landlord yields.
- Portfolio occupancy rates sustaining near current high marks ensuring steady revenue inflows.[S1]
- Any regulatory developments impacting compliance costs particularly ADA/environmental standards.[S20]
Conclusion
EPR Properties’ focus on experiential real estate anchored by long-term triple-net leases furnishes it with a durable competitive edge delivering predictable cash flows through economic cycles characterized by heightened uncertainty over discretionary spending patterns. After showing strong earnings recovery and growth momentum in fiscal year 2025 alongside prudent balance sheet management—highlighted by largely unsecured debt financing and ample liquidity—the company is cautiously positioned for future growth prospects.
Nonetheless, vigilance remains warranted around refinancing obligations amid volatile financial markets and maintaining tenant creditworthiness amidst potential cyclical slowdowns impacting consumer sentiment toward leisure activities fundamental to EPR’s business model.
This analysis is based on publicly available information including EPR Properties’ SEC filings through February 26, 2026 [F1] and relevant news articles dated up to February 25, 2026 . It does not constitute investment advice but aims to provide a comprehensive understanding of company fundamentals and sector context.
Disclaimer: This is research-only, informational analysis and not investment advice. It may include AI-generated interpretation and general industry context. Always verify important details using primary sources.
Comments