
Energy Services of America Elevates Regional Infrastructure with Diverse Contracting Scope
Q1 2026 revenue growth and profitability gains showcase ESOA's execution strength in multi-industry infrastructure services across mid-Atlantic and central U.S. markets.
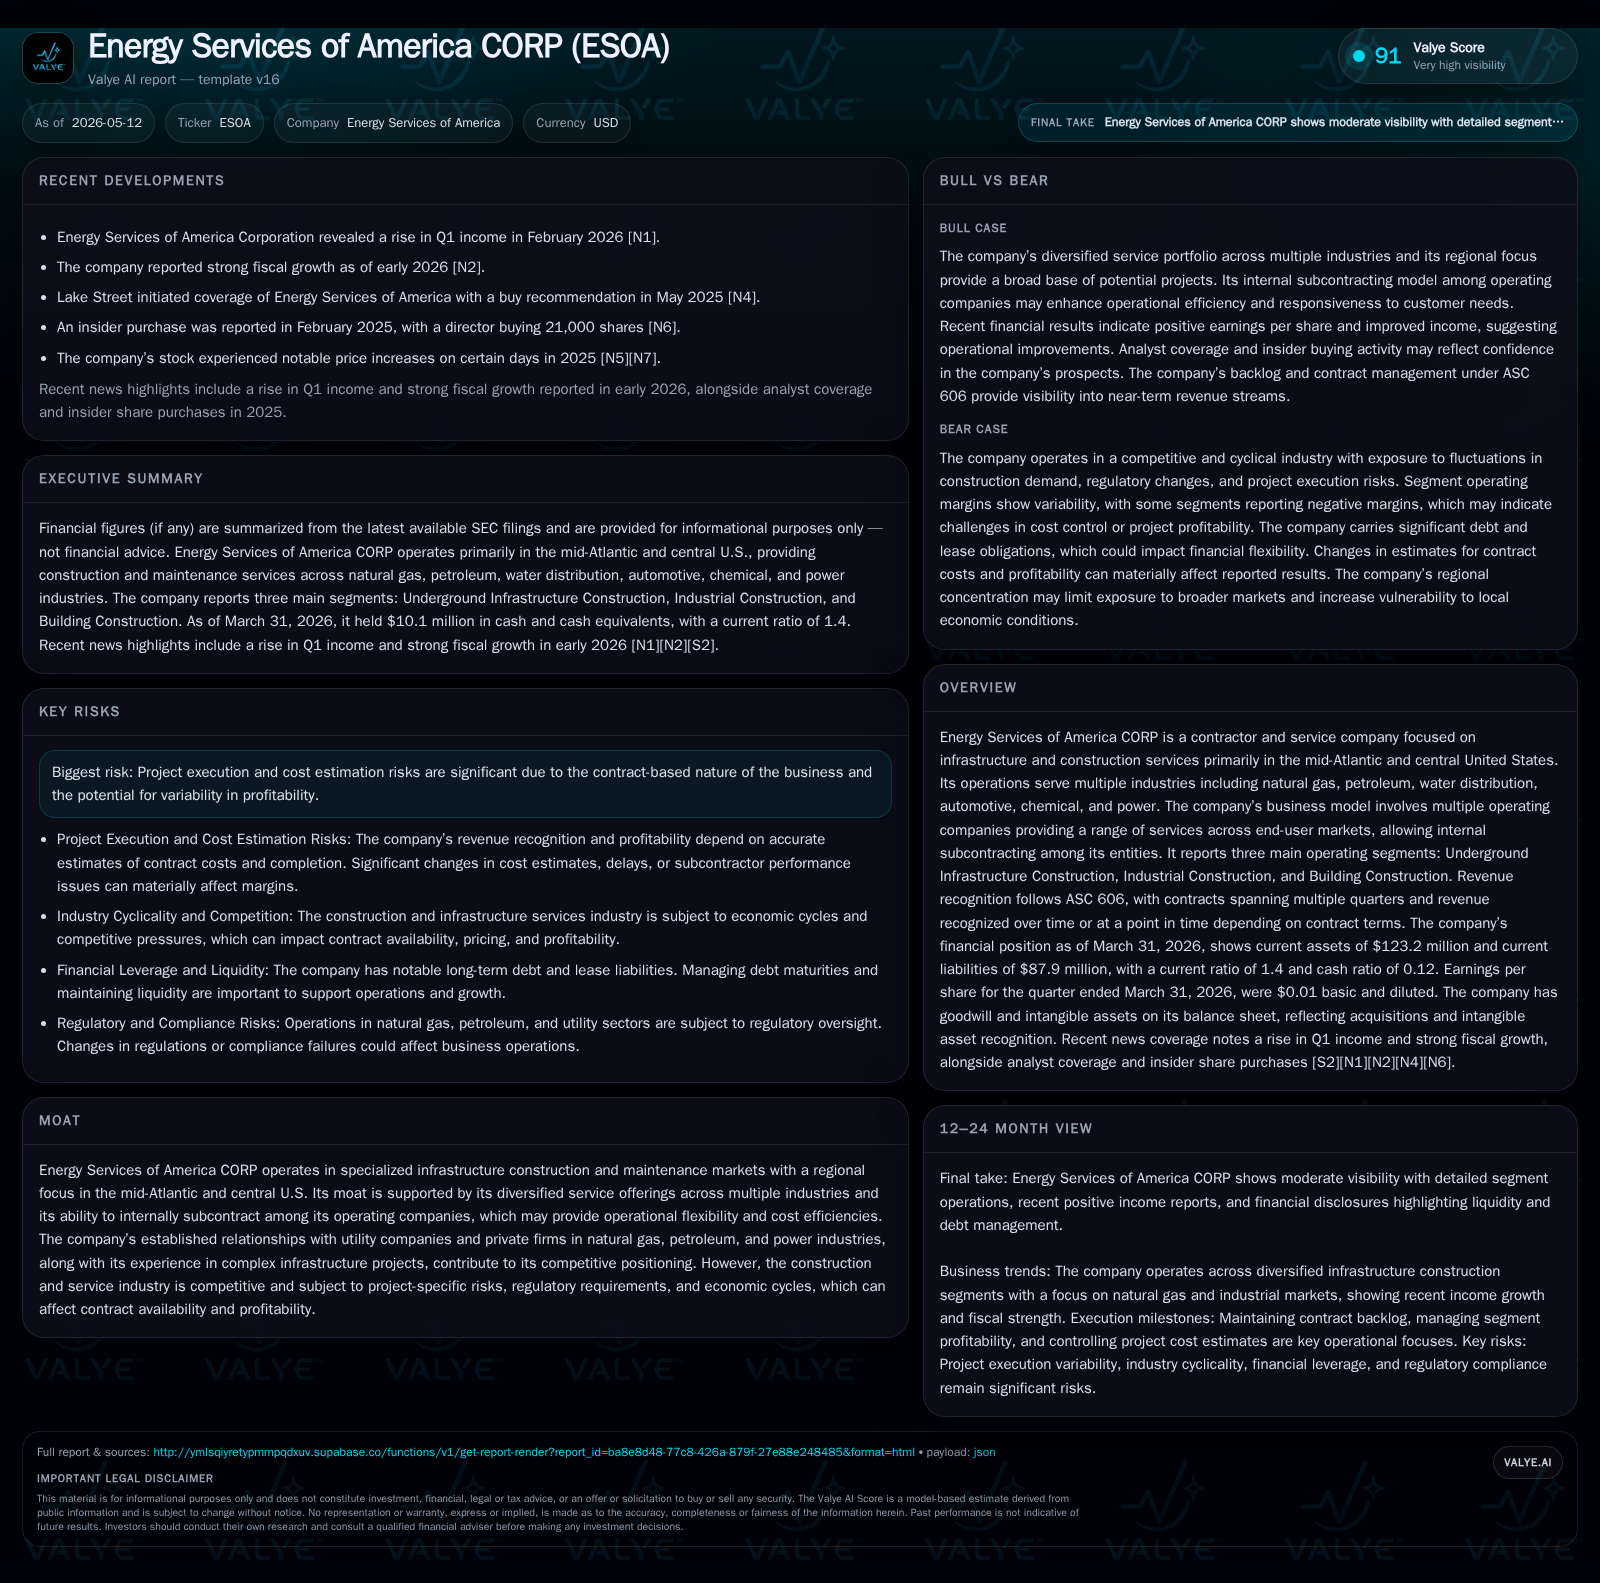
Energy Services of America Corporation (ESOA) reported a significant revenue increase to $93.2 million for Q1 2026, reflecting improved contract cost estimation and operational execution. Its diversified business model encompasses three core segments—Underground Infrastructure Construction, Industrial Construction, and Building Construction—serving key energy and industrial sectors in its regional footprint. While competitive pressures and project risks persist, ESOA’s internal subcontracting flexibility and longstanding customer relationships support growth prospects. Financially, the company maintains solid liquidity with a current ratio of 1.4x and net income turned positive to $2.9 million in the quarter.
Q1 2026 Operating Update: Revenue Recognition and Project Cost Dynamics
Energy Services of America Corporation (ESOA) reported first-quarter 2026 revenues of $93.17 million, a notable increase from $76.68 million in the year-ago quarter [S2]. Management attributes this growth to enhanced precision in cost estimation methods underpinning contract revenue recognition under ASC 606 standards. The firm highlighted that profit recognition accuracy requires reliable estimates of project costs across multiple variables such as bid completeness, scope changes, fluctuating labor and material expenses, overhead extensions due to weather or client delays, and subcontractor performance [S2]. Despite inherent unpredictabilities in such factors common to infrastructure contracting, ESOA expresses confidence based on its extensive experience.
Net income for Q1 turned positive at approximately $2.92 million versus a net loss in the prior comparable period [S2], demonstrating an improvement in project delivery effectiveness and margin realization. Segment operating analysis reveals varied gross profit percentages across its core operations—with Industrial Construction achieving about 13.7% gross margin while Underground Infrastructure posts 9.4%, reflecting differing market dynamics and cost structures [S12].
This earnings progression underscores ESOA’s emphasis on strengthening contract cost controls amid fluctuating input prices—a perennial challenge in mid-sized infrastructure service providers.
Business Model Architecture: Multi-Segment Infrastructure Services Across Key Industries
ESOA operates through three primary reportable segments: Underground Infrastructure Construction; Industrial Construction; and Building Construction, each addressing distinct infrastructure domains critical to regional economic activity [S1][S7].
- Underground Infrastructure Construction encompasses installation and maintenance of natural gas pipelines (distribution & transmission), water/wastewater lines, corrosion protection systems, horizontal drilling services, and ancillary gas station facilities.
- Industrial Construction serves the automotive, chemical processing, power generation, and manufacturing sectors with electrical/mechanical installations including HVAC/R systems, controls integration, fire protection systems, often within complex plant environments.
- Building Construction focuses on smaller scale projects such as educational facilities, local/state government buildings, rehabilitation efforts including minor bridge work. This segment relies heavily on subcontracting both externally and internally among ESOA's various operating entities.
The company's business model leverages diversification across these segments allowing continuity of revenue streams as market demands fluctuate between energy infrastructure development and institutional construction projects. A notable structural strength is the ability to internally subcontract work among its operating companies — enhancing operational agility while reducing dependence on expensive external subcontractors [S1]. This internal supply chain control can moderate costs thus partially insulating margins during pricing pressure periods.
Revenue recognition follows ASC 606 guidelines recognizing revenue over time or at completion points depending on contract specifics which vary between lump-sum bids or unit-price contracts common in pipeline projects [S2].
Competitive Positioning Within Regional Mid-Atlantic and Central U.S. Markets
With a geographic focus primarily on the mid-Atlantic states extending into central U.S., ESOA benefits from established long-term relationships with both utility companies (natural gas/power) and private industrial enterprises [S1]. These entrenched customer connections provide steady access to recurring maintenance contracts alongside newer capital expansion works driven by regulatory compliance upgrades or infrastructure renewal mandates.
However, ESOA operates in an industry marked by fragmentation with numerous small-to-mid sized competitors alongside national contractors possessing greater scale advantages. While larger players may command stronger pricing leverage or deeper balance sheets for bidding large projects nationwide, ESOA’s regional specialization enables precise local execution expertise leveraging knowledge of state regulations and terrain complexities.
The company’s portfolio diversity across utilities (natural gas/power), water infrastructure, automotive chemical plants plus public building contracts also propagates risk diversification against sectoral downturns—a partial moat given specialized skill requirements pervasive across these markets [S1]. Still the highly competitive construction environment limits pricing power sustainability necessitating continual emphasis on operational efficiency.
Drivers of Growth: Contract Backlog, Customer Diversification and Internal Subcontracting
Looking forward, ESOA’s growth catalysts are rooted largely in:
- Backlog momentum: The company's documented backlog reflects substantial near-term revenue visibility spanning quarters ahead benefiting from ongoing capital infrastructure rebuilds particularly post energy sector transitions stressing pipeline modernization requirements.
- Sector diversity: Expansion into adjacent industrial markets like chemical processing facilities upgrades alongside stable utility refurbishment contracts reduces exposure volatility.
- Internal subcontracting synergies: Cross-segment subcontracting opportunities allow flexible resource allocation enhancing capacity utilization reducing external subcontractor spend; this dynamic also supports integrated bid offers appealing to customers seeking single-source vendors for complex multi-discipline projects.
Regulatory trends favor investments in cleaner natural gas distribution networks alongside water infrastructure renewals—a secular tailwind supporting contract bid pipelines especially within ESOA's primary regions where aging infrastructure demands consistent replacement or rehabilitation efforts [S2][S1].
Moreover, ESOA’s robust presence within automobile manufacturing facility maintenance positions it to capture incremental retrofit work amid evolving emissions standards enforcement that typically triggers plant equipment overhaul projects.
Risk Factors: Estimation Accuracy, Schedule Delays, and Market Cyclicality
Despite operational strengths ESOA faces persistent risks primarily centered around:
- Project cost estimation variability: Accuracy of initial bids remains critical given contract profitability depends heavily on managing labor/material price changes post-bid acceptance as well as quantifying scope modifications promptly [S2]. Overrun propensity from extended overhead tied to delays poses another leaky margin vector.
- Schedule disruptions: Weather conditions or owner-driven change orders can extend timetables increasing indirect costs not always fully reimbursed by customers.
- Competitive pressures: Intense competition could compress margins especially for commoditized services typical in building construction where switching costs are lower.
- Economic cyclicality: Broader economic downturns impacting industrial capital expenditures or public funding availability for infrastructure projects may reduce tender volumes affecting volume growth sustainability.
Management must maintain stringent operational discipline coupled with improved forecasting methodologies to mitigate these execution risks influencing quarterly earnings swings typical in project-based contracting sectors.
Near-Term Milestones and Monitoring Points: Contract Awards, Execution KPIs, and Guidance
Key monitoring signals for ESOA's path ahead include:
- Upcoming quarterly contract awards data that will inform backlog replenishment trends providing visibility into demand momentum amid sectoral capex cycles [S2][S3].
- Operational execution KPIs such as frequency of cost overruns or schedule slippages will indicate improvements or deficiencies in project management practices.
- Any explicit revisions to financial guidance or disclosure commentary regarding contractual pipeline status communicated in successive periodic filings will elucidate management confidence levels.
These milestones will clarify whether recent earnings improvements reflect sustainable enhancements in project delivery or episodic outcomes driven by favorable bidding windows.
Latest Financial Snapshot: Balance Sheet Strength and Profitability Indicators
Latest financial snapshot
| Metric | Value | Period |
|---|---|---|
| Cash & equivalents | $10mm | |
| 2026-03-31 | ||
| Current assets | $123mm | |
| 2026-03-31 | ||
| Current liabilities | $88mm | |
| 2026-03-31 | ||
| Current ratio | 1.4x | |
| 2026-03-31 |
Source: SEC companyfacts cache [F1].
| Metric | Value | Period End |
|---|---|---|
| Revenue | $93.17 million | |
| 2026-03-31 | ||
| Net Income | $2.92 million | |
| 2026-03-31 | ||
| Cash & Equivalents | $10.1 million | |
| 2026-03-31 | ||
| Current Ratio | 1.4x | |
| 2026-03-31 |
On the balance sheet front, ESOA maintains a healthy liquidity profile with cash & equivalents totaling approximately $10.1 million supported by current assets around $123 million against current liabilities near $88 million yielding a reasonable current ratio of about 1.4x as of quarter-end March 31, 2026 [F1][S2]. Total debt levels appear moderate relative to cash balances enabling manageable leverage positions measured against EBITDA coverage implied by recent profitability reversals.
Operating cash flow dynamics show positive conversion aligning with improving net income results signaling financial flexibility aiding working capital demands intrinsic to multiyear construction contracts where timing differences between billings and cash receipts can compress liquidity buffers temporarily.
This analysis is based solely on publicly available information including the latest quarterly filing dated May 11th, 2026 ([S2]), recent event disclosures ([S3]), the annual report ([S1]), supplemented by companyfacts snapshot data ([F1]). No forward-looking investment opinions are expressed herein.
Disclaimer: This is research-only, informational analysis and not investment advice. It may include AI-generated interpretation and general industry context. Always verify important details using primary sources.
Comments