
Diamondback Energy’s Growth and Capital Returns Face Pressure from Margin Contraction and Liquidity Constraints
After rapid revenue growth driven by acquisitions and commodity price strength, Diamondback Energy’s profitability and capital allocation face new limits amid rising costs and debt servicing.
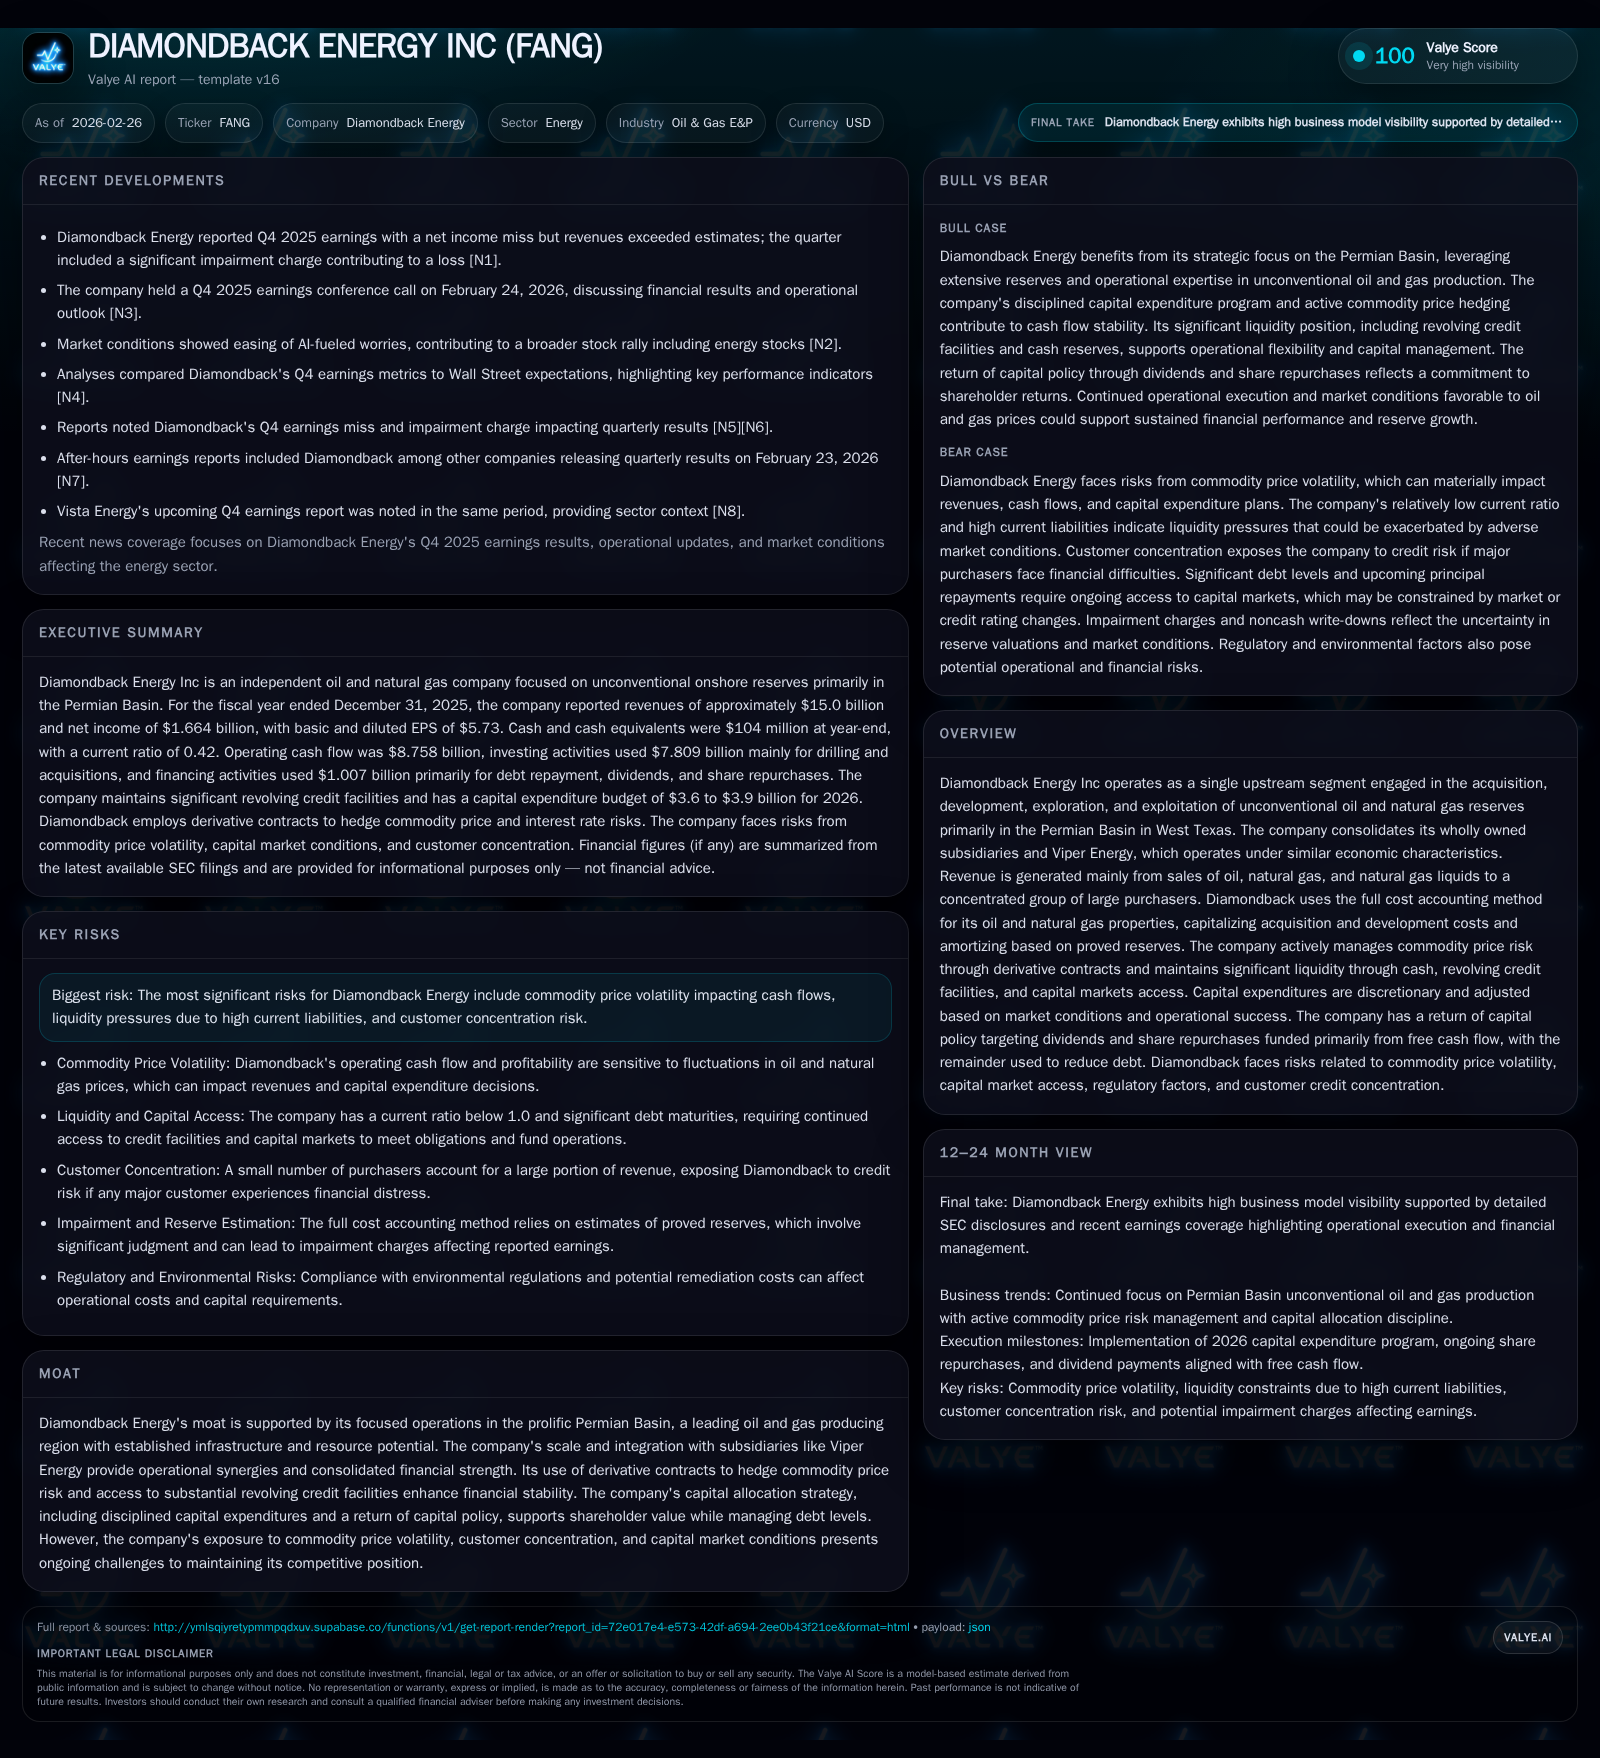
Diamondback Energy (FANG) expanded top-line revenues impressively over recent years, fueled largely by higher commodity prices and strategic acquisitions in the Permian Basin. However, operating income and net income fell sharply in 2025 as cost pressures and impairments weighed on margins. The company maintained strong operating cash flows enabling substantial share buybacks and dividends despite this profit compression. Looking ahead, management plans capital expenditures approaching $3.6-$3.9 billion in 2026 to sustain drilling activity, but execution flexibility remains critical given volatile pricing and liquidity challenges. Diamondback’s concentrated regional focus preserves operational moat but exposes it to commodity cycles and customer concentration risks. Balance sheet management via debt repayments, revolving credit availability, and return of capital policy will be essential in navigating near-term profitability headwinds.
Company Overview and Operational Focus
Diamondback Energy Inc (ticker: FANG) operates exclusively in upstream oil and gas exploration and production with a geographic concentration in the prolific Permian Basin of West Texas. The company consolidates operations from wholly owned subsidiaries along with Viper Energy, its affiliated entity with similar economic characteristics [S9]. Diamondback produces a mix of crude oil, natural gas, and natural gas liquids (NGLs), selling primarily to a narrow group of large purchasers [S9]. The company employs full cost accounting for exploration assets, consistently capitalizing acquisition and development costs against proved reserves.
Historical Growth Dynamics
Diamondback has delivered rapid revenue growth over recent fiscal years, principally propelled by surging commodity prices coupled with acquisitive expansion strategies including the Endeavor, Double Eagle, and Viper Sitio acquisitions [S23]. Revenue advanced nearly 36% year-over-year from $11.07 billion in 2024 to $15.03 billion in 2025 per the latest annual results [F1]. This top-line acceleration reflects both higher realized product prices—particularly oil—and incremental production volumes associated with these deals.
However, profitability metrics tell a more complex story: operating income plunged from $4.40 billion in 2024 to approximately $1.27 billion in 2025—a decline exceeding 70%—with net income halving as well [F1]. Adverse impacts stem from impairment charges recorded in Q4 2025 on certain assets reflecting changed macro conditions [N13], alongside elevated operating costs including water services for completions [S26]. This dynamic indicates considerable margin compression despite buoyant revenue.
Annual Financial Summary
Historical performance (annual)
| FY | Rev ($bn) | Net ($bn) | CFO ($bn) | OpInc ($bn) | Rev YoY | Net YoY |
|---|---|---|---|---|---|---|
| 2025 | 15.0 | 1.7 | 8.8 | 1.3 | +35.8% | -50.1% |
| 2024 | 11.1 | 3.3 | 6.4 | 4.4 | +31.6% | +6.2% |
| 2023 | 8.4 | 3.1 | 5.9 | 4.6 | -12.8% | -28.3% |
| 2022 | 9.6 | 4.4 | 6.3 | 6.5 |
Source: SEC companyfacts cache [F1].
Capital returns and efficiency (annual)
| FY | Div ($mm) | Buybacks ($mm) | FCF ($bn) |
|---|---|---|---|
| 2025 | 1156 | 7.8 | |
| 2024 | 1578 | 959 | 5.6 |
| 2023 | 1444 | 840 | 5.3 |
| 2022 | 1572 | 1098 | 5.8 |
Source: SEC companyfacts cache [F1].
Note: Share repurchase data for FY25 includes accelerated buybacks including related party transactions.
Cash Flow Strength Amid Profit Pressure
Despite compressed profits, Diamondback generated a striking $8.76 billion in net cash from operations during calendar year 2025—up nearly 37% versus prior year—indicating high-quality underlying cash generation driven by working capital timing benefits and effective derivative hedges [S1][F1]. Cash flow generation underpins maintenance of robust liquidity necessary to fund discretionary capital spending programs alongside shareholder distributions.
Capital expenditures increased over 20% year-over-year to just under $1 billion on a standalone basis, reflecting continued investments chiefly focused on operated horizontal drilling and completion activities primarily in the Midland Basin [S4][F1]. Total budgeted capex including anticipated future outlays is projected between $3.60 billion and $3.90 billion for fiscal year 2026—dramatically larger reflecting sustained development ambitions consistent with proved reserve growth objectives [S4]. Management retains discretion to scale rig count based on commodity pricing signals.
Capital Allocation: Balancing Growth With Returns
Diamondback pursues an explicit capital allocation framework targeting return of at least half its adjusted free cash flow via share repurchases, dividends, or variable payouts while using remaining funds towards deleveraging [S7]. In fiscal year 2025 alone, the company returned roughly $2 billion through buybacks complemented by dividend payments totaling approximately $1.16 billion [F1][S7]. Notably, the board raised quarterly base dividends during Q4 2025 indicating confidence despite profit volatility [N1][S7].
The share repurchase program was expanded mid-2025 from an initial authorization of $6 billion to now allow up to around $8 billion excluding excise tax effects – significant firepower remains given that about $2.7 billion was still available as of year-end after substantial activity [S7]. Repurchases included opportunistic tender offers with affiliated shareholders enhancing flexibility.
Balance Sheet Position and Liquidity Outlook
At year-end 2025, consolidated debt principal stood near $14.5 billion predominantly comprising long-dated senior notes supplemented by term loans drawn for recent acquisitions such as Double Eagle [S4][F1]. The company maintains sizeable unutilized revolving credit facilities totaling approximately $2 .5 billion with maturity into mid-2030 providing additional liquidity cushion [S10]. Interest costs on floating rate borrowings averaged mid-5% reflecting favorable covenant terms tied to stable BBB-/Baa2 investment-grade ratings maintained by major agencies [S4][S10][S11].
Current liabilities were elevated at around $4.6 billion against current assets below half that figure leaving a current ratio close to 0 .42 posing short-term liquidity considerations requiring precise cash management especially during downturns or volatility [F1]. Nonetheless, access to capital markets continues actively supporting refinancing opportunities.
Industry Context: Permian Basin Edge Offsets Risks
Operating entirely within the Permian Basin—the U.S.’ preeminent shale play—Diamondback benefits from established infrastructure networks lowering logistics costs versus emerging basins [S9]. Its consolidated ownership model with Viper enables synergistic operational control over mineral rights monetization strategies which stabilize revenue streams even through volatile commodity cycles.
However, dependence on a limited customer base exposes commercial concentration risk observed throughout the sector where receivables profile can impact collections if counterparties face distress [S10]. Furthermore, persistent price volatility inherent to global energy markets continues imposing earnings unpredictability despite derivative hedging programs designed primarily to smooth cash flows without eliminating all downside exposure [S24].
What To Watch Going Forward (Analysis)
- Realized commodity prices remain critical variables influencing revenues/cash flow strength given Diamondback's leveraged cost structure.
- Execution on ambitious ~$3 .9 billion capital expenditure plan will test operating efficiency amid equipment availability constraints common across E&P economies currently; possible deferrals could occur prudently.
- Continued deployment of share repurchases balanced against dividend increments will reflect management’s confidence levels related to macro energy outlooks.
- Debt repayment progress aligned with free cash flow generation will be key metric for assessing balance sheet risk mitigation trajectory.
- Developments regarding customer credit exposures or changes in working capital requirements could materially affect near-term liquidity.
- Market reaction post Q4 earnings miss related adjustment charges may shape investor perception around future guidance clarity given recent swings.[N13][N4]
Summary
Diamondback Energy demonstrated remarkable revenue growth riding strong oil market tailwinds coupled with multiple strategic permit acquisitions chiefly within the Permian Basin realm which leverages structural advantages such as infrastructure proximity and operational scale synergy through Viper integration.[F1][S9] Yet profitability metrics deteriorated substantially last fiscal year due mainly to impairment charges triggered by shifting macro factors along with cost inflation impacting breakeven economics.[N13] The resultant contraction pressed management into cautious yet continued capital deployment designed to hold developmental momentum while sustaining shareholder returns through robust buyback programs coupled with rising dividend policy.[S7]
Liquidity remains adequate supported by significant revolver capacity balanced against sizable near-term liabilities demanding active financial stewardship.[F1][S4][S10] The concentrated asset base confers operational leverage but simultaneously heightens exposure to market volatility underscoring risks embedded within single-basin upstream profiles common across many independent producers today.
While Diamondback's next chapters hinge heavily on underlying commodity price trajectories—including crude differential movements contextualized within U.S domestic supply trends—the firm’s disciplined approach toward capital structure management combined with aggressive return-of-capital policies illustrate adaptability amid episodic financial pressures confronting energy producers globally.
This report is provided solely for informational purposes based on publicly available data as of early 2026.The analysis avoids investment advice or specific recommendations.
Disclaimer: This is research-only, informational analysis and not investment advice. It may include AI-generated interpretation and general industry context. Always verify important details using primary sources.
Comments