
Falcon's Beyond Global Stakes Its Claim in Experiential Entertainment Growth
Recent quarterly results reveal a revenue surge and net income turnaround, offset by liquidity pressures and operational risks.
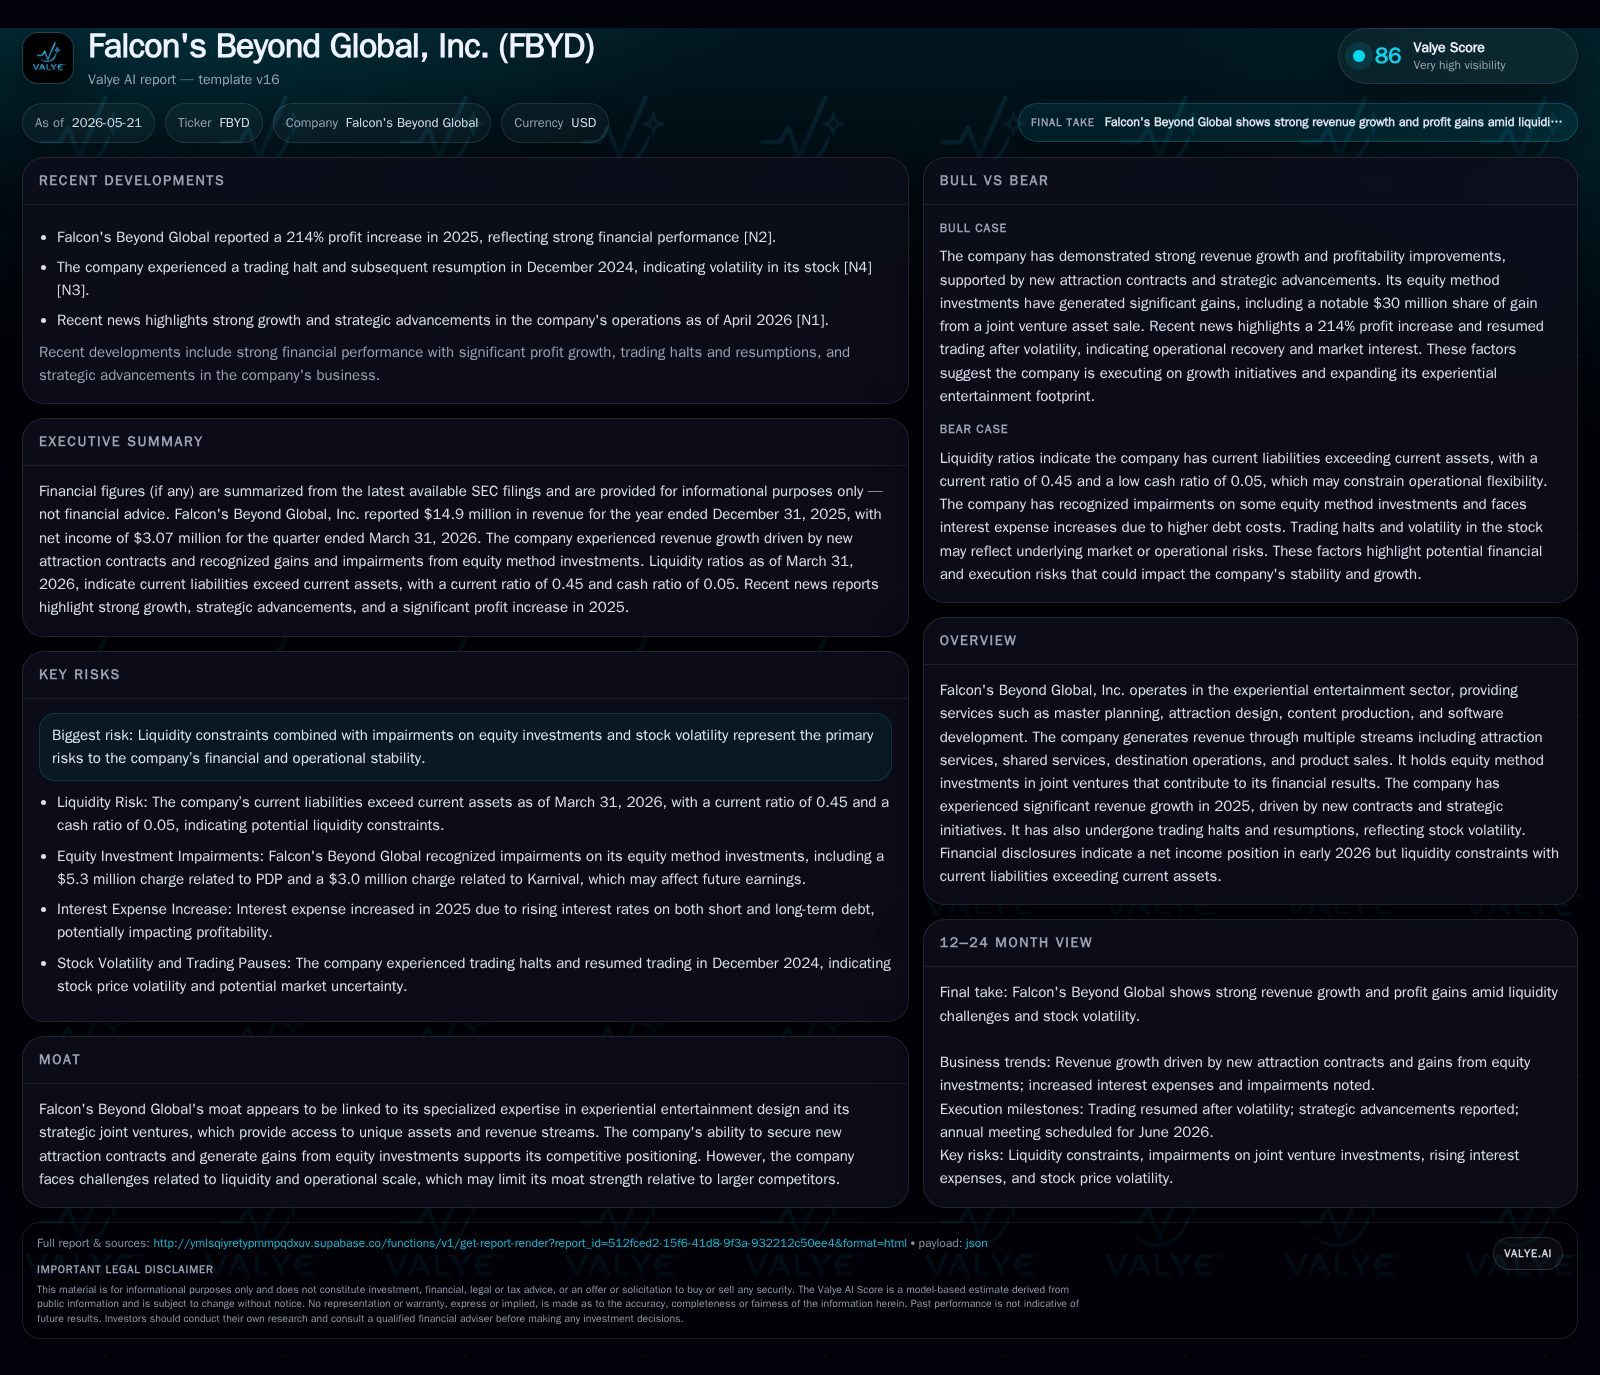
Falcon's Beyond Global, Inc. reported strong fiscal 2025 revenue reaching $14.9 million and achieved a net income of $3.07 million in Q1 2026, reflecting significant momentum in its experiential entertainment business. The company’s multi-stream model—including attraction design, content production, and joint ventures—supports growth but carries concentration risks and liquidity constraints evidenced by a current ratio below 0.5. Key risks include continuing legal disputes and reliance on a few large customers. Monitoring contract renewals and JV developments will be critical to tracking execution.
Latest Quarterly Operating Update: Momentum and Milestones
In its latest 10-Q filing dated May 14, 2026, Falcon’s Beyond Global reported fiscal year 2025 revenue of approximately $14.9 million [F1]. This figure underscores meaningful growth driven by new contracts and strategic initiatives within its experiential entertainment services segment. Notably, the company transitioned to a net income position in the first quarter of 2026, posting $3.07 million net earnings [F1]. This marks an important inflection point after prior periods of operating losses.
However, the balance sheet reflects notable liquidity challenges; the company’s current assets totaled around $10.5 million against current liabilities exceeding $23.4 million at quarter-end March 31, yielding a current ratio near 0.45 [F1]. This mismatch highlights constrained short-term cash flexibility despite profitability gains reported.
Additionally, recent event filings on May 14 reiterate this operating update without material changes to disclosed risk factors or capital structure discussions [S2][S3]. The sequencing of strong top-line expansion combined with net income generation contrasts against ongoing pressure points from working capital dynamics.
Business Model Overview: Multi-Stream Revenue in Experiential Entertainment
Falcon’s Beyond operates principally within the experiential entertainment domain providing specialized services such as master planning for themed environments, attraction design consulting, immersive content production, interactive software development, along with shared administrative services extended to its unconsolidated joint ventures (notably FCG) [S1]. Revenues derive from multiple streams: direct product sales related to attractions (~28% from one themed entertainment operator in early operations), shared support services (accounting, IT) contributing nearly half the revenues through FCG partnerships (45% in 2025), and equity income from these joint ventures [S1][F1].
This constellation of services appeals primarily to government-backed projects and institutional developers focusing on large-scale cultural complexes, theme parks, museums, zoos/acquariums, cruise experiences, and IP holders engaged in destination entertainment pursuits [S1]. The company benefits from proprietary intellectual property assets protected by layered confidentiality agreements and licensing structures designed to secure value capture from design innovations and software intellectual property.
Customer mix is concentrated—the bulk of FCG revenues stem from two main clients: QIC (60%) and NMDC (39%)—reflecting the bespoke nature of multi-phase development projects typical in this sector [S1]. Contractual terms often allow for termination with relatively short notice periods; thus continuity depends on maintaining strong client relationships while growing new contract backlog.
Competitive Positioning and Industry Dynamics
Within experiential entertainment—an industry blending content creation with physical destination development—Falcon’s Beyond holds a niche anchored by its intellectual property expertise combined with strategic equity investments in joint ventures that operate theme parks and resorts [S1]. Its moat appears linked less to scale than to specialized IP assets guarded by contractual protections including NDAs and licensing rights.
The company’s ability to deliver end-to-end attraction design coupled with proprietary software platforms provides differentiation versus competitors who may focus solely on design or content production segments. However, operational scale remains modest relative to larger industry players who command broader financial resources and distribution channels.
Customer concentration presents structural vulnerability; dependency on a few large government-backed projects exposes Falcon’s Beyond to shifts in public funding cycles or changing development priorities [S1]. Additionally, regulatory compliance across international jurisdictions adds complexity although this is typical for cross-border entertainment projects.
Growth Drivers Supporting Falcon’s Expansion
The primary levers for growth revolve around increasing contract awards for attraction design and destination operations through FCG joint ventures; retention and expansion of QIC/NMDC agreements; and scaling proprietary content licensing/interactive software offerings which promise higher margin recurring revenue streams [S1][S2][F1]. Equity method investments serve as both revenue contributors and strategic footholds enabling participation in operational upside within downstream theme park businesses.
Incremental margin improvement prospects exist as content IP licenses mature into subscription models or integrated platform deployments supporting venue interactivity enhancements. Further penetration into government-backed cultural developments can broaden pipeline visibility while diversified contract terms may mitigate termination risks inherent in existing agreements.
Active project stages progressing within JVs alongside marketing efforts aimed at attracting new institutional clients underpin near-term backlog health indicators. Falcon’s incremental investments in technology R&D also signal potential future differentiation stemming from enhanced user engagement solutions embedded within attractions.
Key Risks and Operational Constraints
Liquidity constraints dominate immediate concerns—the current asset to liability imbalance restricts operational maneuverability amid periods of increased working capital demands [F1]. This challenge is compounded by impairments reflecting investment valuation adjustments; notably an $8.3 million impairment loss recognized on equity method investments during FY 2025 illustrating volatility in JV performance outlooks [S1].
The company faces substantial legal exposure including an ongoing dispute with Guggenheim Securities over an $11.1 million fee claim related to their business combination transaction; although Falcon’s Beyond contests this liability vigorously through counterclaims citing fraud allegations [S1]. Resolution timing remains uncertain but is an important factor influencing market sentiment.
Moreover, reliance on a narrow customer base concentrated predominantly within large governmental/institutional entities exposes Falcon’s Beyond to project delays or cancellations tied to shifting public policies or budget reallocations [S1]. Operating scale limitations constrain opportunities for rapid absorptions of such shocks thereby heightening execution risk.
Stock price volatility evidenced by trading halts/resumptions underscores investor concern about financial stability amidst these headwinds, impacting capital raising capacity if needed.
Near-Term Monitoring: Milestones and Strategic Triggers
Investors should track developments regarding contract renewals or expansions with the key customers QIC and NMDC as renewal dynamics have direct material implications given their outsized revenue contribution [S2][S3]. Announcements arising from joint venture partners reflecting progress on new destination or resort projects can serve as early indicators of sustained demand traction impacting Falcon’s equity share gains.
Resolution or progression of ongoing litigation matters such as the Guggenheim lawsuit will materially affect perceptions around contingent liabilities or reputational impact [S1]. Additionally technical advancements or rollout success for newly developed content software platforms offer concrete signals about margin diversification potential.
Financial disclosures concerning liquidity management tactics—such as credit facility arrangements or refinancing strategies—will be critical given the stretched current ratio position [F1]. Monitoring stock market liquidity alongside Nasdaq compliance announcements may also shed light on broader investor confidence trends.
Current Financial Profile and Liquidity Assessment
At quarter-end March 31, 2026, Falcon's Beyond held cash equivalents totaling approximately $1.18 million against total debt estimated at $16.74 million resulting in a net debt position near $15.56 million [F1]. Current assets stood at about $10.5 million while current liabilities were markedly higher at roughly $23.4 million producing a current ratio of around 0.45—a level reflecting considerable short-term liquidity pressure [F1].
Despite reporting positive net income of $3.07 million for Q1 2026 indicating improving earnings capacity [F1], the company's working capital deficit highlights the need for prudent cash flow management going forward. Interest expenses derive mainly from related party loans used for operational funding underscoring dependency on external financing [S1].
This financial profile necessitates close monitoring of upcoming cash flow cycles tied to contract execution schedules along with any debt refinancing activity or additional equity issuance that might emerge from capital markets conditions.
This analysis synthesizes Falcon's Beyond Global's latest quarterly filings alongside annual disclosures to provide an informed perspective on operational performance complemented by balanced attention to financial constraints intrinsic to the experiential entertainment sector niche it occupies.
Disclaimer: This report is for informational purposes only without any investment advice or research view regarding securities mentioned herein.
Disclaimer: This is research-only, informational analysis and not investment advice. It may include AI-generated interpretation and general industry context. Always verify important details using primary sources.

Comments