
Fidelis Insurance Enlarges Capital Return While Managing Specialty Insurance Growth
A Bermuda-based specialty insurer sustains moderate revenue growth and recalibrates capital allocation with aggressive buybacks and steady dividends in 2025.
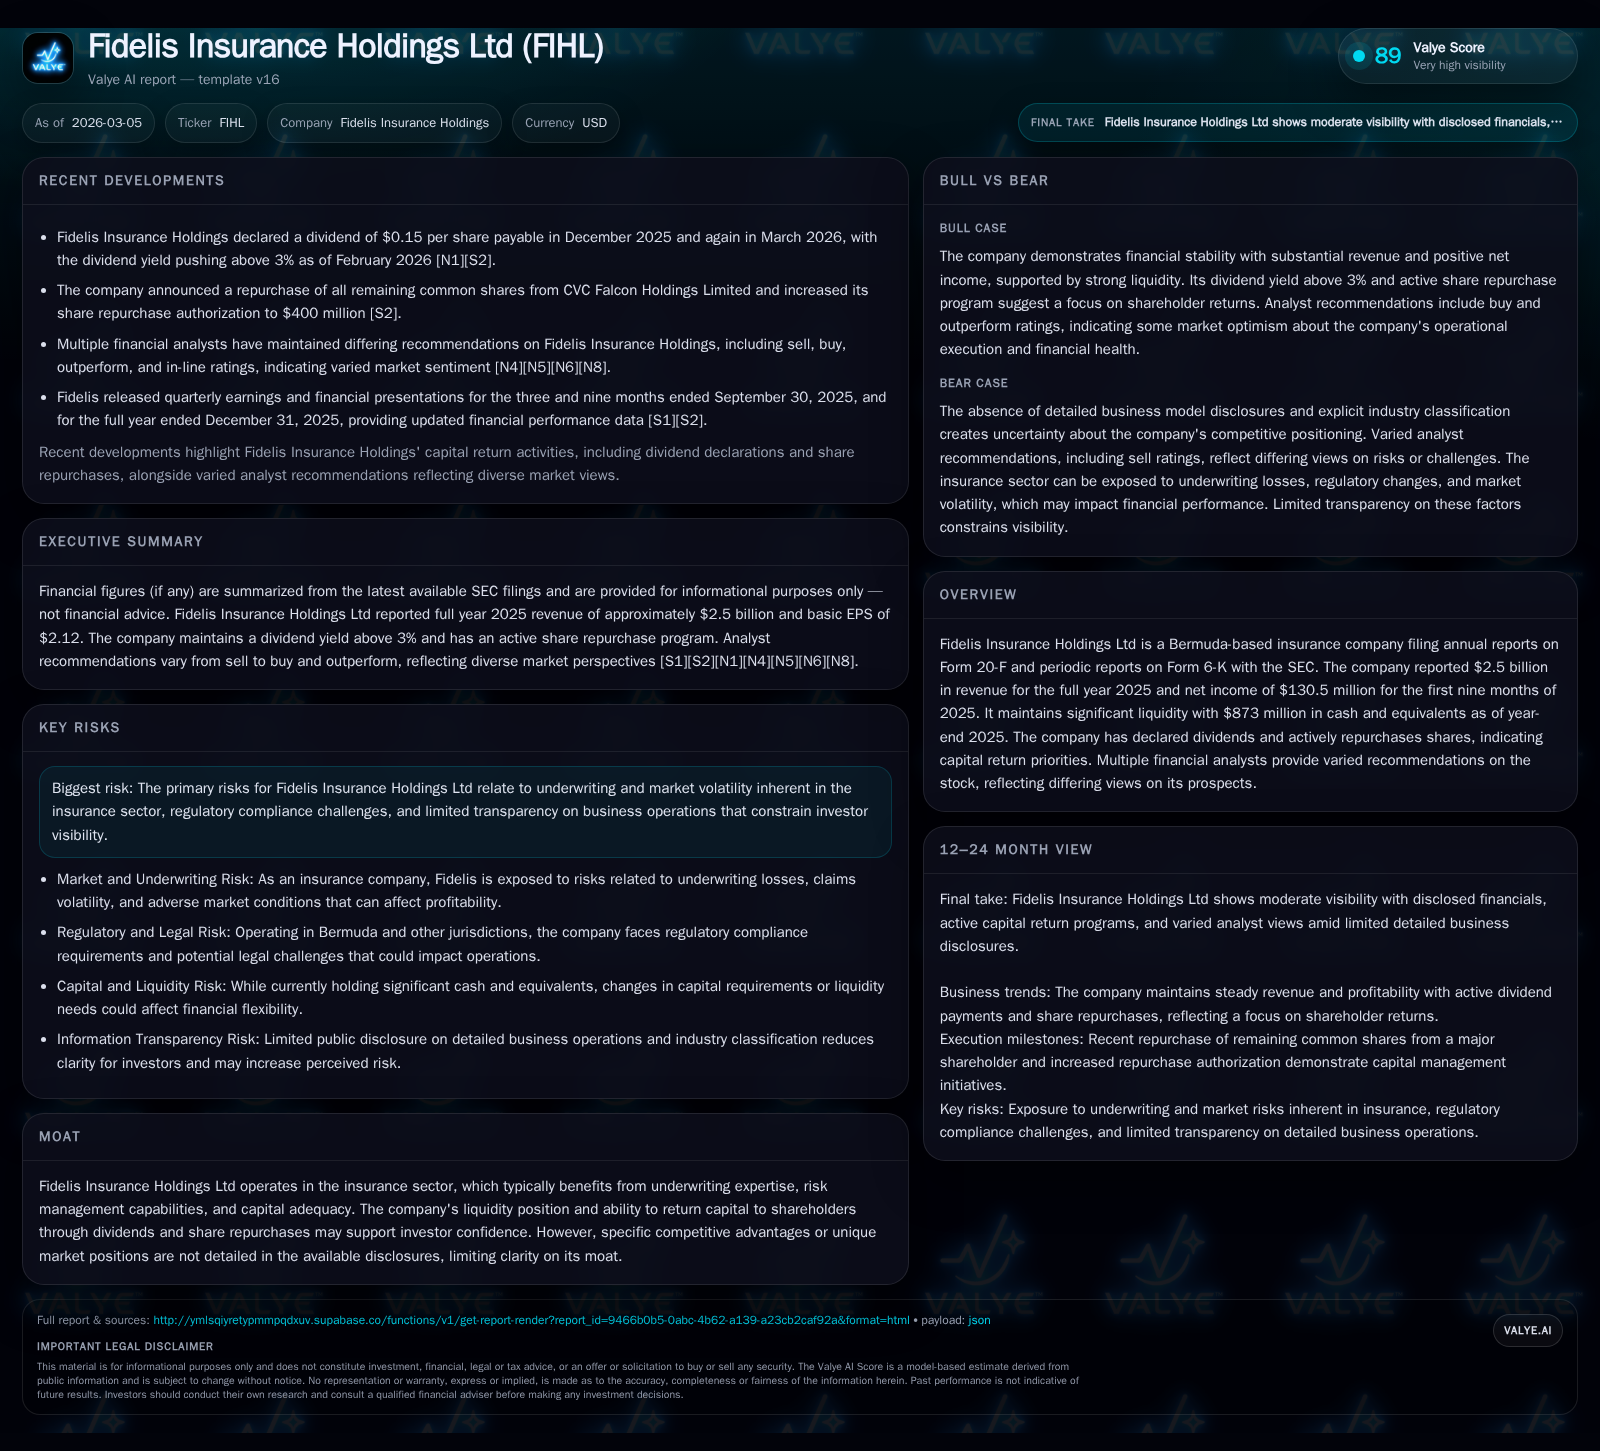
Fidelis Insurance Holdings Ltd reported incremental top-line growth to $2.5 billion in 2025, continuing its focus on targeted specialty insurance and reinsurance segments. Despite a sharp net income contraction compared to 2023, the company prioritized shareholder returns through dividends and a $400 million share repurchase authorization. Operating cash flows turned negative in 2025, reflecting market and underwriting volatility, but Fidelis benefits from robust liquidity with $873 million in cash equivalents. Looking forward, the company aims to capitalize on favorable property lines within Insurance while leveraging nimble capital deployment under a refined corporate structure.
Historical Performance
Fidelis Insurance Holdings Ltd’s recent annual results [F1][S1] reflect a specialty insurer balancing measured top-line expansion against volatile earnings outcomes tied to underwriting cycles. Revenue increased by approximately 3.3% year-over-year from $2.42 billion in FY 2024 to roughly $2.5 billion in FY 2025 (Table below). This follows a decline from a notably high $3.6 billion peak in FY 2023 when Fidelis may have benefited from opportunistic market conditions or lumpier business flows.
Net income underscores the volatility typical of insurance companies operating across complex specialty lines; it fell sharply by nearly 95% from over $2.1 billion in FY 2023 to about $113 million in FY 2024 [F1]. Latest data for FY 2025 net income is not yet available [F1]. The CFO swung from positive $618 million in FY 2024 to a negative position near -$408 million in FY 2025, highlighting potential timing issues around claims payout cycles or reserve adjustments that can impact cash generation.
Capital expenditures remain nominal (approximately $1.2 million in FY 2025), consistent with Fidelis's asset-light business model largely focused on risk underwriting rather than heavy infrastructure.
Equity levels remained around $2.4 billion through the three years ending FY 2025, which anchors the company’s capacity to absorb underwriting volatility and drive capital returns.
Historical performance (annual)
| FY | Rev ($bn) | Net ($bn) | CFO ($mm) | Capex ($mm) | Rev YoY | Net YoY |
|---|---|---|---|---|---|---|
| 2025 | 2.5 | -408 | 1 | +3.3% | ||
| 2024 | 2.4 | 0.1 | 618 | 5 | -32.7% | -94.7% |
| 2023 | 3.6 | 2.1 | 495 | 6 |
Source: SEC companyfacts cache [F1].
Capital returns and efficiency (annual)
| FY | Buybacks ($mm) | FCF ($mm) | ROE% |
|---|---|---|---|
| 2025 | 261 | -409 | |
| 2024 | 106 | 614 | 4.6 |
| 2023 | 0 | 489 | 87.0 |
Source: SEC companyfacts cache [F1].
(Note: Net income figure for FY 2025 not finalized; table presents available data.)
Strategic Business Overview
Founded in Bermuda with significant operations across Ireland and the UK, Fidelis operates principally through two segments: Insurance and Reinsurance [S1]. The Insurance segment comprises niche specialty lines such as Property, Marine, Asset-Backed Finance & Portfolio Credit, Energy, Cybersecurity, Aviation & Aerospace, Political Risk, Violence & Terrorism coverages among others.
The firm benefits from a multiyear favorable pricing environment particularly within property catastrophe-related lines following industry-wide rate hardening starting around the market disruptions of late-2019 [S1]. Fidelis leverages its leadership position and gross line size to secure preferential terms that enable cross-selling across multiple coverage classes.
Its Reinsurance business targets global property treaty placements using both proportional and excess loss structures supported by proprietary analytical overlays incorporating climate change impacts on risks like hurricanes and wildfires – a sophistication often absent or underestimated in vendor models [S1].
A key internal evolution has been the January 2023 separation transaction establishing TFP as an independent entity managing origination and underwriting functions separately while FIHL refines its role around capital strategy and portfolio optimization [S1]. This governance matrix aims to enhance agility and specialized focus.
Capital Allocation and Returns
The firm maintains generous liquidity reserves with approximately $873 million of cash and equivalents as of December 31, 2025 [F1][S7]. This liquidity underpins capital deployment flexibility amid insurance market cycles.
Capital return remains a visible priority evidenced by consistent quarterly dividends at $0.15 per share declared both late-2025 and early-2026 periods [S4][S6][N2]. Concurrently, share repurchases accelerated materially with authorized limits raised from previous levels to $400 million [S4] culminating in roughly $261 million executed during FY 2025 versus about $106 million in the prior year [F1].
The aggressive buyback activity suggests management confidence in intrinsic value despite earnings pressures or possibly reflects strategic share count management post their IPO debut on NYSE July 2023 [S1].
Return on equity is estimated near ~4.7% based on latest net income relative to equity base as of FY end [F1], indicating modest profitability amid current underwriting challenges.
Growth Prospects and Constraints
With a foundation built upon disciplined underwriting principles combined with robust broker networks and client relationships across diverse geographies, Fidelis is positioned to capitalize on sustained improvements within specialty property lines propelled by ongoing rate momentum [S1]. Its analytic edge via proprietary climate risk overlays further differentiates offerings within reinsurance verticals subject to increasing natural catastrophe exposures.
However, headwinds exist including inherent underwriting cycle volatility which manifested starkly in recent net income swings and negative operating cash flow performance signals operational leverage risks [F1][S1]. Regulatory transparency limitations—common for Bermuda-based insurers—may affect investor assessment of enterprise risk profile despite governance disclosures.
Moreover, fundamental challenges around evolving cyber threats, political violence climate risks, as well as global inflationary pressure on claim costs inject uncertainty into loss forecasting accuracy.
Near-Term Developments / Milestones to Watch
Key upcoming indicators include periodic financial releases clarifying full-year profitability trajectory for FY25 given partial interim disclosures [N2][S2][S3], as well as any subsequent revisions to capital return policies balancing shareholder distributions against growth capital needs.
Market reactions to Fidelis's planned corporate name change announced February ’26 may reflect repositioning efforts aimed at enhancing brand recognition within capital markets or broader investor appeal [S3].
Monitoring reinsurance treaty renewals over mid-2026 cycles will be telling regarding pricing trends globally – particularly within US hurricane-exposed portfolios where specialist reinsurer expertise is crucial.
Summary Considerations
Fidelis Insurance Holdings Ltd stands out as an active specialist insurer navigating mature but dislocated market dynamics through selective underwriting adaptation paired with proactive capital management including amplified share repurchases and solid dividend commitments. While recent profitability showed marked deterioration relative to record prior peaks indicative of sector cyclicality and potential loss reserve developments, the strong liquidity buffer alongside strategic segmentation provides resilience. Corroborating precise growth outlook requires watching forthcoming earnings updates together with industry pricing evolutions; the group's embedded proprietary analytics pertaining to natural catastrophe risks suggest potential competitive advantage if effectively utilized. Nonetheless, opaque operational detail outside broad segment disclosure limits analytical granularity for external stakeholders assessing embedded risks fully. Investors seeking insight should prioritize updates on combined ratios particularized by segment lines plus commentary on claim frequency/severity changes intertwined with regulatory regime shifts common for Bermuda-domiciled entities.
This analysis is informational only and does not constitute investment advice.
Disclaimer: This is research-only, informational analysis and not investment advice. It may include AI-generated interpretation and general industry context. Always verify important details using primary sources.
Comments