
Comfort Systems USA’s Q1 2026: Scaling Design-Build and Services Amid Economic Cyclicality
The company reported resilient first-quarter results driven by backlog health and strategic investments in prefabrication and service growth.
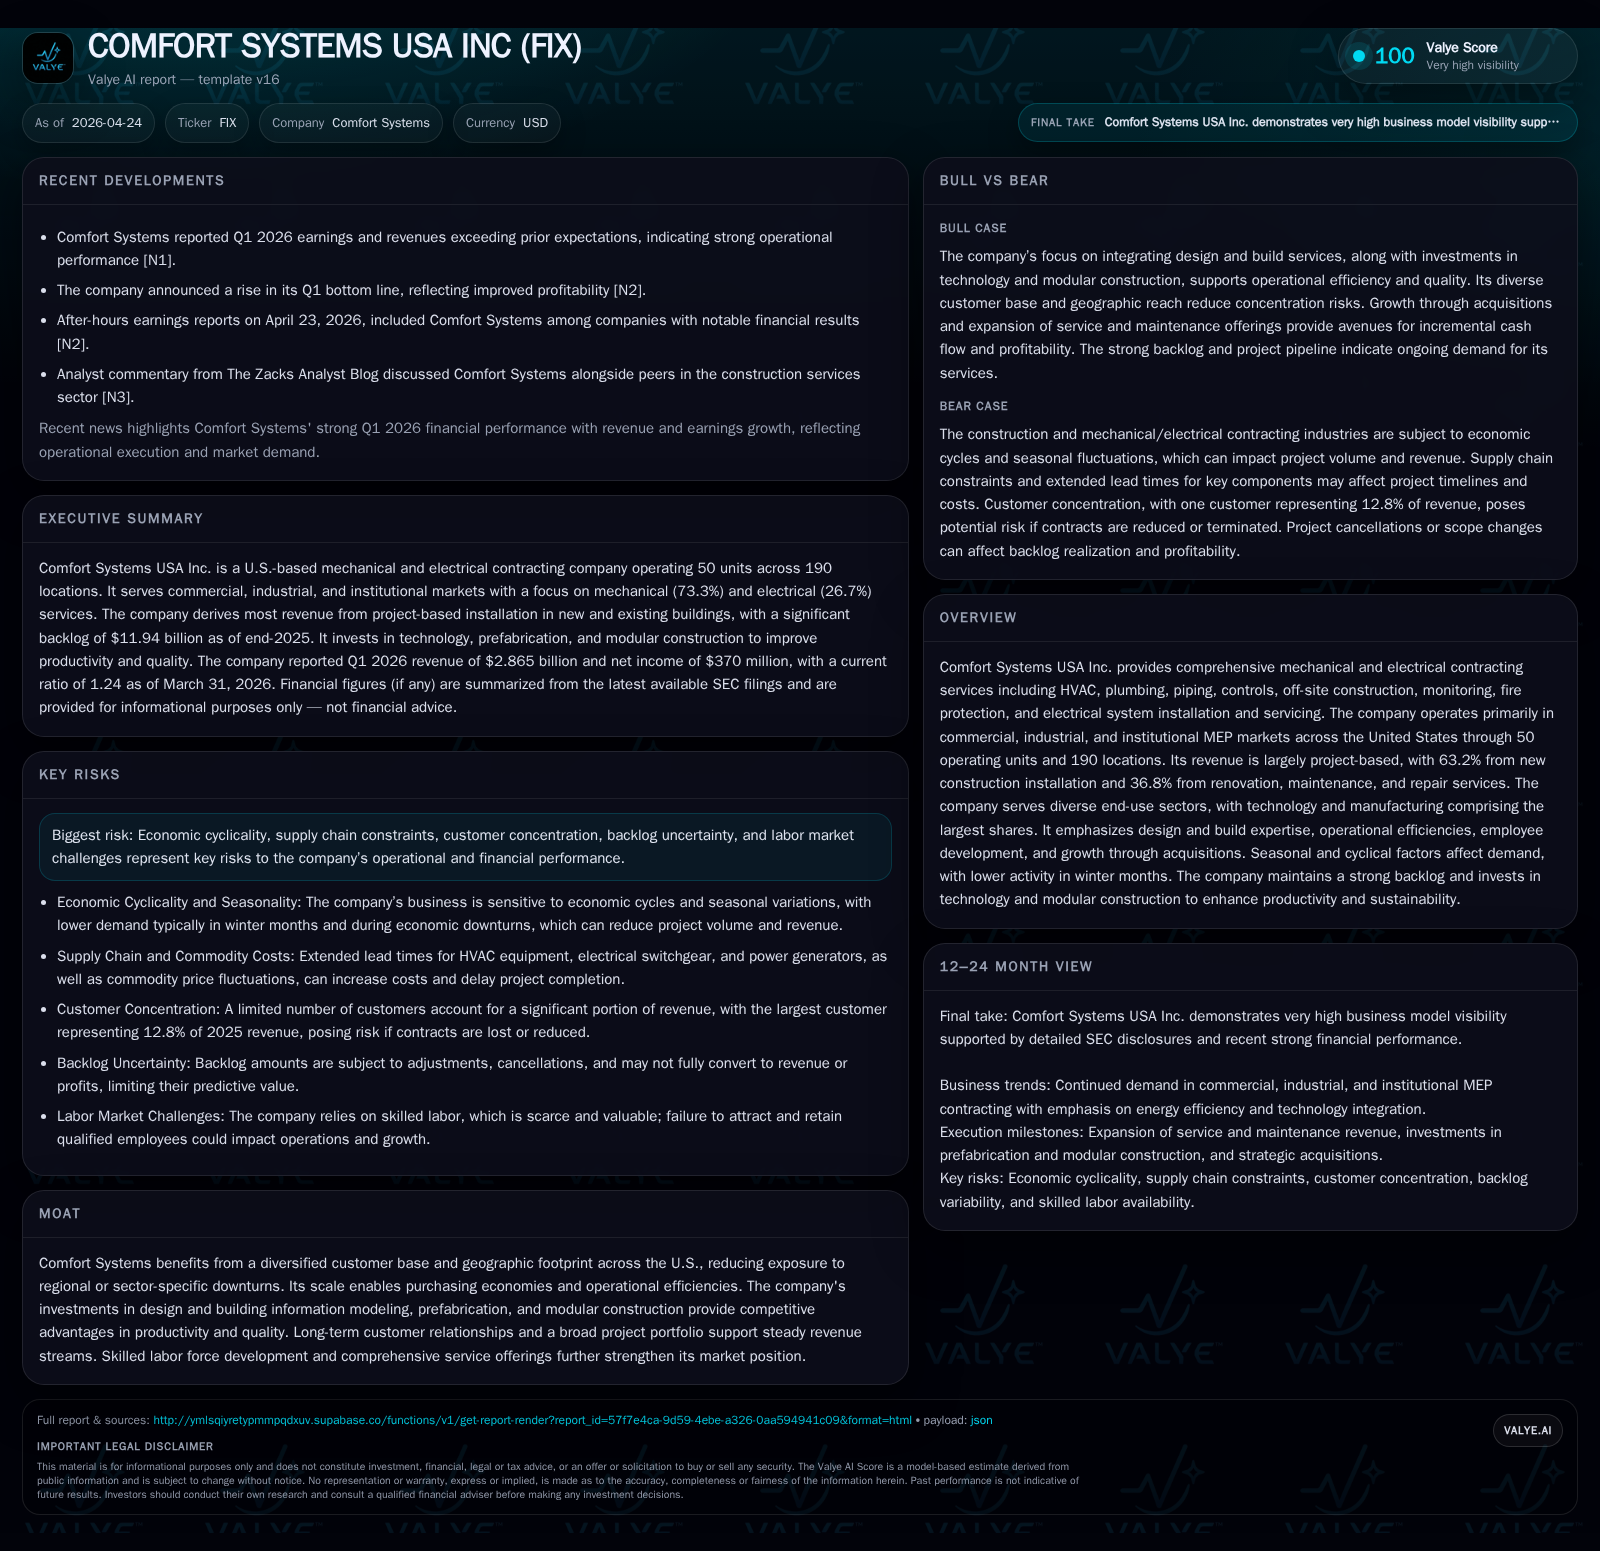
Comfort Systems USA Inc. (FIX) demonstrated operational resilience in Q1 2026 despite typical seasonal headwinds, underpinned by a solid backlog of $11.9 billion and a diversified U.S. footprint. The company continues to leverage its scale advantages through investments in off-site modular construction, design-build capabilities, and expanding service offerings. However, economic cyclicality and supply chain constraints present ongoing challenges for project execution and cost control. Financially, FIX maintains a conservative leverage profile with robust liquidity, supporting its acquisition-driven growth strategy and shareholder returns.
Recent Operating Update: Anchoring on Q1 2026
Comfort Systems USA Inc. filed its latest quarterly report on April 23, 2026 [S2], accompanied by an earnings press release the same day [S3]. The Q1 period is conventionally their slowest quarter due to winter seasonality affecting new construction activity. Despite this headwind, the firm maintained a robust project backlog nearing $12 billion as of December 31, 2025 [S17], which serves as a critical near-term revenue pipeline indicator.
The report details inclusion of certain unbilled receivables classified as contract assets reflecting payment timing nuances beyond mere passage of time [S2]. This accounting treatment aligns with industry norms for progress-based billing in large-scale commercial mechanical and electrical projects.
Total debt was approximately $39 million as of March 31, 2026, principally driven by notes payable to former owners related to acquisitions [S2]. Liquidity remains robust with unrestricted cash exceeding $1 billion at quarter end Q1 2026 and a current ratio of approximately 1.24x [F1][S2].
Capital allocation highlights include declaration of a quarterly dividend payable mid-May 2026 [S3] and no share repurchases during the quarter contrasting with active buybacks in prior years [S5][F1].
Business Model: Discipline in Mechanical & Electrical Contracting
Comfort Systems USA operates through approximately 50 business units spread over nearly 190 locations nationwide [S1]. It delivers comprehensive mechanical (HVAC, plumbing, piping, controls) and electrical (installation and servicing) contracting services primarily targeting commercial, industrial, institutional buildings, as well as multi-family residential properties [S1].
Revenue is predominantly project-based derived from two segments:
- Installation services for new construction (about 63%)
- Renovation, expansion, maintenance, repair, and replacement (approximately 37%)
Service offerings extend beyond basic installation to include off-site modular construction capabilities—a strategic investment area that enhances build quality while improving project timelines—and specialized remote monitoring and fire protection solutions [S1][S18].
Direct costs for commodities and finished goods typically comprise around 40–45% of project costs. Components range widely across HVAC equipment from suppliers like Trane or Carrier to electrical switchgear by Schneider Electric or Eaton [S7]. This broad supplier network helps mitigate some supply chain risks though peak demand periods can impose lead-time extensions upward of six months for specific items.
Customers are diverse across industries: technology firms represent the largest end market (45% revenue), followed by manufacturing (22%), healthcare (9%), education (7%), government (5%), office buildings (5%), and smaller shares from retail/restaurants/entertainment sectors [S4][S6][S15]. Such diversity cushions against sector-specific downturns.
Pricing is largely established via competitive bids but reflects significant technical expertise owing to the complex nature of MEP systems engineering. Comfort Systems also emphasizes "design and build" consultative selling that integrates engineering knowledge from the early stages improving bid accuracy and project outcomes while enabling operational efficiencies through prefabrication techniques [S1][S18].
Industry Structure & Competitive Position
The U.S. mechanical and electrical contracting industry is highly fragmented; Comfort Systems stands out as one of the larger players — substantially bigger than many small owner-operated local competitors — enabling it to leverage purchasing economies and operational best practices across its multi-state footprint [S1][S4][S8].
Its competitive moat includes:
- Scale advantages allowing centralized fabrication centers fostering asset utilization efficiency
- Geographic diversification reducing vulnerability to regional economic swings or localized disruptions
- Investment in modular/off-site construction methods enhancing productivity versus traditional stick-built approaches (a growing industry trend aiming to reduce onsite labor reliance)
- Broad service scope spanning installation through lifetime building system maintenance which yields higher-margin annuity-like revenues alongside volatile new construction work
- Long-term relationships with large corporate property owners facilitated by national accounts sales force enhancing retention opportunities.
Barriers to entry are moderate given the capital requirements for scaling fabrication capabilities plus the challenge of assembling skilled labor teams adept across multiple MEP disciplines.
Growth Drivers & Constraints
Growth Drivers
- Backlog strength: Backlog near $11.9 billion end-2025 implies robust revenue visibility although subject to standard cancellation/scoping risks [S17]. Large-sized projects averaging $2.9 million provide steady workload but also introduce execution complexity requiring disciplined management.
- Design-build integration: Increasing sophistication in building controls and energy efficiency demands integrated consulting which Comfort System’s investments in BIM (Building Information Modeling) technologies support, boosting productivity gains.
- Modular/off-site construction growth: Strategic acquisitions have expanded off-site modular capability allowing better quality controls coupled with faster delivery times—benefits that can command premium pricing.
- Service footprint expansion: Rapid growth strategy focuses on maintenance contracts which carry better margin profiles than installation projects; active hiring/training initiatives emphasize skilled technician availability supporting this shift [S18].
- Acquisition pipeline: Opportunistic acquisitions strengthen geographic coverage or add complementary service lines; company allocates significant cash flow toward these targets each year sustaining growth momentum.
Constraints & Risks
- Economic cyclicality: As documented repeatedly in risk disclosures [S1][S9], demand directly ties to macroeconomic drivers influencing construction spending—recessions compress volumes causing delayed revenue recognition since many contracts finish long after award.
- Cost pressures: Inflationary labor/materials inputs pose margin risk if unable to fully recover elevated costs or face supply chain delays leading to contract penalties.
- Customer concentration: Top customer accounted for nearly 13% of total revenue in recent years—loss or reduction could destabilize cash flows absent quick replacement business [S15].
- Labor market tightness: Securing qualified workforce across multiple trades remains challenging; labor shortages could increase wage inflation or limit capacity utilization impacting profitability.
- Backlog uncertainty: While backlog indicates future work scope, cancellations or scope adjustments can alter actual recognized revenue or profitability adversely [S17].
- Legal/regulatory exposures: Litigation related to warranties or project disputes occasionally impacts earnings unpredictably though historically non-material at aggregate level [S9][S21].
What To Watch Next
- Quarterly performance updates focusing on backlog conversion rates will be crucial given seasonality effects observed in Q1.
- Service segment margin trends could signal success in shifting mix toward recurring contracts which lowers earnings volatility.
- Acquisition announcements particularly those expanding modular capabilities or targeted geographies would reinforce growth story.
- Impact of inflationary inputs passthrough effectiveness assessed through gross margin stability amid commodity price changes.
- Capital allocation updates, including dividend policy continuance or potential share repurchase resumption after pause in Q1 [S5][F1].
- Debt profile monitoring especially any change in leverage covenants or credit facility utilization signaling financial flexibility usage.[F1]
Financial Profile: Supporting Evidence from Latest Filings & Historical Context
Historical performance (annual)
| FY | Rev ($bn) | Net ($mm) | CFO ($mm) | OpInc ($mm) | Rev YoY | Net YoY |
|---|---|---|---|---|---|---|
| 2025 | 9.1 | 1023 | 1186 | 1315 | +29.5% | +95.7% |
| 2024 | 7.0 | 522 | 849 | 749 | +35.0% | +61.5% |
| 2023 | 5.2 | 323 | 640 | 418 | +25.8% | +31.5% |
| 2022 | 4.1 | 246 | 302 | 254 |
Source: SEC companyfacts cache [F1].
Capital returns and efficiency (annual)
| FY | Div ($mm) | Buybacks ($mm) | FCF ($mm) |
|---|---|---|---|
| 2025 | 69 | 216 | 1031 |
| 2024 | 43 | 58 | 738 |
| 2023 | 30 | 21 | 545 |
| 2022 | 20 | 38 | 253 |
Source: SEC companyfacts cache [F1].
Over recent years Comfort Systems has demonstrated strong top-line growth highlighted by nearly +30% revenue CAGR from 2022 ($4.14B) to 2025 ($9.10B), fueled by organic expansion combined with strategic acquisitions increasing scale significantly [F1]. Operating income surged even faster (+75% YoY into $1.31B in FY25), illustrating operating leverage through efficient cost management amid volume gains.
Net income nearly doubled over this period reaching just above $1 billion in FY25 signaling consistent bottom-line improvement supported by healthy margins [F1]. Operating cash flow ($1.19B FY25) comfortably exceeds capital expenditures ($155M FY25), yielding free cash flow over $1 billion annually underpinning reinvestments plus shareholder returns via dividends ($68M FY25) and share buybacks ($216M FY25) [F1].
Balance sheet strength is underscored by unrestricted cash exceeding $1 billion at quarter end Q1 2026 coupled with minimal debt defined mainly as notes payable from acquisitions totaling ~$39 million [S2][F1]. Liquidity remains robust at well above one times current liabilities ($4.50B current assets vs $3.63B current liabilities) yielding comfortable current ratio ~1.24x [F1].[S2]
In summary, Comfort Systems blends steady cash flow generation with opportunistic deployment toward strategic acquisitions maintaining financial flexibility necessary amid potentially volatile economic conditions while continuing dividend policy supportive of shareholder base longevity.[F1]
This analysis synthesizes SEC filings through April 23–24 2026 ([S1]-[S26]) supplemented by contemporaneous market reporting ([N#]) without explicit investment recommendations.
Disclaimer: This is research-only, informational analysis and not investment advice. It may include AI-generated interpretation and general industry context. Always verify important details using primary sources.
Comments