
Fluent, Inc.'s Media Supply Constraints and Data-Driven Customer Acquisition Shape 2025 Performance
Fluent navigated media supply headwinds in 2025 while leveraging proprietary data and technology to sustain its commerce media solutions business.
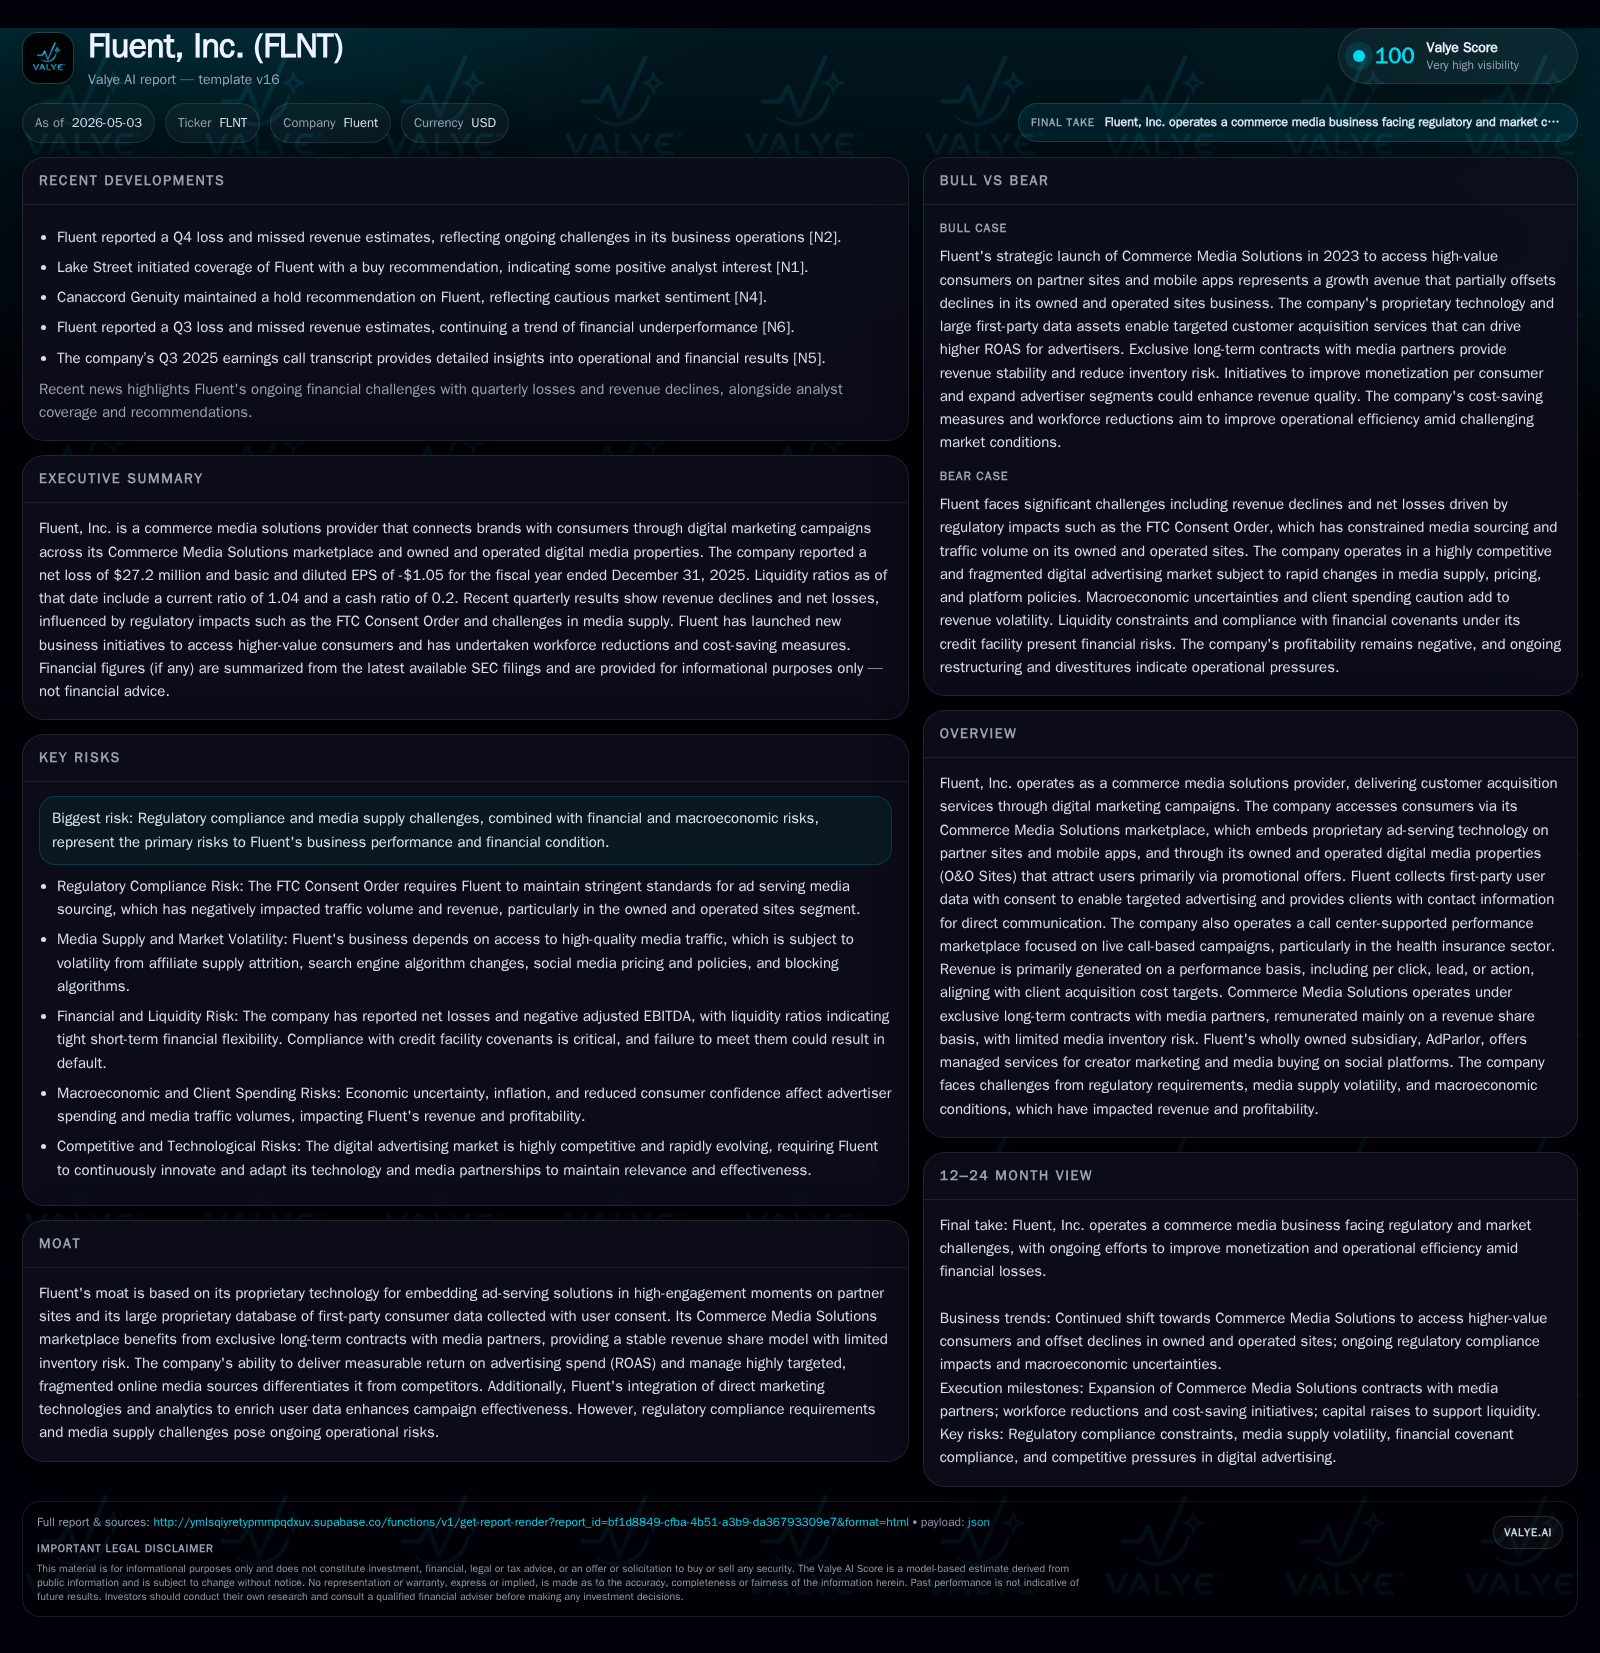
Fluent, Inc., a commerce media solutions company specializing in digital customer acquisition through data-driven marketing, experienced notable revenue declines and margin pressure through 2025 amid persistent media supply uncertainties on its owned & operated properties. Its core Commerce Media Solutions marketplace, supported by proprietary ad-serving technology and a vast first-party consumer database, remains central to connecting brands with targeted consumers under exclusive long-term partner contracts. Despite operational challenges, Fluent continues progressing contract wins and technology adoption with enterprise partners. Key risks include regulatory compliance hurdles and macroeconomic impacts on client spending. The company's capital structure features a $20 million term loan plus revolving credit facility with manageable leverage but ongoing covenant sensitivities.
Recent Operating Update
Fluent's latest quarterly filing (Q3 ended September 30, 2025) revealed continued headwinds primarily linked to persistent uncertainty in media supply within its owned and operated (O&O) digital properties. Revenue for the quarter was down 27% year-over-year to $47.0 million [S2], while media margin contracted slightly to 27% of revenue from 28% the prior year period [S22]. This contraction was driven by lower volumes caused by constrained inventory availability rather than pricing erosion per se.
Despite this environment, Fluent progressed well in expanding its Commerce Media Solutions platform adoption among enterprise partners during the current quarter [S2]. The company highlighted ongoing efforts to secure additional long-term contracts across its partner network. These contracts enable Fluent to embed its proprietary ad-serving technology into high-engagement moments in partner sites and apps under exclusive arrangements typically spanning one to five years [S2].
Management noted no direct impact from recent U.S. tariff or trade policy shifts but underscored general macroeconomic caution among clients and consumers weighing on marketing spend across sectors [S8]. Additionally, ongoing workforce reductions through early 2025 aim to right-size expenses in line with strategic priorities [S11].
An event filing in March 2026 reiterated these results with no material new operational disclosures beyond releasing unaudited full-year financials [S3]. The updated annual filing from April 2026 further clarifies senior management compensation is closely tied to adjusted EBITDA and media margin targets alongside strategic goals [S1].
Business Model
Fluent operates as a technology-enabled commerce media solutions provider focused on customer acquisition for advertisers via digital marketing campaigns. Revenue generation hinges primarily on performance-based outcomes—measured per click, lead, call, app download or other client-defined actions—allowing alignment with customer acquisition cost targets [S16].
The company's offerings are delivered through two main channels:
Commerce Media Solutions Marketplace: Proprietary technology embedded within third-party e-commerce websites and mobile applications enables Fluent to serve up targeted ads at high-engagement touchpoints (e.g., post-transaction). Partner agreements are generally long-term and remunerate partners on revenue shares or impression bases with limited inventory risk assumed by Fluent [S2][S16]. This model provides predictable gross profit streams while enabling advertisers efficient consumer reach.
Owned & Operated (O&O) Digital Properties: These platforms primarily attract consumers via promotional offers incentivizing engagement. Fluent collects first-party data directly from consenting users—including self-declared preferences—and monetizes this rich dataset by targeting these users on behalf of advertisers [S2]. This channel carries higher inventory risk but complements partner-sourced traffic.
Additionally, Fluent maintains a call center-supported performance marketplace emphasizing live voice campaigns mainly within health insurance verticals [S16]. This direct interaction model serves as a differentiated end-point for certain advertiser acquisition funnels.
Revenue mechanics pivot on volume and quality of consumer engagement—driven by successful traffic sourcing, offer relevance, targeting precision powered by proprietary machine learning models, and conversion efficiency. Margins depend strongly on media cost control relative to client fees collected plus scale effects realized through software automation.
Industry Structure and Competitive Position
Fluent operates within the highly fragmented digital advertising ecosystem focused on performance marketing for customer acquisition. Key competitive dynamics involve:
Access & Control Over Consumer Data: Fluent's moat derives significantly from its large proprietary first-party database obtained with explicit user consent—a valuable asset given increasing restrictions on third-party cookies industry-wide. This enables granular targeting unmatched by many competitors reliant solely on third-party sources.
Embedded Technology Integration: The ability to insert advertising experiences seamlessly at compelling moments (e.g., post-purchase) in partner ecosystems differentiates Fluent’s Commerce Media Solutions offering versus simpler display or social ad buys.
Long-Term Partner Contracts: Exclusive multi-year agreements underpinning stable revenue share models reduce inventory risk exposure relative to spot market buys prevalent among many platforms [S2].
Performance-Based Revenue Alignment: Being paid predominantly per action aligns Fluent's incentives closely with advertiser ROI goals enhancing client retention potential.
However, the sector faces structural pressures such as rapid shifts in privacy regulation (e.g., CCPA/CPRA equivalents), volatility in media inventory caused by platform policy changes or consumer behavior shifts, as well as evolving ad tech competition from integrated ecosystems like Google Ads or Facebook/Meta platforms which possess broader first-party data but less performance attribution granularity.
Growth Drivers
Growth hinges upon several vectors:
Expansion of Commerce Media Solutions Contracts: Scaling exclusive integrations on partner sites/applications can unlock incremental recurring revenue streams without proportional increases in media spend risk [S2].
Enhanced First-Party Data Monetization: Deepening user consent capture and enrichment via analytics can improve campaign targeting yield favorably impacting advertiser budgets allocated [S2].
Vertical Diversification: While health insurance call campaigns remain important, wider application across financial services, retail consumer goods, staffing & recruitment sectors opens larger addressable markets.
Technology Platform Enhancements: Ongoing investments in automation, machine learning-driven segmentation, real-time bidding optimizations support cost effective scaling of campaigns [S29].[S28]
Cost Rationalization & Operating Leverage Realization: Continued workforce alignment coupled with digital platform efficiencies could reduce incremental marginal costs improving adjusted EBITDA margins over time [S11].
Risks / Watchpoints / Growth Constraints
Media Supply Headwinds: Limited advertising inventory availability on O&O Sites depressing volumes illustrates vulnerability if alternate sourcing initiatives lag or partner terms are unsettled [S2].
Regulatory Compliance: Increasing scrutiny surrounding data privacy laws raises operational complexity especially regarding first-party data collection/use protocols. Non-compliance risks fines or impaired platform trust.
Macroeconomic Pressures: Client budget caution linked to inflationary pressures or consumer confidence fluctuations may constrain marketing spend impacting fluent’s campaign volumes or pricing power [S8].
Financial Covenant Sensitivities: Although current leverage ratios stand managed ($34.2 million debt vs $12.9 million cash end FY25; net debt approx $21.3 million) [F1], covenant thresholds require ongoing attentiveness particularly amid losses dampening retained earnings cushions [S4][S5][F1].
Competitive Landscape Intensity: Competition from integrated giants or emerging independent ad tech providers poses constant threat necessitating continuous innovation investment.
What To Watch Next
Key upcoming milestones include:
- Quarterly releases detailing revenue trajectory alongside metrics like media margin percentages will illuminate inventory recovery or persistent constraints.
- Disclosure regarding new multi-year Commerce Media Solutions partner deals would evidence progress broadening stable contract base.
- Adjusted EBITDA trends will indicate whether cost controls adequately offset revenue pressures.
- Operating cash flows improvements signaling better working capital cycle management are vital given recent net cash used still negative [$4.3 million YTD Sept '25] [S7][S9].
- Monitoring debt covenant compliance announcements against expected financing needs will signal capital resilience.
- Regulatory developments affecting consumer data usage permissions could materially alter operating practices requiring early adaptation.
Financial Profile Summary
Latest financial snapshot
| Metric | Value | Period |
|---|---|---|
| Cash & equivalents | $13mm | |
| 2025-12-31 | ||
| Total debt | $34mm | |
| 2025-12-31 | ||
| Net debt | $21mm | |
| 2025-12-31 | ||
| Current assets | $67mm | |
| 2025-12-31 | ||
| Current liabilities | $65mm | |
| 2025-12-31 | ||
| Current ratio | 1.04x | |
| 2025-12-31 |
Source: SEC companyfacts cache [F1].
Liquidity includes about $13 million in cash equivalents offsetting total debt around $34.2 million predominantly consisting of a $20 million term loan plus revolving credit facility expiring in April 2029 bearing interest above 10% currently due to SOFR floors plus applicable margins [F1][S4][S5][S6]. The current ratio stands near unity at approximately 1.04 indicating tight working capital positioning but not critical distress at present [F1].
Continued loss generation underscores the importance of scaling profitable customer acquisition outcomes paired with disciplined capital management to achieve sustainable financial health.
Disclaimer: This analysis is based solely on publicly available SEC filings and news disclosures as referenced. It does not constitute investment advice but aims to provide an informed industry-level evaluation grounded in disclosed operational and financial facts.
Disclaimer: This is research-only, informational analysis and not investment advice. It may include AI-generated interpretation and general industry context. Always verify important details using primary sources.
Comments