
Forian Inc.’s Analytics Edge Amid Corporate Transition and Expanding Product Suite
Recent merger and redomiciliation empower Forian’s growth in healthcare, life sciences, and financial services data analytics.
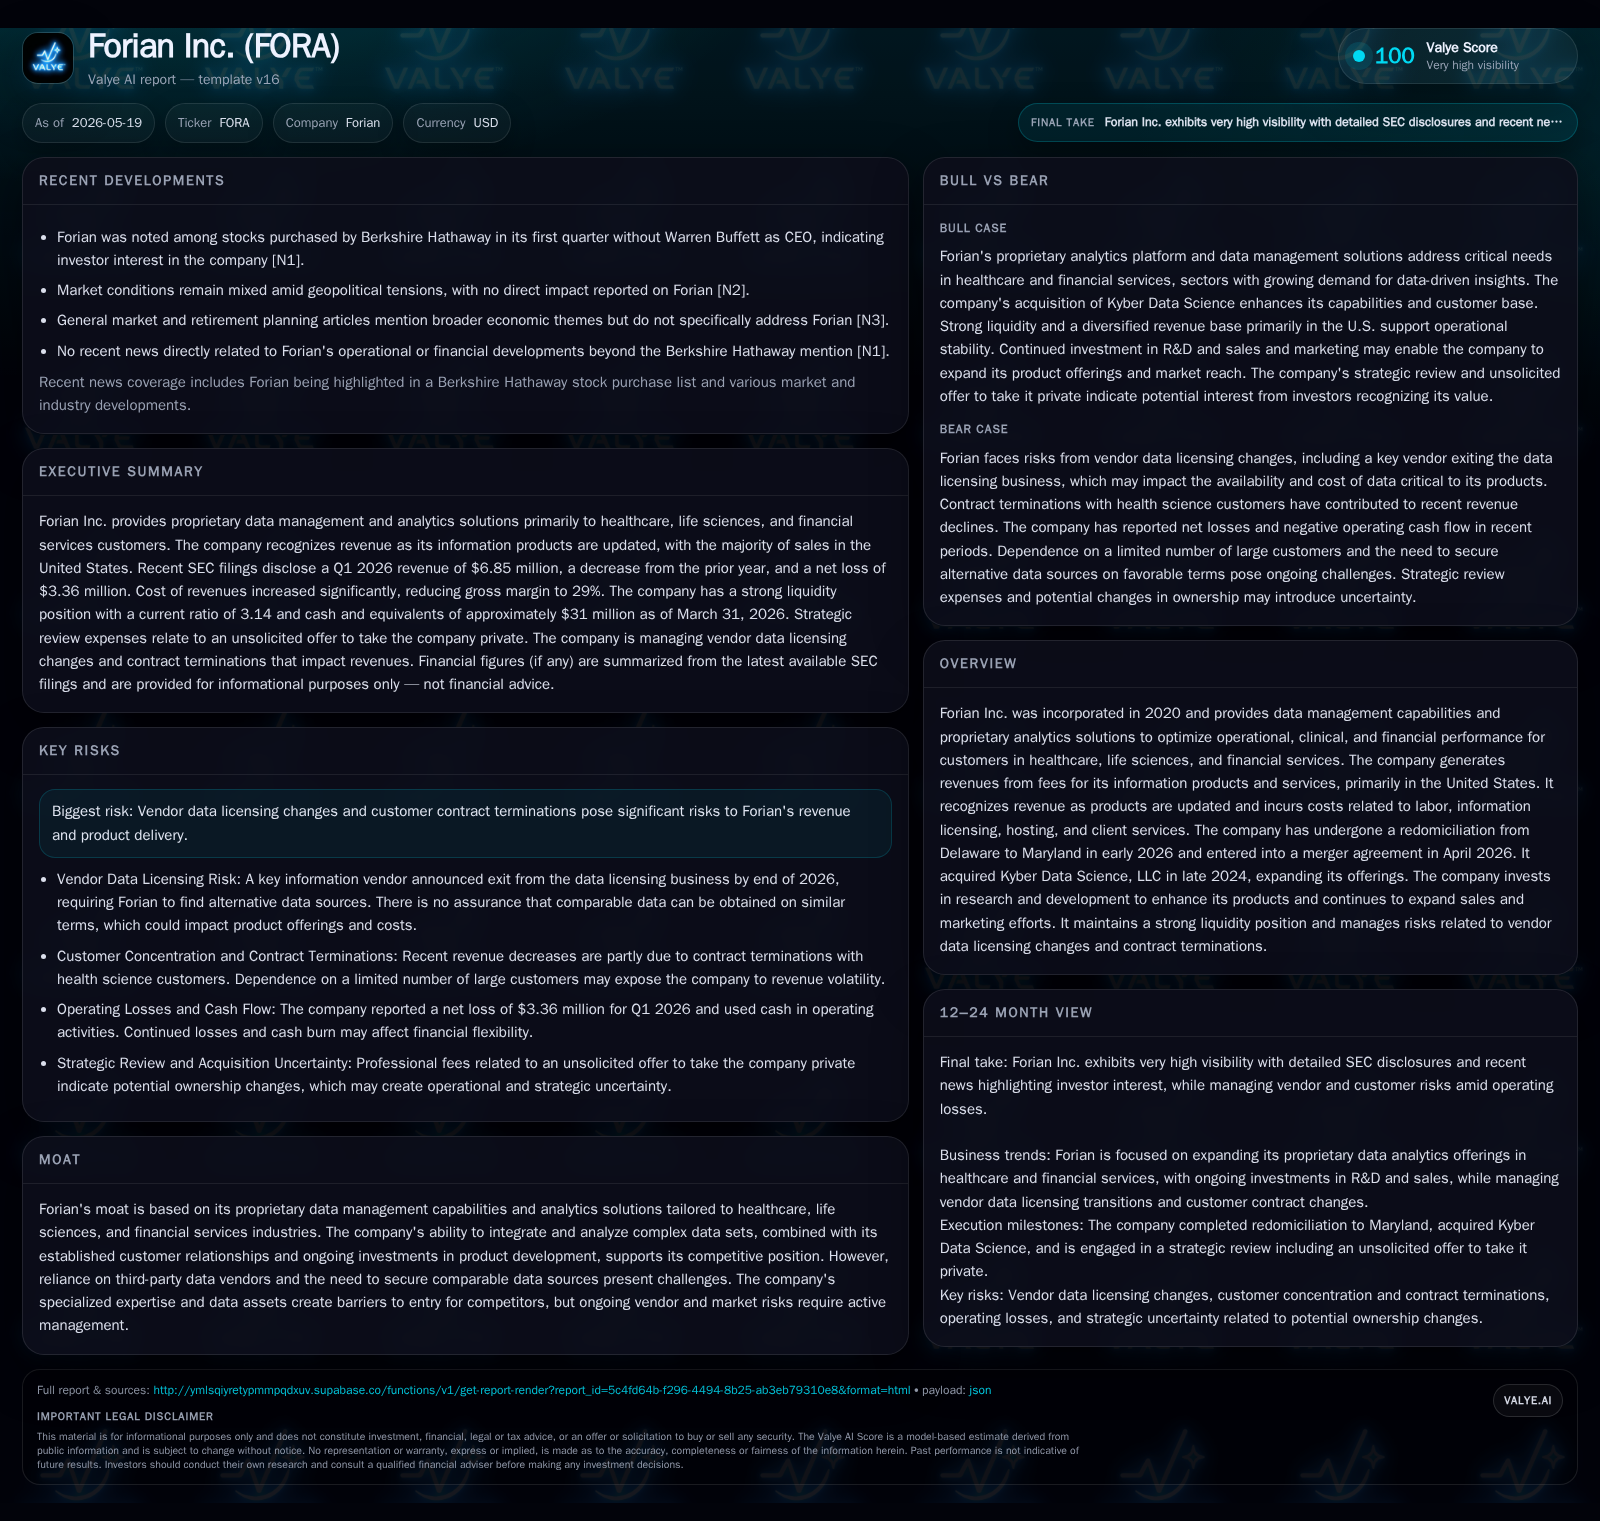
Forian Inc. completed a significant merger in April 2026 and redomiciled from Delaware to Maryland earlier that year, both moves designed to streamline corporate structure without disrupting operations. The company’s core business centers on proprietary data management and analytics products serving regulated verticals including healthcare and financial services. Growth is fueled by the 2024 acquisition of Kyber Data Science and ongoing investments in R&D and sales expansion. Vendor dependency and customer contract risks remain key headwinds to monitor as Forian integrates these strategic changes while sustaining revenue momentum.
Q1 2026 Operating Update: Merger Completion and Redomiciliation Effects
In the latest quarterly filing dated May 15, 2026, Forian Inc. disclosed the completion of a strategic merger executed on April 2, 2026, whereby it became a wholly owned subsidiary of a newly created parent entity controlled by Bravo Purchaser, Inc [S2][S3]. This structural transaction does not appear to interfere with daily operations or disrupt existing customer relationships or contracts, signaling a well-managed transition aligned with long-term strategic objectives
Complementing this move was a January 9, 2026 redomiciliation from Delaware to Maryland via statutory conversion [S2]. The company confirmed that this change affected only its corporate registration without altering operational footprints, workforce size, contractual rights, or financial obligations beyond one-time transaction costs. Such redomiciliation may be motivated by regulatory or organizational optimization under Maryland law, but importantly it preserves all existing material contracts' validity
These corporate developments anchor a transformative phase for Forian but maintain business continuity, setting the stage for leveraging newly rationalized structures and ownership toward growth execution.
Core Business Model and Product Suite Overview: Data Management and Proprietary Analytics
Forian’s revenue model hinges on fees charged for proprietary information products and tailored analytics solutions targeted at three main verticals: healthcare, life sciences, and financial services [S1][S2]. Revenue recognition aligns with product update cycles rather than licensing snapshots, emphasizing continual content enhancement as the revenue driver
The company’s suite includes data management platforms that integrate voluminous third-party licensed datasets with advanced analytics capabilities designed to optimize clinical outcomes, operational efficiencies, and financial performance for customers constrained by regulatory oversight and complexity in their respective domains.
To sustain competitive advantages within these demanding fields, Forian invests heavily in research & development aimed at enriching product features and expanding applications—a strategy augmented by the late-2024 acquisition of Kyber Data Science which broadened analytic offerings particularly in predictive modeling techniques relevant across its industries served [S1][S2]
Cost pressures largely derive from labor (specialized technical personnel), fees for external information licensing critical to dataset comprehensiveness, hosting infrastructure expenses reflecting cloud or hybrid environments supporting scalable deployments, and client service organization costs responsible for retention and customization.
This hybrid model leveraging proprietary tooling blended with licensed content creates specialized switching costs for customers reliant on comprehensive integrated insights difficult to replicate elsewhere.
Competitive Environment: Peer Context and Industry Structure
The ecosystem is characterized by high dependency on upstream third-party data vendors whose licensing terms directly influence product availability and cost structure—an inherent supply chain feature shaping competitive dynamics.
Customer concentration risks are moderated somewhat by focused vertical diversification between healthcare/life sciences and financial services, though U.S.-centric sales (99% reported recently) signal geographic concentration.
Pricing power is nuanced: specialized offerings tailored per compliance requirements command premium fees; however, pricing remains vulnerable to contract negotiations typical in enterprise B2B SaaS/data licensing markets.
Switching costs derive mainly from integration complexity across heterogeneous internal client systems combined with the effort required to reestablish validated analytics under alternate providers—thus reinforcing modest client stickiness once adoption passes initial stages.
Regulatory overlay across target verticals necessitates ongoing updates which materially influences roadmap prioritization compared to less-regulated sectors.
Expanding Growth Catalysts: Acquisitions, R&D, and Sales Momentum
The acquisition of Kyber Data Science in late 2024 serves as a cornerstone catalyst extending Forian’s analytic depth particularly through enhanced machine learning models applicable across its core industrial customers. This inorganic move complements organic growth driven by augmenting sales force capacity and marketing initiatives outlined in the annual report.
Incremental sales expenditures focus on recruiting skilled sales professionals alongside investment in brand awareness campaigns via market research events such as trade shows—critical channels for building credibility within conservative healthcare/financial buyer segments resistant to rapid vendor change [S1]
R&D expenditures have risen notably post-Kyber transaction reflecting integration efforts alongside ongoing platform innovation—both essential to remain ahead amid technologically dynamic peer landscapes.
Together these vectors form an ecosystem where new feature launches combined with deeper penetration into existing accounts augur sustainable demand expansion. However, supply-side factors like vendor negotiations over data access directly influence attainable scale feasibilities.
Risks and Constraints: Vendor Dependencies and Contract Renewal Uncertainties
Foremost among Forian’s risk exposures is its reliance on third-party licensed data vendors whose abrupt contract termination or licensing fee escalations could materially impair product continuity or cost efficiency. Historical experience recounts vendor terminations prompting unplanned cost adjustments affecting gross margins—a volatility factor underscoring the fragility intrinsic to external data dependency [S1][S2].
Customer contract renewal risks also play a central role given subscription-fee revenue profiles typical of SaaS-like models compounded by sector-specific budgeting cycles often impacted by economic and regulatory shifts.
Scaling challenges include balancing expansion-driven operating expense increases against achievable revenue growth while preserving margin thresholds necessary for long-term viability.
Vendor negotiation dynamics represent an ongoing constraint requiring agile contract management strategies paired with secondary sourcing capabilities where feasible.
Key Indicators to Monitor: Integration Milestones and Revenue Expansion Signals
Following April’s merger closure, attention should focus on successful integration progress particularly cultural alignment in leadership ranks (signaled by board resignations/reappointments per proxy disclosures), system consolidation near-term execution milestones detailed in forthcoming quarterly updates.
Client retention can also be tracked via revealed backlog figures or contractual renewal announcements typically embedded within MD&A narratives while new product feature release timelines serve as indicators for pipeline health influencing prospective revenue gains.
Management guidance updates post-merger will offer forward-looking insights critical to understanding synergy realization timing windows impacting EBITDA trajectories.
Marketing funnel expansion metrics expressing booked contracts or leads generated at industry events would further contextualize sales momentum beyond raw revenue numbers highlighted previously.
Supporting Financial Overview: Liquidity and Profitability Snapshot
At quarter-end March 31, 2026, Forian held approximately $31 million in cash and cash equivalents alongside strong current assets totaling about $37.4 million relative to current liabilities near $11.9 million yielding a healthy current ratio exceeding 3x indicative of robust short-term liquidity cushioning integration-related expenses [F1][S2]
Notably absent is recorded debt burden providing operational flexibility absent refinancing risk exposure [F1]. Nevertheless profitability remains challenged evidenced by recent annual net loss exceeding $2.8 million driven largely by elevated cost structures tied to acquisitions, R&D expansion, and sales scaling efforts typical in growth-stage tech-enabled information service firms
Gross margins showed pressure consequent to increased information licensing costs post-Kyber acquisition highlighting the delicate balance between incremental revenue contribution versus expense inflation experienced recently [S1]
Overall financial posture supports an investment-phase operating model reliant on capital deployment toward capability enhancement while seeking scale economies expected over medium terms following full synergy capture post-merger completion.
Disclaimer: This analysis is based solely on public filings cited herein without extrapolation beyond disclosed facts. It is intended strictly for informational purposes without any research view regarding securities.
Disclaimer: This is research-only, informational analysis and not investment advice. It may include AI-generated interpretation and general industry context. Always verify important details using primary sources.

Comments