
First Merchants Boosts Fee Income Amid Acquisition-Driven Expense Growth
Q2 2026 results highlight strong loan growth and fee income gains offset by rising expenses from First Savings acquisition integration.
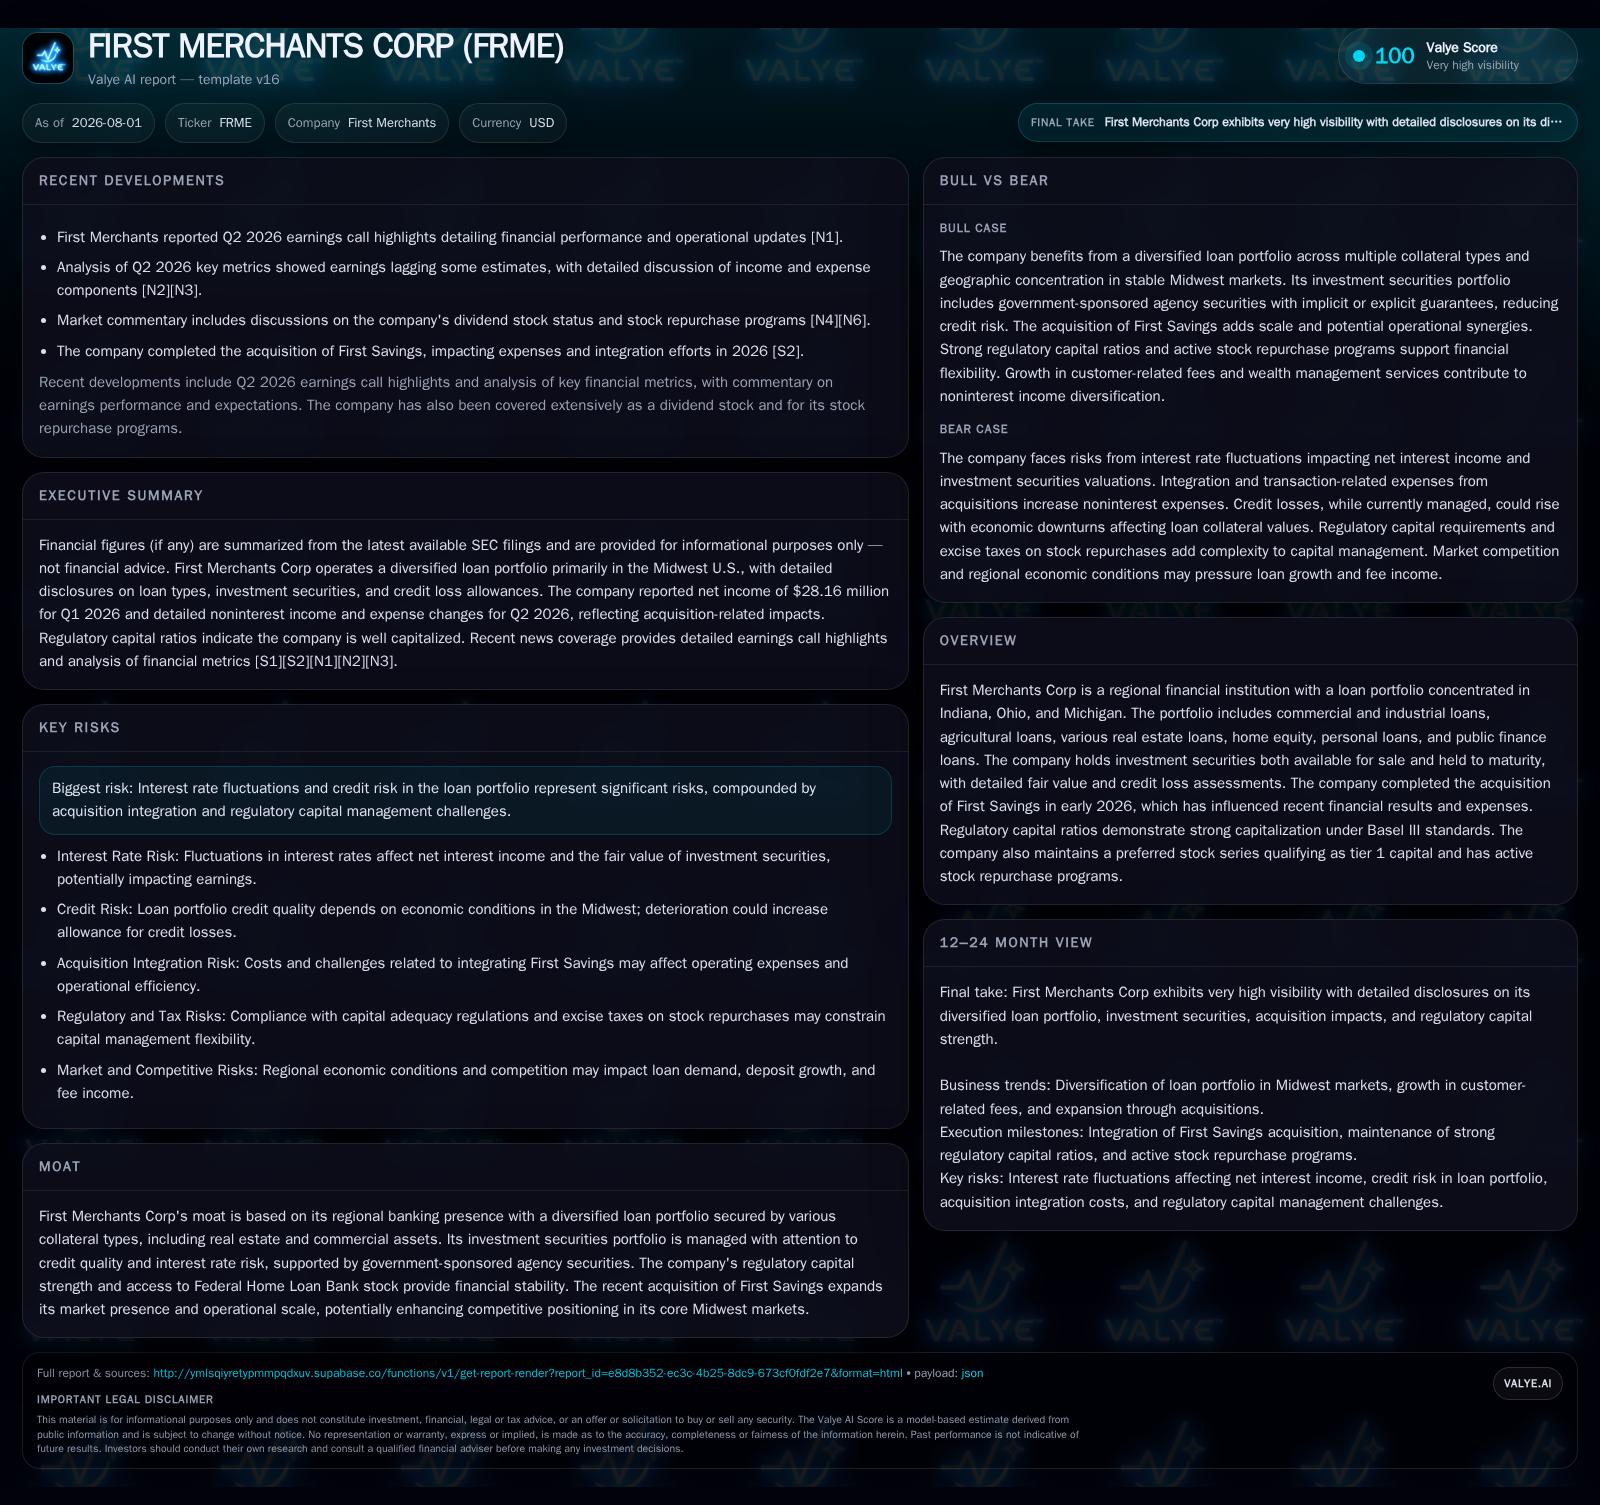
First Merchants Corp reported a $1.7 billion loan portfolio expansion at June 30, 2026, reflecting robust regional lending activity but accompanied by a rise in credit loss allowance to 1.56% of loans. Noninterest income grew notably, driven by higher customer fees including loan sales and wealth management, partially mitigating pressure from a large noninterest expense increase tied to acquisition-related integration costs. The company’s tangible common equity ratio of approximately 9% signals solid regulatory capital despite short-term margin challenges. Continued deposit base stability and Midwest economic momentum underpin growth opportunities amid typical risks related to credit quality and expense management.
Q2 Loan Portfolio Expansion Creates Both Growth Opportunity and Credit Risk Signals
In the second quarter of 2026, First Merchants Corp's loan portfolio excluding loans held for sale expanded substantially by approximately $1.7 billion from year-end 2025 levels, reaching $15.5 billion by June 30 [S2]. This growth confirms continued regional commercial lending activity across its core Midwest footprint—Indiana, Ohio, and Michigan—and underscores robust origination efforts following the First Savings acquisition earlier this year. However, this expansion coincided with an increase in the allowance for credit losses (ACL) on loans by $46 million to $241.6 million during the period. Measured as a percentage of total loans, the ACL rose from 1.42% at December 31, 2025, to 1.56% at mid-year [S2], reflecting heightened caution or recognition of incremental credit risk associated with rapid portfolio growth.
This ACL increase aligns with industry practice where expanding loan portfolios typically prompt portfolio risk reevaluation to maintain conservative provisioning levels. The moderate rise suggests management's disciplined credit underwriting approach is responsive to underlying borrower risk trends without signaling significant deterioration in asset quality at present. Given typical cyclicality in regional banking portfolios—especially those with exposure to commercial sectors sensitive to economic shifts—the trend warrants close observation alongside delinquency metrics as confirmation whether asset quality remains stable or degrades.
Rising Noninterest Expenses Driven by Acquisition Integration Challenge Efficiency Gains
Noninterest expense surged by over $21 million (23%) year-over-year to $115.3 million in Q2 2026, reflecting both organic cost increases and substantial acquisition-related integration expenses stemming from the recent First Savings deal [S2]. Salaries and employee benefits grew sharply by $11.2 million alone due to adding headcount and related costs from the acquired entity.
Beyond compensation, several other expense categories contributed incremental cost burdens: equipment expenses (+$1.7 million), net occupancy (+$1.4 million), professional services (+$1.2 million), intangible asset amortization (+$1.2 million), other real estate owned (+$1 million), and miscellaneous increases including a write-down on a held-for-sale building and travel cost rise totaling an additional ~$1.6 million [S2]. For the first half of 2026, integration- and transaction-related charges tallied $20.8 million—comprising severance and contract termination ($10.7 million), salaries/benefits ($5.8 million), advisory fees ($3 million), and miscellaneous ($1.3 million)—identifying one-time cost layers pressuring near-term efficiency ratios.
This profile closely parallels acquisition patterns observed among peers such as Fifth Third Bancorp and KeyCorp that also face elevated expense ratios during post-deal integration phases before realizing expected scale economies [S1,S2,S3]. It highlights the importance for First Merchants to execute disciplined cost controls while driving revenue synergies to offset these temporary margin headwinds.
Fee Income Growth Provides Partial Offset Through Diversification Beyond Interest Margins
Amid pressures on net interest margins driven by balance sheet expansion costs and competitive funding conditions, First Merchants recorded strong noninterest income growth—a strategic diversification pillar—with total fees increasing nearly 19% year-over-year in Q2 to $37.2 million [S2]. The driver was primarily customer-related fees gaining $4.8 million over prior year period to $34.3 million.
This fee improvement stemmed largely from multiple sources: higher net gains on sales of loans (+$1.9 million), rises in fiduciary and wealth management fees (+$0.8 million), increased service charges on deposit accounts (+$0.8 million), and boosted card payment fees (+$0.6 million) [S2]. These streams reflect First Merchants’ ongoing emphasis on cross-selling wealth management products alongside traditional lending offerings as well as leveraging its broad deposit franchise through value-added payment services.
While noninterest income declined materially year-over-year for the full six months due chiefly to a substantial net loss related to mortgage loans held-for-sale—marked down before being sold during Q2—the underlying sustainable customer fee growth signals resilience amid mortgage market volatility [S2]. This balance between volatile mortgage-related items versus stable fee sources is characteristic among regional banks expanding noninterest revenue streams for more balanced earnings bases.
Competitive Landscape: How First Merchants Compares Within Regional Banking Expansion Trends
First Merchants' recent acquisition activity reflects a common strategy among regional banks aiming for scale enhancement headlined by entities like Fifth Third Bancorp and KeyCorp also operating within similar Midwest geographies [S1,S2,S3]. These peers pursue complementary acquisitions targeting expanded customer bases while navigating near-term profitability compression due to integration costs.
The deposit competition within these markets remains intense among community banks, thrifts, credit unions, and alternative lenders challenging pricing power on core deposits—a key funding source that directly influences net interest margin sustainability [S1]. Managing operating expense growth is equally vital given margins are already squeezed by elevated interest expenses on liabilities such as money market accounts and wholesale borrowings.
First Merchants' tangible common equity ratio near nine percent under Basel III regulatory standards positions it well relative to capital thresholds necessary for strategic flexibility compared with many peers balancing growth aspirations against regulatory demands [S2].
Growth Drivers: Regional Economic Momentum and Cross-Selling Opportunities After Acquisition
The company’s core markets benefit from generally steady Midwest economic activity supporting commercial loan demand—a primary segment within its diversified loan book that includes agricultural loans, real estate financing across retail/commercial/residential segments, plus consumer loans such as home equity lines [S1,S2]. Economic growth fosters business expansions that drive loan originations while simultaneously elevating deposit inflows through payables linked to growing enterprises.
Acquisition benefits extend beyond scale by deepening client relationships hence enabling enhanced penetration of fee-generating services including fiduciary offerings, wealth management solutions, payment processing cards, and retail deposit products—all contributing to improved revenue mix beyond interest income alone [S2]. Cross-selling these products remains critical given pressure on traditional lending spreads amid competitive funding landscapes.
Risks from Credit Quality, Expense Inflation, and Regulatory Capital Management Demand Close Monitoring
The annual filing disclosed risk themes pertinent for assessment: potential adverse effects from infectious disease outbreaks or economic slowdowns within its operating regions could depress collateral values or elevate delinquencies; cyclical shifts affecting commercial real estate valuations; provisioning adequacy amidst evolving credit trends; wage inflation impacting operating efficiency; cybersecurity risks; alongside ongoing scrutiny from regulatory authorities concerning capital adequacy under Basel III frameworks [S1].
Rising allowance for credit losses suggests management’s proactive stance toward current portfolio risk but also flags sensitivity needing vigilant monitoring especially if macroeconomic headwinds materialize more severely than anticipated.
Integration complexity adds another layer of execution risk—increased expenses incurred during mergers require effective synergy capture plans or else strain profitability targets aligned with shareholders' expectations.
Upcoming Catalysts: Key Milestones in Integration Progress & Earnings Guidance Signals
The July 22 event filing highlighted forthcoming investor communication initiatives including an earnings webcast shortly after quarter’s end alongside presentation materials designed to update stakeholders on operational performance factors post-acquisition [S3,N1].
Market focus likely centers on clarity regarding realization pace of cost synergies embedded within integration expenses reported thus far; trajectory for normalized efficiency ratios; pipeline development around loan sales; sustained momentum in fee businesses particularly wealth management; plus any emerging signals related to asset quality trends amid shifting economic conditions.
These milestones will be critical for calibrating expectations about First Merchants’ medium-term earnings outlook as it balances growth ambitions against transitional margin impacts inherent in such acquisition phases.
Financial Profile Discussion: Strong Capitalization Supports Operating Expansion but Margin Pressure Persists
Tangible common equity to tangible assets ratio measured near 8.99% at June-end provides solid regulatory capital support amidst rapid balance sheet scaling driven by loan growth and acquisition assimilation [S2]. This metric implies resilience relative to Basel III minimums commonly required by regional banking supervisors allowing strategic deployment of capital towards earning assets while maintaining prudent buffers against credit shocks.
Despite robust top-line increases—including net interest income boosted by volume growth—the sharp hike in noninterest expenses pushes efficiency metrics lower temporarily due mostly to integration outlays characteristic of similar-sized peers pursuing acquisitions [S2]. Continuous liquidity provision derives chiefly from the stable core deposit base which is critical given industry-wide competition intensifies around deposit retention pricing power.
Disclaimer: This is research-only, informational analysis and not investment advice. It may include AI-generated interpretation and general industry context. Always verify important details using primary sources.

Comments