
Six Flags’ 2025 Losses Reflect Merger Integration Strains and High Fixed Costs
Six Flags’ expanded park portfolio drives revenue growth but operating and financial challenges persist post-merger.
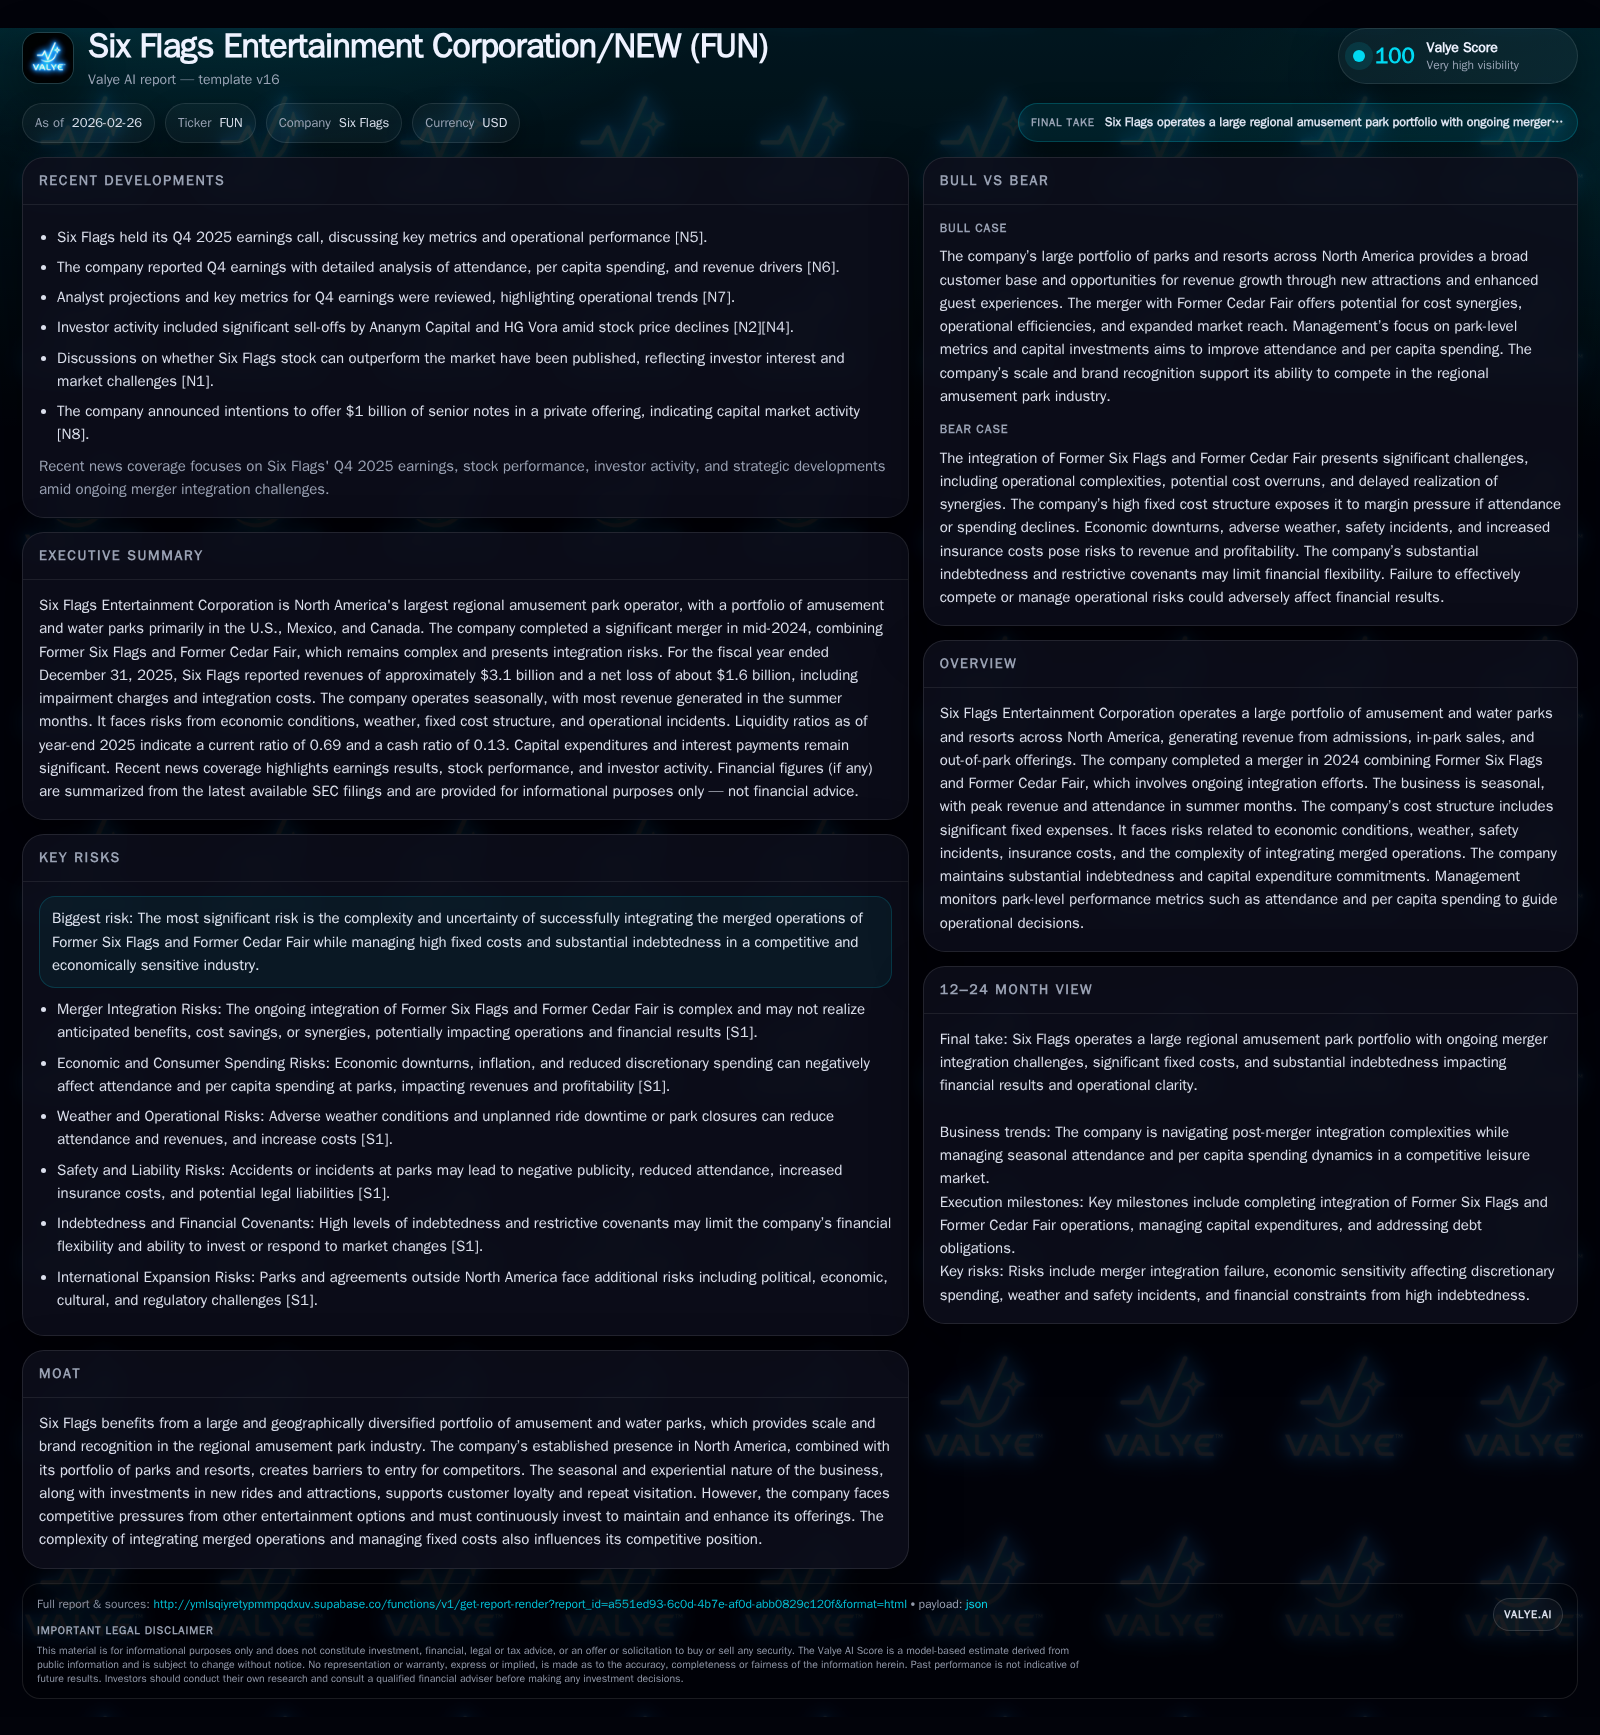
Six Flags Entertainment Corporation reported a 14.4% revenue increase to $3.1 billion in 2025, driven by the merged portfolio of former Six Flags and Cedar Fair parks. However, the company faced significant operating losses totaling $1.375 billion and a net loss nearing $1.6 billion, largely due to merger integration expenses, elevated fixed costs, and lower attendance affected by weather events. Operating cash flow declined by 12%, while capital expenditures surged as management invests in park upgrades to support future growth. With substantial indebtedness above $5 billion, Six Flags focuses on operational improvements and balance sheet strength, but risks from integration complexity and economic sensitivity remain significant.
Historical Performance: Growth Driven by Merger but Profitability Pressured
Six Flags Entertainment Corporation emerged mid-2024 via a merger of Former Six Flags with Cedar Fair, creating North America’s largest regional amusement park operator encompassing 41 venues—26 amusement parks, 15 water parks—and nine resorts primarily located in the U.S., with additional sites in Canada and Mexico [S1][S9]. This combination aims to leverage scale for improved guest experience and accelerated capital investment.
For fiscal year 2025, the combined entity delivered revenues of approximately $3.1 billion representing a 14.4% increase over the prior consolidated period ($2.71 billion in 2024), driven by the expanded footprint and higher per capita spending following integration efforts [F1][S24]. Seasonality remains pronounced with about 70% of revenue generated during peak summer quarters (Q2 and Q3), underscoring sensitivity to timing and weather impacts notably during Q2 of 2025 [S9][N1].
However, operating income swung sharply negative to a loss of $1.375 billion from positive operating income of roughly $311 million the previous year—a change primarily due to substantial merger-related costs including consulting fees, system integration expenses, retention bonuses, park upgrades for unified branding standards, restructuring severance charges, and goodwill impairment linked to the business combination [F1][S21]. Net income likewise deteriorated to a loss near $1.6 billion compared with a $231 million loss in the prior year reflecting these factors plus elevated interest expense amid high debt levels [F1][S21].
Operationally, cash flow from operations totaled $327 million in 2025—a decline of approximately 12% from the prior year—reflecting weaker earnings partly offset by working capital improvements including timing shifts in tax payments [F1][S14]. Capital expenditures surged roughly 67%, attributed to investments upgrading rides, attractions, safety infrastructure, technology systems modernizations such as guest communications platforms, and general maintenance aligned with competitive positioning across the expanded portfolio [F1][S14]. Free cash flow after capex remained positive at about $213 million despite these investments [F1], which management views as essential for long-term growth.
Annual Financial Summary
Historical performance (annual)
| FY | Rev ($bn) | Net ($mm) | CFO ($mm) | OpInc ($mm) | Rev YoY | Net YoY |
|---|---|---|---|---|---|---|
| 2025 | 3.1 | -1599 | 327 | -1375 | +14.4% | -591.8% |
| 2024 | 2.7 | -231 | 373 | 311 | ||
| 2023 |
Source: SEC companyfacts cache [F1].
Capital returns and efficiency (annual)
| FY | Buybacks ($mm) | ROE% |
|---|---|---|
| 2025 | 75 | -290.9 |
| 2024 | 75 | -11.3 |
| 2023 |
Source: SEC companyfacts cache [F1].
*Capex figures annualized/approximated based on mid-year snapshots for comparability.
Future Growth Prospects: Operational Focus Amid Integration Complexity
Post-merger priorities emphasize profitability through guest value enhancement that stimulates demand alongside disciplined cost control across labor, marketing spend, utilities, insurance, and maintenance expenses [S24][N2]. Management aims to simplify product offerings including ticketing structures; optimize pricing per park reflecting local markets; tailor marketing campaigns using data analytics for targeted engagement; and leverage procurement scale economies amid inflationary pressures affecting ride components sourced internationally [S24][N12].
Capital allocation focuses on efficiency gains coupled with reinvestment within high-performing assets while reviewing portfolio composition to divest underperforming or non-core properties—balancing risk exposure from ongoing Partnership Park arrangements extending through at least 2028—and improving cash flow resilience against consumption cyclicality [S19][S29].
Weather volatility remains a key risk given concentrated sales seasonality; disruptions during peak summer or fall periods disproportionately affect quarterly results due to high fixed-cost leverage inherent in park operations—wages (including unionized staff), maintenance contracts, utilities—constraining margin expansion even with attendance recoveries [S9][N11]. Ongoing integration challenges require harmonizing IT platforms previously disparate between Former Six Flags and Cedar Fair alongside workforce rationalizations which may temper short-term productivity amid transformation efforts [S16][N1].
Earnings Milestones & Market Expectations
The company has not provided explicit recent guidance beyond broad operational priorities; forward-looking monitoring should focus on quarterly attendance trends segmented by ticket type (single-day tickets vs season passes vs memberships), changes in per capita spending particularly on food/merchandise/games inside parks influencing variable revenue streams beyond admission receipts, capex pacing against flagship ride installations or major refurbishments scheduled for upcoming seasons [N3][N1]. Progress on integration synergy realization—including administrative overlap reductions—and margin trajectory relative to inflationary factors and consumer spending patterns will be critical milestones.
Returns & Capital Allocation: Debt Burden Limits Flexibility
Equity stood near $550 million at December end contrasted against outstanding indebtedness exceeding $5 billion (pre-reduction for issuance costs), reflecting substantial financial leverage that constrains flexibility especially under covenants limiting dividends or additional debt issuance until leverage ratios improve—the latter subject to step-downs over coming years pending operational stabilization [F1][S13][S7]. Recent refinancing replaced higher coupon near-term notes with longer-dated senior unsecured bonds maturing in 2032 easing immediate liquidity pressure but increasing interest expense impacting net results this cycle [S6][F1].
Share repurchases have been modest (~$75 million annually pre-merger disclosed levels) with no current dividend plans signaling management prioritizes debt reduction over shareholder returns until deleveraging progresses sufficiently [F1][S14]. The medium-term return capacity depends more on generating sustained free cash flow via operational improvements coupled with selective capex restraint than immediate capital returned via dividends or buybacks.
Industry Position & Competitive Considerations
The merged company holds leading scale among North American regional amusement providers benefiting from well-known brands across geographically diverse locations offering barriers to entry via entrenched customer loyalty driven by themed entertainment experiences anchored around signature rides and events like Halloween festivals extending seasonality beyond summer peaks.
Continuous investment required for new attractions supports repeat visitation though competition for discretionary leisure spending remains intense amid economic uncertainty affecting consumer budgets.
Risks Summary: Integration Execution & External Headwinds
Key risks include effective post-merger integration without disrupting customer experience or operations due to complex IT unification or cultural alignment challenges compounded by legacy contractual commitments under Partnership Parks potentially imposing capital burdens if financial tests fail necessitating remedial actions including possible asset dispositions or renegotiations tied to indebtedness covenants [S16][S19]. Failure could prolong cost overruns negating synergy benefits.
Additional risks:
- Rising wage rates mandated legally or competitively increasing labor costs,
- Weather volatility reducing attendance during peak periods,
- Increasing insurance premiums inflating fixed overheads,
- Cybersecurity threats risking guest data integrity,
- Litigation exposure notably regarding deceptive marketing allegations at Canada’s Wonderland pending late-2026 hearings,
- Labor union activities potentially causing strikes,
- Macroeconomic slowdown curbing discretionary consumer spending dampening visitation frequency and per capita spend.
Conclusion
Six Flags’ first full post-merger year showed promise from expanded scale driving healthy revenue growth but revealed significant challenges including costly integration that erased operating profit producing large net losses compounded by impairments amid inflationary supply pressures and adverse weather.
Continued strategic discipline targeting profitability enhancement alongside incremental capex supporting guest experience differentiation backed by data-driven pricing models is essential; geographic footprint diversity remains an asset appealing across demographic segments regionally.
Strong liquidity buffers via revolving credit availability plus recent refinancing provide runway amid caution warranted given heavy leverage limiting financial maneuverability absent earnings turnaround.
Upcoming quarters’ operational updates focusing on attendance metrics plus visible synergy progress amid risk mitigation will be key indicators toward sustainable profitability recovery.
Disclaimer: This is research-only, informational analysis and not investment advice. It may include AI-generated interpretation and general industry context. Always verify important details using primary sources.
Comments