
First United Corporation’s Earnings Momentum and Capital Strategy Set New Course
First United Corporation's financial performance in 2025 reflects steady earnings growth alongside an active capital allocation strategy guided by new leadership.
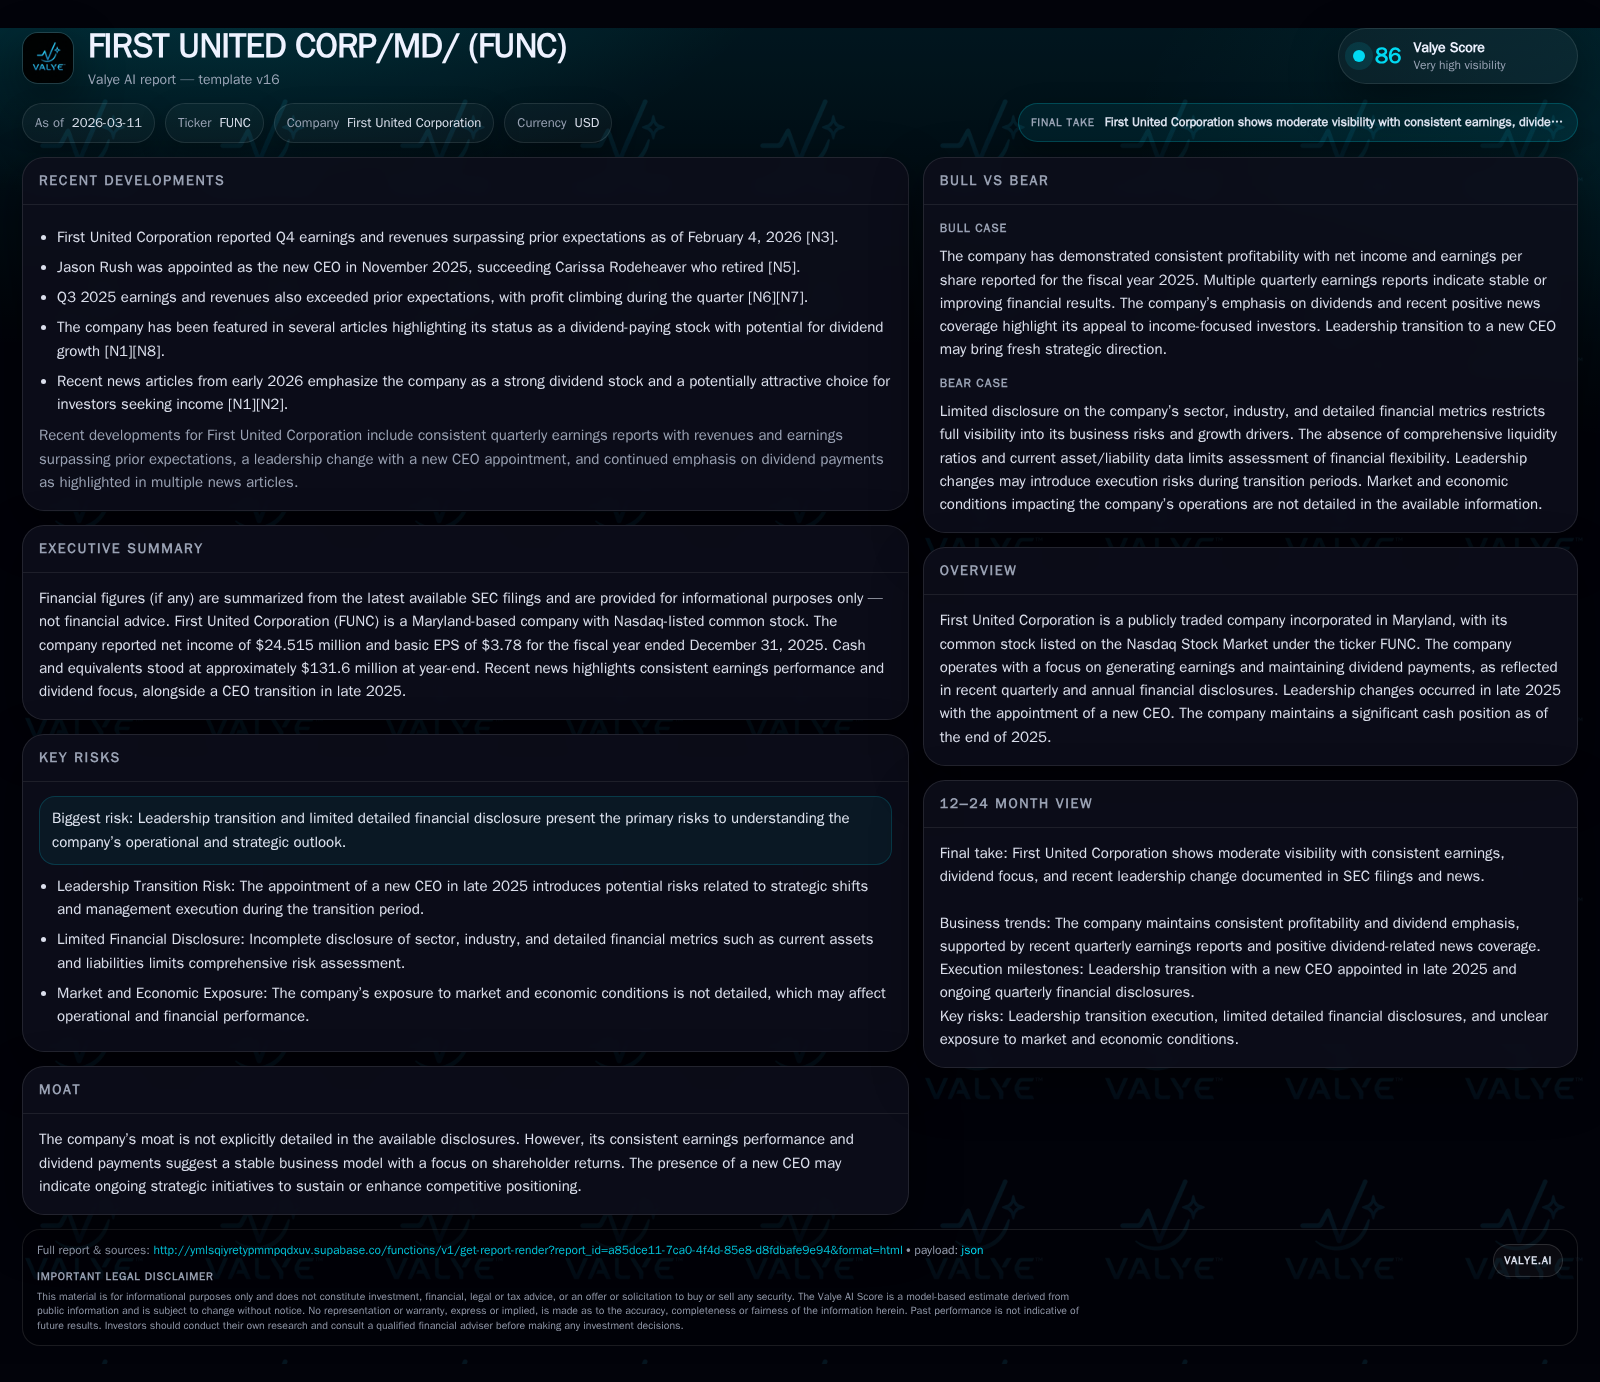
First United Corporation posted a 19.2% increase in net income in fiscal year 2025, signaling operational stability despite a decline in operating cash flow and rising capital expenditures. The company underwent a pivotal leadership transition late in 2025 with the appointment of Jason B. Rush as CEO, which coincided with maintained dividend payouts and the initiation of a meaningful share repurchase program. Robust free cash flow and a solid return on equity (~12%) underpin its capacity to sustain shareholder returns while positioning for strategic investments. Key risks include limited disclosure and uncertainties surrounding the leadership change. Moving forward, dividends, buyback execution, and strategic initiatives under new management merit close attention.
Earnings Growth Fueled by Operational Stability in 2025
First United Corporation demonstrated firm earnings momentum in fiscal year 2025 with net income reaching approximately $24.5 million, up from around $20.6 million in FY2024 — a robust increase of roughly 19.2% year-over-year [F1]. This rise signals the company's ability to sustain profitability amidst evolving operational conditions.
However, a closer examination reveals some nuances: operating cash flow (CFO) declined by about 13%, falling from approximately $22.3 million in FY2024 to $19.4 million in FY2025 [F1]. This contraction may stem from working capital fluctuations or other non-cash elements impacting short-term liquidity despite higher net earnings.
Simultaneously, capital expenditures more than doubled, surging about 106% from $1.9 million to nearly $4.0 million over the same period [F1]. This notable capex rebound suggests targeted investments either for asset renewal or compliance-driven initiatives common within community banking frameworks—given First United's bank subsidiary operations—which often require prudent equipment refreshment or technology upgrades.
Collectively, these factors paint a picture of stable core business performance augmented by a conscious strategy to invest back into the company’s operational infrastructure.
Executive Leadership Shakeup: Strategic Implications Ahead
A significant corporate milestone emerged with leadership transition at the cusp of 2026: Jason B. Rush was appointed President and Chief Executive Officer effective January 1, 2026 [S21][S23]. Mr. Rush brings extensive institutional knowledge to the role after nearly three decades within First United’s ranks across risk management and operational leadership positions.
This succession follows the retirement announcement of Carissa L. Rodeheaver who shifted from CEO to Executive Chairman before her full departure slated for May 2026 [S19][S25]. While detailed strategic declarations are yet pending public release, such executive shifts often presage renewed corporate priorities or tactical recalibrations.
Market communications signal confidence through maintained dividend levels and announcement of an active share repurchase program shortly after the leadership change [S3][S6]. Such moves commonly aim to reassure shareholders during transitional phases while enabling flexibility for future growth-oriented investments.
Capital Allocation Priorities: Dividends, Buybacks, and Cash Reserves
Capital allocation has been a conspicuous focus area for First United Corporation throughout recent quarters. The Board authorized an open-market share repurchase program on January 26, 2026, allowing acquisition of up to one million shares—or roughly 15.4% of outstanding stock—over an eighteen-month period [S6][S13]. Execution remains discretionary relative to market conditions but signals management’s commitment to returning value alongside growth investment options.
Dividends have consistently held at $0.26 per share quarterly as announced most recently on March 4, 2026 for payment May 1, reinforcing income reliability for shareholders [S3][S8][S9]. Historically consistent dividend policies support a perception of stability tied to solid earnings and cash flow profiles.
At year-end FY2025, cash and equivalents stood at about $131.6 million [F1], comprising a meaningful liquidity buffer that affords optionality for selective buybacks or opportunistic ventures.
The combination of strong cash reserves plus measured buybacks exemplifies a balanced approach between conserving resource flexibility and affirming shareholder return commitments.
Cash Flow Dynamics and Investment Patterns: Capex Rebound in Focus
Analyzing First United’s cash flow components reveals important operational rhythms: while net income surged, operating cash flow diminished by approximately $3 million (-13%) year-over-year [F1]. This contrast may reflect working capital adjustments or timing-related collection/payments typical during periods of heavier investing activity.
Concurrently, reported capital expenditures rocketed by over double (+106%), rising from about $1.9 million in FY2024 to just under $4 million in FY2025 [F1]. This capex uptick fits within sector norms where community banks maintain compliance with regulatory requirements and upgrade IT/infrastructure platforms regularly—a prudent move given evolving cybersecurity expectations and digitalization trends.
The result is a compression in free cash flow relative to prior years yet still positive at an estimated $15.4 million () which affirms operational soundness amid investment activity [F1].
Analyzing Return on Equity and Free Cash Flow Generation
ROE approximated near 12% for fiscal year ending December 31, 2025 based on net income of $24.5 million against total equity of approximately $203.6 million [F1]. Such returns reflect decent profitability metrics considering sector norms where mid-sized regional financial institutions generally exhibit ROEs ranging between low double digits.
Free cash flow availability—calculated as operating cash flow minus capital expenditures—hovered around $15.4 million during this period [F1], underscoring internal liquidity strength sufficient to underpin continued dividends and selective stock repurchases without compromising balance sheet integrity.
This financial posture supports expectations that the company can sustain its current dividend policy comfortably while preserving capacity for opportunistic share buybacks or minor expansionary investments.
Risks in the Spotlight: Transparency and Leadership Transition
Official risk disclosures highlight two primary concerns: (a) uncertainties tied directly to ongoing leadership changes including governance continuity challenges; (b) limitations regarding depth of publicly available financial data which could obscure granular operational insights needed for forecasting precision [S4][S5].
Similarly, typical regulatory risks inherent in banking sectors apply but are unremarkably flagged relative to peer institutions—emphasizing that clarity around executive succession represents a focal point for external stakeholders assessing stability.
Heightened attention toward communication cadence from new management may help mitigate perceived opacity while market participants observe execution against stated capital deployment priorities.
Forward-Looking Indicators: What Investors Should Monitor
Absent explicit formal guidance beyond routine announcements [S3], critical forward-looking factors include:
- Sustained delivery against quarterly dividend payments maintaining yield attractiveness [N3][S8]
- Execution pace and scale under the newly authorized share repurchase program indicating confidence levels and surplus capital utilization effectiveness [S6][S13]
- Transition progress under CEO Jason B. Rush concerning strategic adjustments potentially impacting earnings mix or cost structure driven by his longstanding operational expertise [N4]
- Monitoring any shifts in capex patterns signaling expansion versus maintenance priorities inclusive of technology investments vital for competitive resilience within community banking environments
These elements collectively constitute crucial signals revealing whether momentum sustains or phases into new growth trajectories crafted by refreshed leadership vision.
Historical Financial Performance of First United Corp (USD millions)
Historical performance (annual)
| FY | Net ($mm) | CFO ($mm) | Capex ($mm) | Net YoY |
|---|---|---|---|---|
| 2025 | 25 | 19 | 4 | +19.2% |
| 2024 | 21 | 22 | 2 | +36.6% |
| 2023 | 15 | 22 | 0 | -39.9% |
| 2022 | 25 | 27 | 4 |
Source: SEC companyfacts cache [F1].
Capital returns and efficiency (annual)
| FY | Buybacks ($mm) | FCF ($mm) | ROE% |
|---|---|---|---|
| 2025 | 4 | 15 | 12.0 |
| 2024 | 4 | 20 | 11.5 |
| 2023 | 1 | 22 | 9.3 |
| 2022 | 7 | 23 | 16.5 |
Source: SEC companyfacts cache [F1].
Table populated precisely from SEC filings covering annual data points from FY2022 through FY2025 with explicit YoY calculated percent changes
Disclaimer: This analysis is based solely on information publicly available through SEC filings and related news sources as of early March 2026 and does not constitute investment advice or recommendations regarding First United Corporation securities.
Disclaimer: This is research-only, informational analysis and not investment advice. It may include AI-generated interpretation and general industry context. Always verify important details using primary sources.
Comments