
Genesco Reports 3.3% Sales Growth but Margin Pressures Persist Amid Tariff and Retail Headwinds
Q3 Fiscal 2026 shows Journeys Group sales gains offset by Schuh declines and margin compression driven by tariffs, store restructuring, and promotional activity.
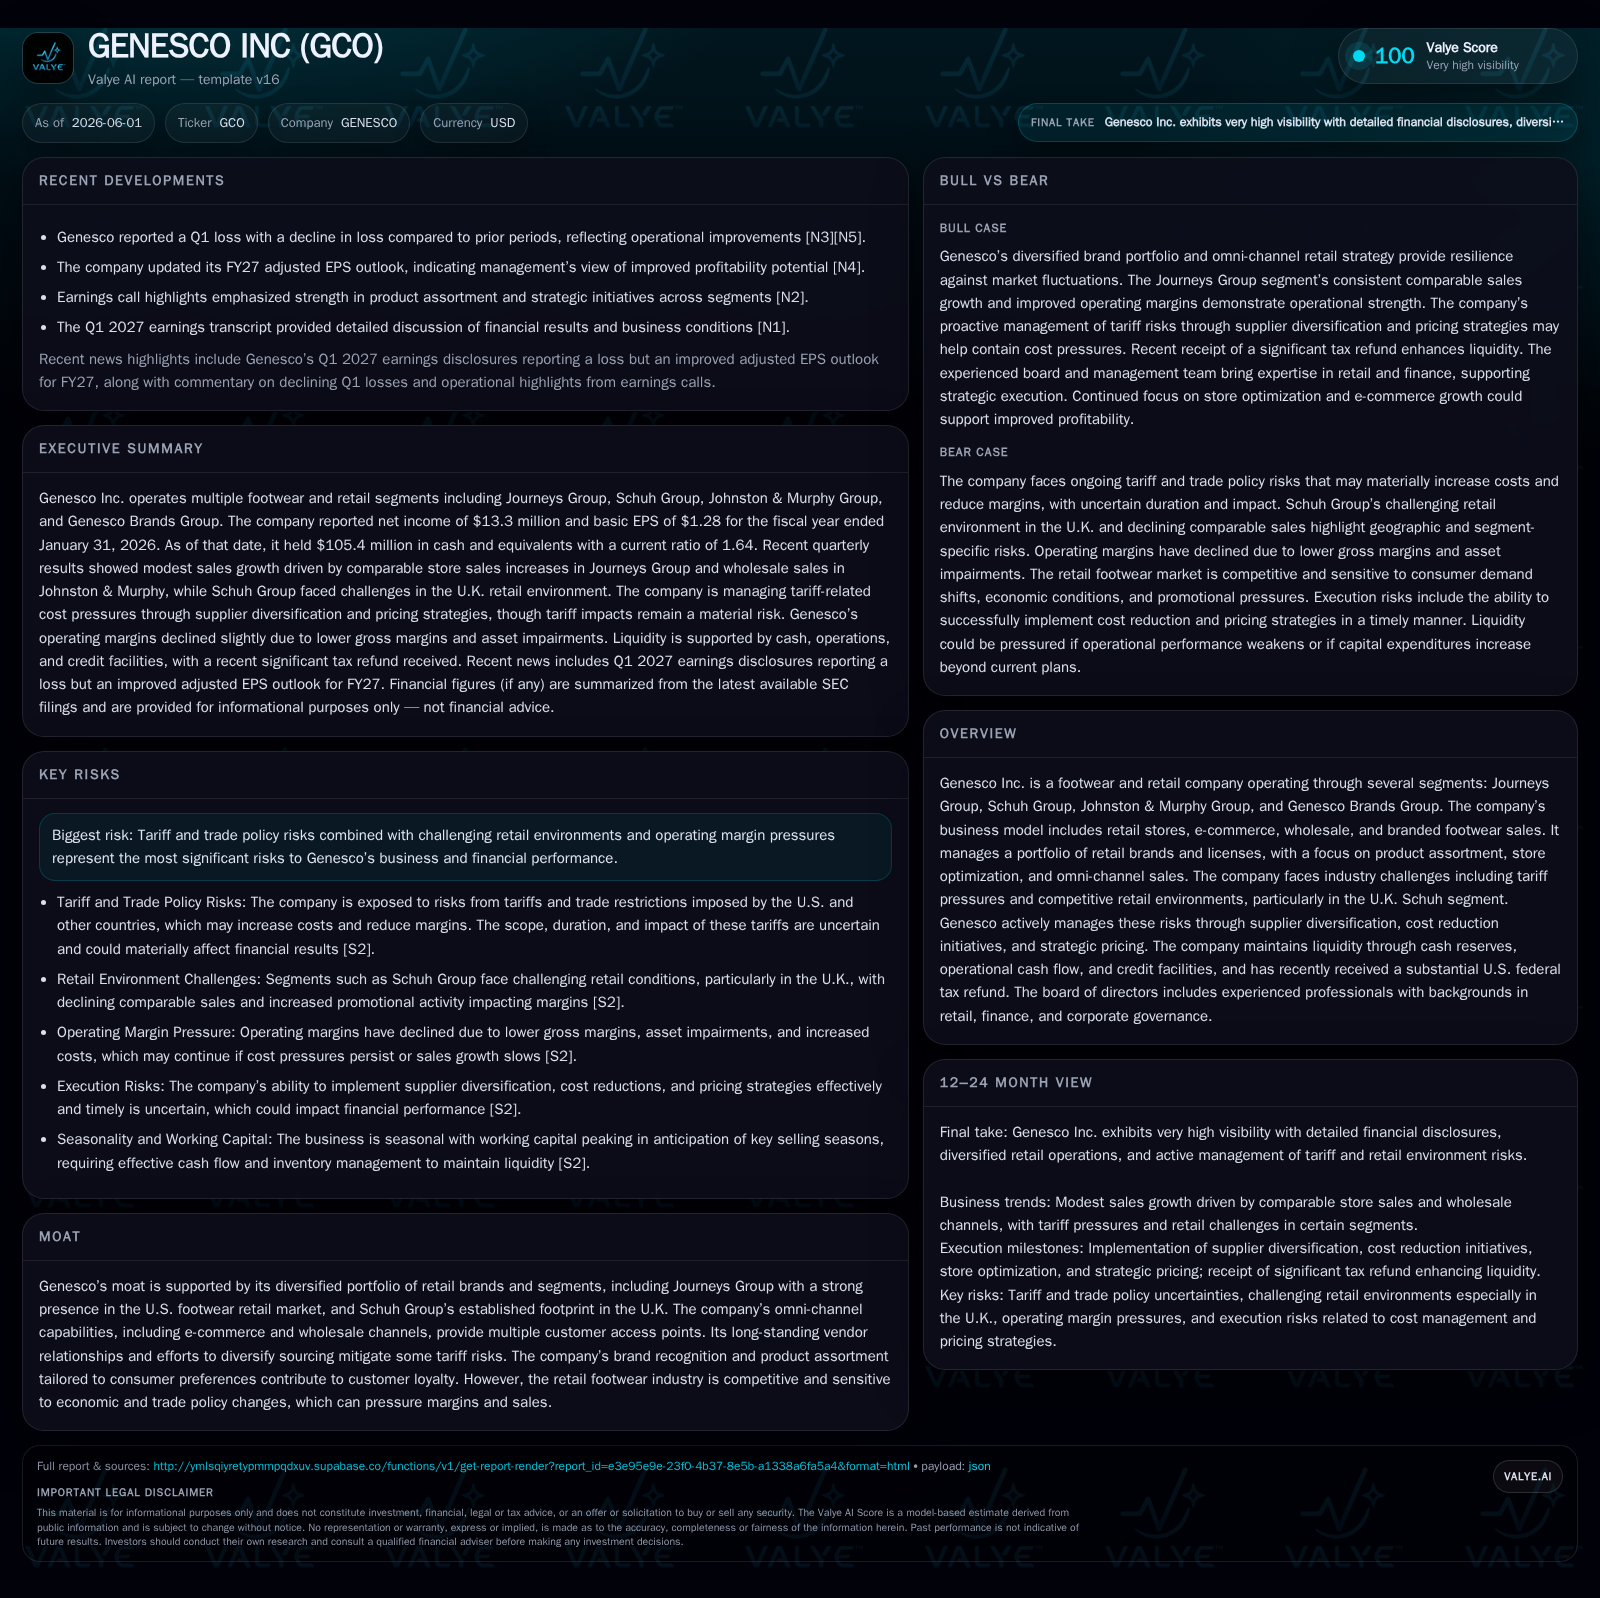
Genesco's third quarter Fiscal 2026 report indicates a 3.3% increase in net sales driven primarily by the Journeys Group, but operating margins declined due to tariff pressures, store restructuring, and heightened promotional activity in the Schuh segment. The company maintains a diversified retail footwear portfolio spanning U.S. and U.K. markets with omni-channel distribution but faces structural trade risks and competitive pressures. Liquidity remains healthy with strong cash reserves exceeding total debt, supporting ongoing investments focused on store renovations and strategic sourcing shifts to mitigate tariff impacts.
Recent Operating Update
Genesco Inc.'s third quarter Fiscal 2026 filings reveal incremental revenue growth tempered by notable margin pressure. Net sales rose 3.3% year-over-year to $616.2 million [S2], notably propelled by a 6% same-store sales surge at Journeys Group fueled by an enhanced product assortment strategy focused on core youth footwear styles complemented by back-to-school seasonal strength. However, this dynamic was partially negated by a contraction in Schuh Group comparable sales (-2%) during challenging retail conditions in the UK market — Schuh's largest footprint geographically [S2]. Johnston & Murphy also saw a modest decline (-2%) influenced by weaker e-commerce sales linked to marketing spend shifts.
Although gross margin dollars increased slightly ($288.6M vs $285.3M), gross margins as a percentage of sales fell approximately 100 basis points primarily due to tariff pressures hitting Genesco Brands Group’s licensed products portfolio as well as elevated promotional activity within Schuh aiming to defend market share versus intensified competition [S2]. Operating margins compressed from 1.7% to 1.4%, largely reflecting these gross margin effects alongside $4.3 million in impairment charges linked to ongoing store restructuring initiatives designed to optimize the retail footprint [S2]. Notably, selling expenses declined as a percentage of sales due to efficiency gains including reduced occupancy costs.
Business Model Overview
Genesco operates through four distinct segments: Journeys Group (U.S.-focused youth footwear retail), Schuh Group (U.K.-based footwear retail), Johnston & Murphy Group (premium men’s footwear and apparel), and Genesco Brands Group (branded/licensed product sales). Revenue generation stems from diverse channels including brick-and-mortar stores, e-commerce platforms, wholesale partners, and direct branded footwear sales [S1]. This multi-channel approach supports broad consumer access while balancing exposure between direct retail dependability and wholesale partnerships.
The business model emphasizes curated product assortments tailored per brand segment—Journeys targets trend-conscious younger demographics via trend-right styles, whereas Johnston & Murphy focuses on heritage-inspired premium shoes. Schuh leverages both physical stores and heavily developed e-commerce channels (accounting for over 40% of its sales), reflecting consumer migration online especially pronounced in Europe [S2][S20]. Direct sourcing accounts for roughly 20% of sales via Genesco Brands Group with the remaining majority reliant on vendor partners supplying retailer inventories.
Revenue is driven critically by same-store/same-channel comparable sales performance together with pricing discipline amid rising input costs from tariffs affecting imported goods [S1][S2]. Costs pass-through abilities are currently constrained; tariff-induced inflation leads to tighter gross margins despite attempts at incremental strategic price increases primarily on wholesale channels [S2]. Capital resources enable investments focused on store renovations (~75-80% of capex) to improve consumer engagement environments alongside omni-channel capabilities expansion [S8].
Industry Structure and Competitive Position
Genesco participates principally in the competitive North American and U.K. footwear retail markets characterized by high fragmentation, intense price competition, and shifting consumer preferences toward digital fulfillment options. Competitors range from specialty chains (e.g., Foot Locker) to mass-market apparel retailers with growing private-label penetration that challenges pricing power.
The company's moat arises from diversified brand segmentation allowing targeting of multiple consumer niches and geographies—with Journeys strongly positioned among youth consumers seeking fashion-forward sneakers, while Schuh offers a significant European presence blending offline/online engagement. Long-standing vendor relationships partially mitigate supply chain volatility though tariff exposures represent a persistent structural risk as sourcing decisions necessitate balancing cost versus delivery flexibility.
Omni-channel integration is pivotal; Journeys' investment in brick-and-mortar innovation alongside digital expansion underpins its robust comparable store improvement (+6%), contrasting with Johann & Murphy's softer e-commerce dynamics reflecting evolving buyer journeys [S2][S9]. Schuh’s elevated e-commerce share (>40%) signals adaptation to regional preferences but its exposure to adverse UK macroeconomic conditions introduces growth uncertainties.
Growth Drivers
- Journeys Group Momentum: Continued focus on revitalizing physical stores coupled with compelling product assortments fuels customer traffic increases leading to improved same-store sales gains. Initiatives include aggressive localized marketing campaigns tying into sneaker culture trends.
- Private Label Expansion: Within Genesco Brands Group, growing private-label offerings like Dockers underpin incremental revenue gains offsetting declines in certain licensed lines exiting the portfolio [S2].
- Omni-channel Enhancement: Broadening e-commerce capabilities particularly within Schuh enables capturing shifting consumer spending patterns crossing digital/physical divides.
- Supply Chain Diversification: Active supplier diversification seeks reduced dependency on high-tariff countries through nearshoring or alternate markets potentially stabilizing future input cost inflation.
- Strategic Pricing Action: Planned price increases especially within wholesale channels aim at recovering margin erosion though these must be calibrated carefully against potential demand elasticity.
Risks and Watchpoints
- Tariff Exposure: Elevated import tariffs from U.S., China, Vietnam, India and retaliatory measures elevate cost bases impacting brands disproportionately depending on direct sourcing levels [S1]. The inability to fully pass through these costs without volume loss weakens profitability.
- Retail Environment Pressure: The U.K.’s continued macroeconomic challenges weigh heavily on Schuh’s top line and margin performance necessitating ongoing promotional intensity risking margin dilution [S2][S20].
- Margin Compression: Increased closeout selling required due to license exits combined with inventory provisions complicate gross margin stability across Brands Group segments.
- Store Rationalization Execution: Store closures and remodeling carry execution risk including potential disruption of customer experience or brand dilution if not managed effectively [S2].
- E-commerce Competitiveness: Keeping pace technologically with digitally native competitors requires continuous investment which could pressure operating expenses if return thresholds are not met.
What to Watch Next
Investors should monitor several key operational indicators for validation of management strategies:
- Comparable store sales trends across Journeys, Schuh, Johnston & Murphy—early traffic or ticket improvements post remodels will signal success.
- Gross margin trajectory specifically around tariff mitigation outcomes or closure/liquidation activities affecting inventory turns.
- Capital expenditure pacing relative to guidance ($55-$65 million for FY26), particularly allocation between new stores vs remodels [S8][S24].
- Progression on supplier diversification documented through public updates or SKU-level sourcing disclosures.
- E-commerce penetration rates beyond the current ~40% level at Schuh signaling channel shift capture.
- Quarterly operating income margins evolution versus prior quarters which remain thin (~1.4%) underscoring leverage challenges.
Financial Profile Summary
As of January 31, 2026, Genesco held healthy liquidity positions with $105 million in cash & equivalents comfortably exceeding total debt of approximately $90 million recorded as of November 2025 resulting in a net cash stance of roughly $16 million [F1]. The current ratio stands at a sound 1.64 reflecting ample short-term asset coverage over liabilities ensuring near-term financial flexibility [F1].
Capital expenditures have risen compared to prior year periods primarily supporting store investments intended to drive customer experience enhancement amidst competitive pressures [S8]. Financing activities increased net borrowings indicating deliberate leveraging possibly funding working capital needs aligned with seasonal business models peaking around back-to-school timelines [S8].
Despite net losses reported earlier during FY26 periods impacted by non-cash impairments totaling over $4 million alongside higher promotional discounts compressing gross profit percentage margins below historical averages (~46–47%), reduced operating expense ratios relative to revenue supported containment of operating losses within narrow bounds highlighting management’s ongoing cost control focus [S2][F1]
This analysis synthesizes data up through Genesco Inc.’s fiscal third quarter filings ending November 2025 along with their latest annual proxy disclosures covering Fiscal Year ended January 31, 2026. It aims to objectively present operational developments contextualized within industry norms while acknowledging the structural headwinds faced particularly from external trade policies and volatile retail landscapes without extrapolating unsupported forward-looking statements or making investment research views.
Disclaimer: This is research-only, informational analysis and not investment advice. It may include AI-generated interpretation and general industry context. Always verify important details using primary sources.

Comments