
Grid Dynamics Advances AI Leadership with Robust Growth and Strategic Capital Moves
Grid Dynamics leverages senior engineering talent, a proprietary AI engagement model, and disciplined capital allocation to accelerate enterprise AI adoption.
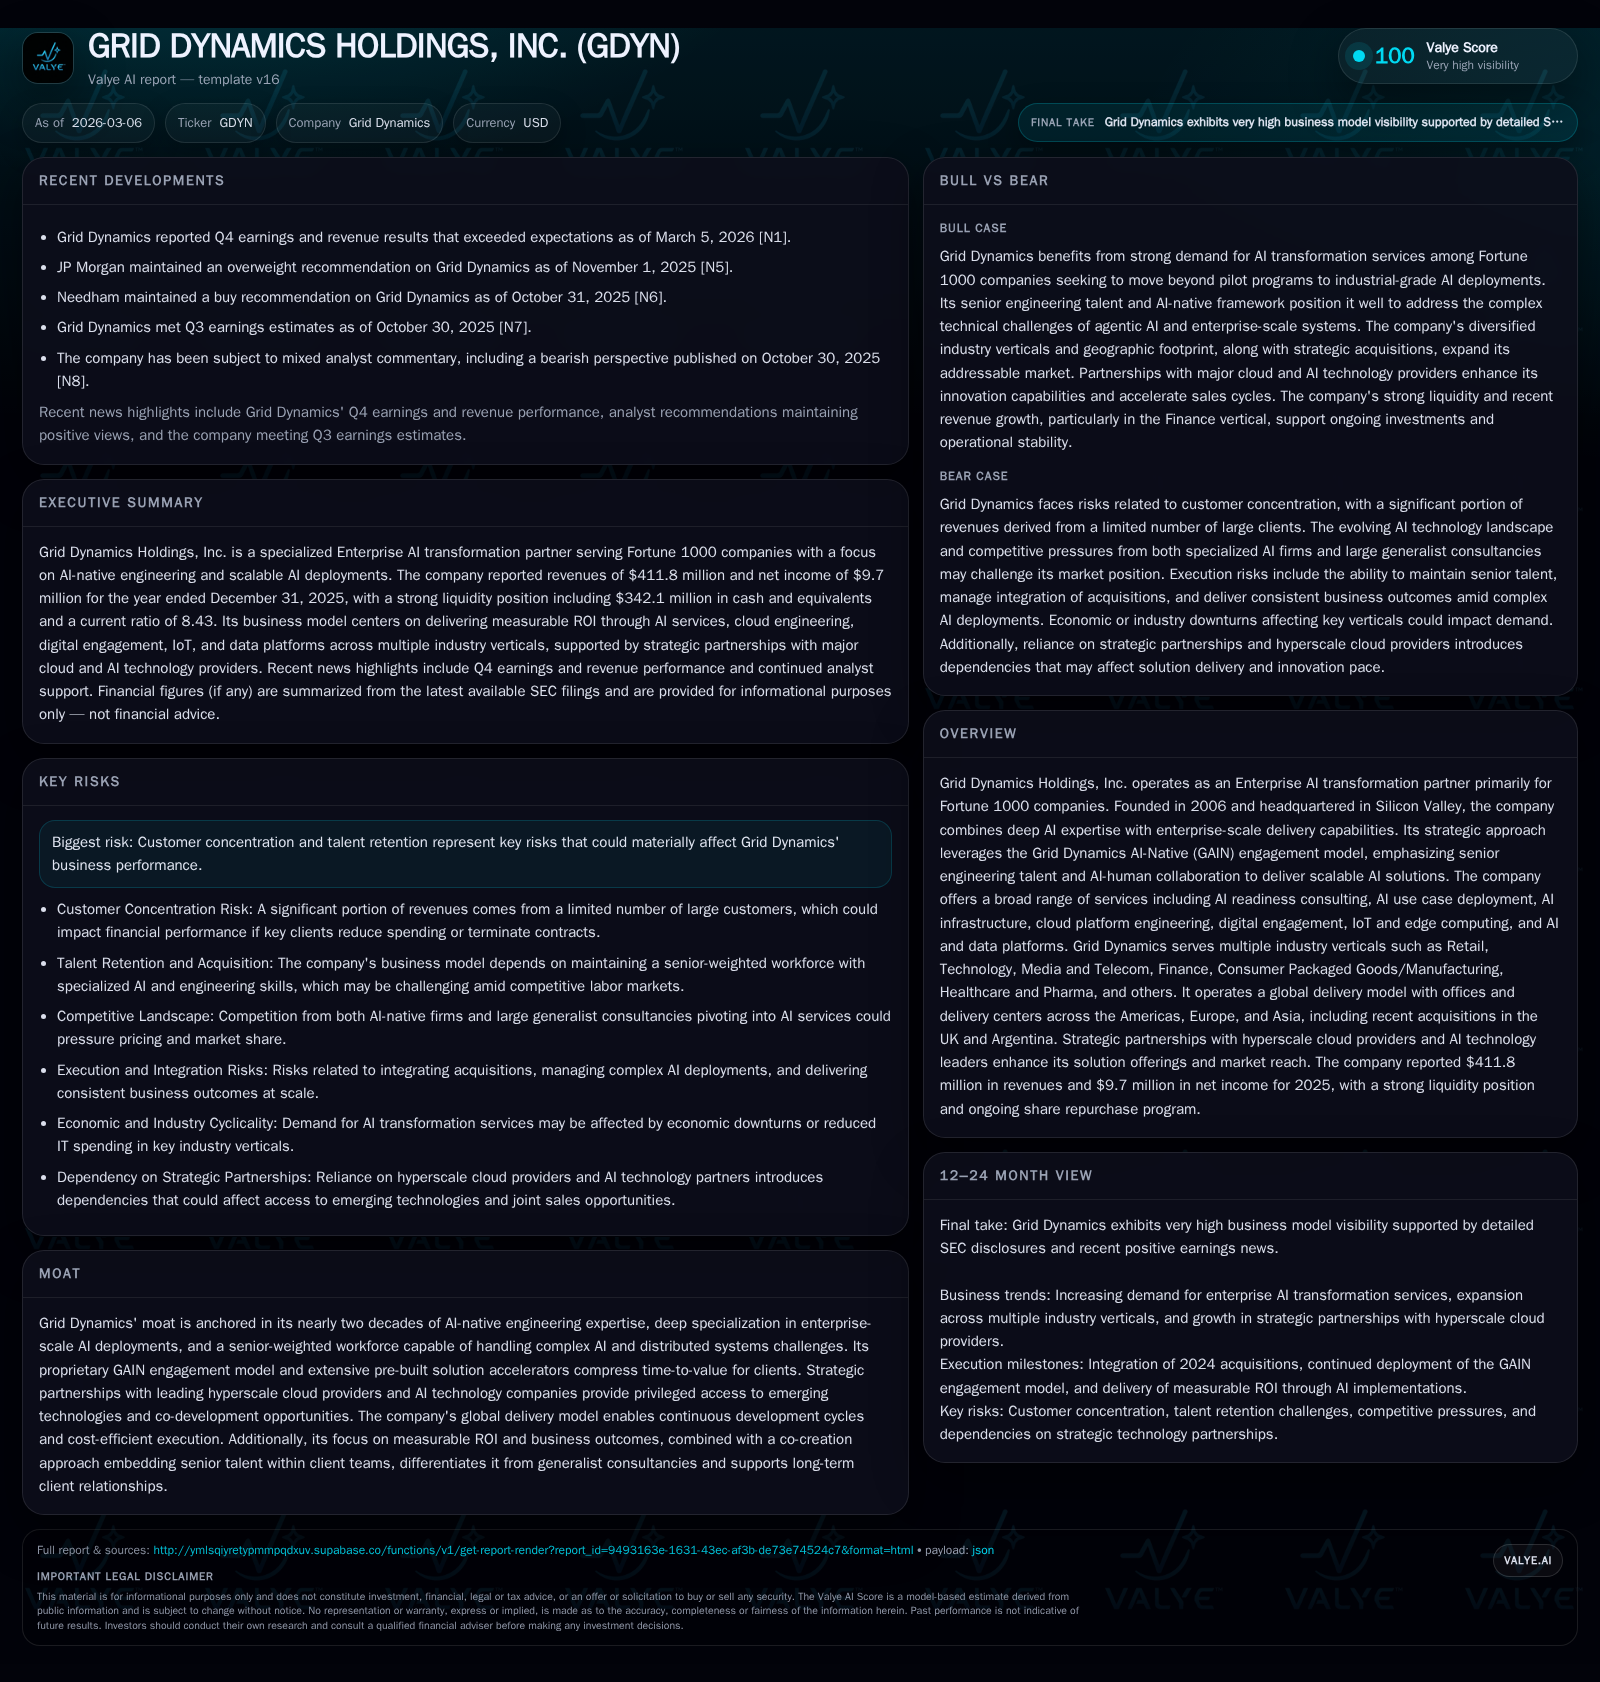
Grid Dynamics Holdings, Inc. has shown marked improvement in profitability from substantial prior losses, driven by its deep AI-native engineering expertise and the strategic GAIN engagement model. The company’s senior-weighted workforce and global delivery footprint underpin its competitive moat, while significant revenue growth is supported by expansion in key verticals such as Finance and Technology. Operational cash flow increased substantially with concomitant capex in scalable solutions, enabling modest share repurchases without dividends. Ongoing risks include customer concentration and talent retention, making utilization metrics and client diversification essential to monitor.
Foundations of Growth: Historical Performance Trends and Drivers
Grid Dynamics has transitioned from a phase characterized by heavy losses into profitable territory with notable momentum in fiscal year 2025. The net income turned positive at approximately $9.7 million, up more than 139% from around $4 million in 2024 [F1]. Operating income has concurrently improved by roughly 10% year-over-year, narrowing the loss to just under $2 million while remaining modestly negative [F1]. This operational upswing reflects both revenue acceleration and disciplined expense management amidst growth investments.
Operating cash flow (CFO) expanded robustly by over a third (34.4%) to $40.6 million versus $30.2 million in the prior year, signaling stronger core business efficiency [F1]. Capex growth accelerated by about 30%, reaching $15.3 million in 2025, indicative of targeted investments aimed at scaling the company’s AI delivery infrastructure [F1]. These figures illustrate Grid Dynamics’ shift towards sustainable growth infrastructure while healing bottom-line performance.
Historical performance (annual)
| FY | Net ($mm) | CFO ($mm) | OpInc ($mm) | Capex ($mm) | Net YoY |
|---|---|---|---|---|---|
| 2025 | 10 | 41 | -2 | 15 | +139.2% |
| 2024 | 4 | 30 | -2 | 12 | +329.0% |
| 2023 | -2 | 41 | -6 | 8 | +94.0% |
| 2022 | -29 | 32 | -21 | 6 |
Source: SEC companyfacts cache [F1].
Capital returns and efficiency (annual)
| FY | Buybacks ($mm) | FCF ($mm) | ROE% |
|---|---|---|---|
| 2025 | 2 | 25 | 1.8 |
| 2024 | 18 | 0.8 | |
| 2023 | 33 | -0.5 | |
| 2022 | 0 | 26 | -8.0 |
Source: SEC companyfacts cache [F1].
Data reflects fiscal years ended December; amounts in millions USD [F1].
Deep-Rooted AI Expertise Fuels Revenue Expansion
Founded in Silicon Valley in 2006 with a foundational emphasis on distributed systems, real-time data integration, machine learning algorithms, and natural language processing, Grid Dynamics stands out as an AI-native engineering firm rather than a generalist consultancy [S1][S14][S23]. This heritage enables it to serve Fortune 1000 clients deploying complex enterprise AI use cases requiring scale and reliability.
Central to its competitive advantage is the proprietary GAIN (Grid Dynamics AI-Native) engagement model [S14], which rethinks team composition with a focus on senior engineers collaborating fluidly alongside AI agents in a co-creation framework—accelerating development cycles and increasing output quality.
An extensive library of over forty pre-built solution accelerators spanning AI models, data platforms, cloud orchestration tools, and industry-specific templates give Grid Dynamics a head start that compresses clients' time-to-value from months or years to weeks [S14][S23]. Strategic partnerships with hyperscale cloud leaders such as Google Cloud, AWS, Microsoft Azure, plus technology pioneers like NVIDIA enhance technical differentiation and foster co-development synergies [S20][S22].
The company’s technology stack and engineering depth position it favorably against competitors attempting retrofit AI capabilities onto legacy service models.
Workforce Strategy: Senior Talent as a Core Competitive Moat
Grid Dynamics’ workforce strategy is integral to sustaining its market position amid fierce competition for specialized tech talent [S1]. Total personnel jumped from roughly 3,920 to nearly 5,000 employees between end-2023 and end-2025—a nearly 27% increase—with significant growth concentrated in Europe (+452 employees from 2023-25) alongside expansions across Americas and Rest of World regions [S1].
This rapid scaling targets predominantly IT professionals weighted heavily toward senior engineers capable of architecting complex systems versus large pools of junior developers typical of traditional IT service firms [S14]. High billable hours utilization rates are tracked closely by grouping employees regionally or by project using ratios of billable over available hours [S1][S7], guiding recruitment and deployment decisions.
Retention remains paramount; attrition risk is explicitly cited as a material threat due to competitive labor markets across all operating geographies [S1]. Initiatives include fostering work on cutting-edge projects for marquee customers, flexible working arrangements, continuous technical education via an internal "Grid University," and culture-building programs designed to embed employee engagement [S14][S25].
Customer Base Evolution and Concentration Management
Revenue concentration remains elevated but stable as Grid Dynamics balances long-term client relationships with rationalizing smaller accounts for portfolio efficiency [S4][S21]. In FY2025 one customer contributed approximately 15.4% of total revenues — consistent with prior years (16% in FY2024)—indicating reliance on key accounts [S4].
Top five clients cumulatively delivered just above one-third (38%) of revenues whereas top ten customers represented nearly three-fifths (57.7%)—a slight increase relative to ~55.7% in FY2024—reflecting focused account expansion strategies within larger partnerships [S4]. The top twenty made up over 73% of revenues highlighting moderate client concentration but also demonstrating deep penetration within key verticals.
Simultaneously the company decreased its total customer count from 264 in FY2024 to around 237 clients in FY2025 as part of active portfolio rationalization aimed at prioritizing strategic engagements [S1][S4]. Client segmentation shows increasing number of customers crossing higher revenue buckets (>$5 million per account increased from ten to eighteen clients over two years), which supports revenue stability while improving service focus.
Enterprise AI Market Opportunities and Growth Constraints
Grid Dynamics serves multiple vertical sectors including Retail—the largest contributor (nearly $120M revenue), Technology/Media/Telecom (TMT), Finance (strongest growth segment), Consumer Packaged Goods/Manufacturing (CPG), Healthcare/Pharma, plus others [S10][S17].
Finance revenue surged +66.9% year-over-year reaching over $100 million driven primarily by fintech demand along with regulatory compliance automation tools requiring industry-specific domain expertise offered through the company’s established banking relationships and acquisitions like JUXT Ltd (UK) [S5][N1]. The company differentiates here via built-for-purpose AI applications addressing complex regulations that generic providers typically struggle with.
Retail remains steady growing +5.7%, fueled by specialty retail verticals optimizing customer experience and inventory using agentic commerce solutions [S17]. TMT saw +13% lift due mainly to expansions within top technology clients demonstrating client loyalty dynamics.
Conversely Healthcare/Pharma saw slight contraction reflecting sector-specific challenges including longer sales cycles for regulated entities and hiring constraints limiting faster penetration despite meaningful cloud modernization initiatives underway [N1][S17].
Key constraints include intense competition for senior talent required across these domains impacting scalability; customer concentration also poses risk if large contracts are renegotiated or delayed; foreign currency exposure adds volatility given extensive global presence across emerging markets such as Eastern Europe and Latin America which feature operational cost advantages but also geopolitical sensitivity [S18][S19].
Capital Deployment: Operational Cash Flow Driving Investment
Strong operational cash flow performance enabled meaningful capital reinvestment during FY2025 [F1][S24]. CFO grew more than one-third YoY to $40.6 million amid expanded working capital management efficiencies including payable timing optimization [S24].
Capex rose correspondingly (+30%) reaching $15.3 million mainly devoted to development of scalable AI platform capabilities supporting the GAIN model’s delivery acceleration ambitions alongside investments in cloud infrastructure tooling and internal R&D pathways targeting enhanced automation [F1][S9].
Capital allocation priorities included limited share repurchases totaling approximately $2 million while no dividends were paid—all supported by a very healthy liquidity position standing at approximately $342 million cash & equivalents at year-end yielding an exceptional current ratio above eight times current liabilities signifying excellent short-term financial flexibility [F1][S6].
The absence of outstanding debt under revolving credit facilities with JPMorgan Chase Bank underscores a conservative financial posture allowing focus on value-enhancing organic investments without leverage burden risks [F1][S8].
Profitability Turnaround and Path to Sustainable Margins
Despite net income turning positive sharply in FY2025 ($9.7 million vs $4 million prior year), operating income remains slightly negative near -$1.9 million though reflecting continuous improvement trends (+10% YoY) evidencing margin pressuring investments linked to scaling operations and expanding global engineering capacity [F1].
Gross margins declined marginally by around 160 basis points driven partly by foreign exchange fluctuations and incrementally higher costs primarily attributable to geographic wage inflation in key delivery centers impacting cost of revenues despite absolute gross profit gains exceeding $15 million compared to prior year levels [S9][F1].
As ROE approximates around +1.8%, this suggests net profitability benefits were enhanced through non-operational factors including tax adjustments or timing differences without full conversion yet into operating leverage profits; however this reflects progress toward sustainable margin generation once scale effects amortize investment outlays over coming years [F1].
Continued margin improvement will depend on balancing utilization rates against compensation inflation alongside sustained client wins across high value verticals.
What to Watch: Catalysts and Risks Shaping Future Outcomes
While explicit forward guidance is not publicly disclosed currently beyond anecdotal cues reported recently [N1], key indicators include quarterly tracking of billable hours utilization rates—critical for maintaining margin thresholds amid hiring waves—and attrition metrics signaling ability or difficulty retaining senior specialists required for GAIN model execution effectiveness [S1].
Client concentration evolution bears watching given one customer still contributes more than fifteen percent revenue share; diversification progress especially through expansion into fintech verticals will be vital for revenue stability during cyclical slowdowns or contract renewals.
Seasonal impacts tied especially to retail demand timing affect quarterly performance variability due to holiday calendar shifts reflected historically across reporting periods underscoring importance of multi-quarter view analysis for trend recognition.
On the risk front talent retention challenges amplified by global competitive pressures remain foremost; any weakening here could constrain delivery capabilities directly impacting gross profit margins as described within SEC filings discussing attrition risk impact scenarios [S18].
Currency translation exposures affecting earnings volatility remain present given operations running partially through currencies vulnerable to market instability although hedging programs introduced recently attempt partial mitigation [S19].
No materially adverse legal proceedings currently pending alleviates near-term litigation risks at present although such could emerge unexpectedly given the intellectual property rich environment inherent in advanced AI software services domains [S18].
Summary
Grid Dynamics exemplifies an emerging leader rooted deeply in enterprise-scale AI transformation propelled by decades-long technical expertise reengineered via the GAIN engagement framework emphasizing senior talent integration for measurable business impact rather than novelty experimentation alone. Improved profitability accompanied by robust cash flows enables purposeful investment into scalable platforms supporting geographic expansion complemented by systematic efforts toward client base optimization balancing concentration pressures with strategic account growth. Continued vigilance around talent market dynamics along with utilization monitoring will be key performance levers shaping future operational leverage success amid competitive landscape shifts poised across multiple adjacent industry verticals.
This analysis is based exclusively on publicly available filings dated through early March 2026 ([F1],[N1],[S#]) without any forward-looking investment recommendations or price targets.
Disclaimer: This is research-only, informational analysis and not investment advice. It may include AI-generated interpretation and general industry context. Always verify important details using primary sources.
Comments